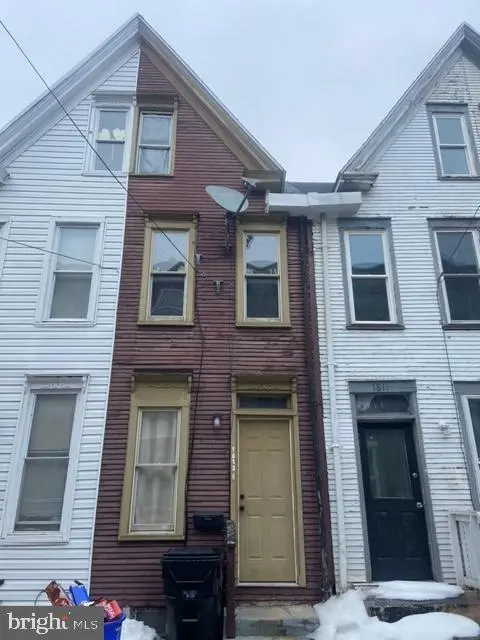
1813 Susquehanna St · Harrisburg, PA
Flood risk 9/10 · Severe
- FEMA flood zone
- X (unshaded)
- Chance of flooding over 30 yrs
- 0.99%
- Est. flood insurance / yr
- $473 – $860
Fire risk 1/10 · Minimal
- Est. fire insurance / yr
- $511 – $949
Heat risk 6/10 · Moderate
- Hot days now (above 101°F)
- 7 days/yr
- Hot days in 30 yrs
- 15 days/yr
Wind risk 2/10 · Minimal
- Chance of severe wind over 30 yrs
- 4.0%
Air-quality risk 2/10 · Minimal
- Unhealthy air days now
- 1 days/yr
- Unhealthy air days in 30 yrs
- 3 days/yr
Risk factors via First Street. Map © Google.
Why this score? — see what drove the B+ grade
The composite is a weighted blend of 9 inputs, each scored 0–100. Each bar is that input's sub-score; the figure is the points it added to the 100-point composite (weight × sub-score).
- Cash flow +30.0/30.0
- ARV discount +15.0/15.0
- DSCR +10.0/10.0
- 1% rule +9.0/10.0
- Livability +4.2/5.0
- Rent growth +3.6/5.0
- Condition / age +2.5/5.0
- Schools +0.8/10.0
- Appreciation +0.0/10.0
$99,000
🖨 Deal sheet 📄 Offer letter ✓ Due diligence
Listing remarks MLS
REDUCED!! Motivated Seller!! Brand new complete rehab. Fresh paint, new floors. Excellent opportunity for the 1st time buyer who may be eligible for the Dauphin County 1st time buyer program. Also an opportunity for the investor. Previously rented for $725.00 monthly. This home is in move-in-condition. Motivated seller looking for offers!! Schedule your showing today!
Key facts
- Built 1900
- Listed 20 days
Property features AI
Exterior
- Parking: On-street parking
- Utilities: Public water; Public sewer; 200+ amp electric service; Electric hot water
- Home design: Interior townhouse/rowhouse; Frame (stick-built) construction
- Construction: Metal and rubber roof; Stone foundation; Built (year per assessor)
- Exterior features: Patio(s); Not in a federal flood zone
Interior
- Kitchen: Electric oven/range
- Bedrooms: Two bedrooms on the first upper level; One bedroom on the second upper level
- Bathrooms: One full bathroom (upper levels)
- Heating & cooling: Electric baseboard heating; Electric cooling (electric-powered system)
- Interior features: Formal separate dining room; Unfinished basement with interior access; Poured concrete foundation
- Laundry & utility: Laundry room (interior)
Neighborhood map
What this means for you Summary
Snapshot
- This is a 3-bed/1.0-bath townhouse listed at $99k.
Deal economics
- At list price, monthly cash flow is $348 ($4k/yr) — positive.
- The deal already cash-flows at list — no discount required.
- Meets the 1% rule at list price ($1k rent vs $99k).
- Recommended offer: $98k (1.5% below list) — sets the bar for market timing.
- Cap rate 11.2% vs local median 6.6% in Harrisburg — top-decile yield for the area; either an underpriced asset or a hidden risk that comps aren't pricing in. Stress-test before assuming the spread holds.
Location & tenants
- Location reads 84/100 on livability (#107 in PA, #826 nationally) — a professional / high-income tenant draw. Strengths: amenities A+, commute A+, cost of living A+; Watch: employment D, crime F.
- Harrisburg City SD (urban): math 6% / reading 13% proficiency, ranked #535 of 539 in PA (top 99%) — low school quality limits family demand, transient renter base, plan for 1-2y turnover; 82% free/reduced lunch — lower-income household profile, screen leases tightly.
- Zoned schools: Harrisburg Hs (math 24% / reading 10%, grade F, #399 of 437 statewide, top 92%, 1,230 students, 100% FRL) — zoned schools average 100% FRL vs 82% district-wide (18 pts higher); higher-poverty schools than district average — tighter screening recommended.
- Market conditions: Rents rising fast (+4.3%/yr); 58 active listings in the ZIP; 38 comparable units currently listed for rent nearby; rentals at typical pace (median 24d on market — plan ~3-4 weeks tenant-placement turnaround); 540 units permitted in Dauphin County in 2024 (194 in 5+ unit buildings).
- This rent runs 31% of the median local income ($55k/yr) — at the standard rent-burdened threshold; future hikes will face affordability resistance.
Forward outlook
- Local home prices are declining (-3.0%/yr); year-one equity from $684 of loan paydown is wiped out by about $3k of value loss. Plan a longer hold.
- At projected returns (-3.0% appreciation + 4.3% rent growth), your $28k cash investment doubles in ~8 years — after that, you're playing with house money.
Negotiation context
- It's been on market 20 days — a 2% lower offer ($98k) is reasonable based on typical stale-listing flexibility.
- 5 sale attempts since 17y ago with the ask held roughly flat each time — persistent listings suggest the price (not the market) is what's stuck; bring a comps-based counter.
Risks & watch-outs
- Watch-outs: flood insurance adds $56/mo; built in 1900 — expect roof / HVAC / electrical / plumbing capex.
- Climate carrying-cost: severe flood risk; extreme-heat days projected 7→15/yr by 2055 (HVAC capex compounding) — expect insurance premiums to compound above CPI over the hold.
Questions for the listing agent
- Built in 1900 — when were the roof, HVAC, electrical panel, plumbing, and water heater last replaced?
- What's the actual annual flood-insurance premium (NFIP or private), and is the property in a SFHA with mandatory coverage?
- Is there a deadline driving the sale (1031 exchange, divorce, estate, relocation)? That informs how much negotiation room exists.
- Crime grade is F in this area — have there been break-ins, vandalism, or insurance claims at this property in the last 3 years? What carrier currently insures it and at what premium?
- What's the average days-on-market for RENTAL listings here right now (not sales)? A rising rental-DOM trend means longer vacancies and softer asking-rent achievability than the comps imply.
- What's the recent tenant-quality profile in this submarket — average credit score on applications, eviction rate, late-payment / NSF rate, and stable-employment percentage? A property-management company in the area should have these aggregated.
- How much new for-sale + rental construction is in the pipeline within 1–3 miles? Heavy new supply typically softens prices + rents 12–24 months out; constrained supply supports both.
Investment metrics
- 1% rule
- 1.40% ✓
- Cap rate
- 11.18%
- Cash-on-cash
- 17.46%
- DSCR
- 1.78
- GRM
- 5.9
CMA / ARV
- ARV (median comp)
- $119,831
- List price
- $99,000
- Delta
- -17.38%
- Verdict
- UNDERPRICED
- Comps
- 20 within 1.0 mi
Show comp detail 12 sales within ~0.75 mi
| Address | Dist | Beds/Ba | Sqft | Sold | Price | $/sf | Match |
|---|---|---|---|---|---|---|---|
| 1933-1/2 Logan St | 0.15mi | 3/1.0 | 931 (+2%) | 7mo | $110,000 | $118 | 83 |
| 1815 Susquehanna St | 0.00mi | 3/1.0 | 986 (+9%) | 13mo | $92,500 | $94 | 75 |
| 1525 N Front St #208 | 0.30mi | 2/1.0 (-1) | 973 (+7%) | 7mo | $220,000 | $226 | 64 |
| 1316 Green St | 0.43mi | 2/2.0 (-1) | 946 (+4%) | 3mo | $135,000 | $143 | 61 |
| 1525 N Front St #508 | 0.30mi | 2/1.0 (-1) | 973 (+7%) | 15mo | $208,000 | $214 | 57 |
| 645 Camp St | 0.58mi | 3/1.0 | 996 (+10%) | 2mo | $83,500 | $84 | 55 |
| 927 Rose St | 0.70mi | 2/1.0 (-1) | 864 (-5%) | 2mo | $147,000 | $170 | 52 |
| 1525 N Front St #604 | 0.29mi | 2/1.0 (-1) | 1,039 (+14%) | 10mo | $279,900 | $269 | 49 |
| 2447 Penn St | 0.72mi | 2/1.0 (-1) | 960 (+6%) | 5mo | $110,000 | $115 | 48 |
| 2306 Orange St | 0.53mi | 2/1.0 (-1) | 812 (-11%) | 8mo | $114,374 | $141 | 46 |
| 2427 Penn St | 0.69mi | 2/1.0 (-1) | 960 (+6%) | 10mo | $110,000 | $115 | 45 |
| 1525 N Front St #609 | 0.30mi | 2/1.0 (-1) | 1,039 (+14%) | 20mo | $225,000 | $217 | 41 |
Match score weights: distance 35% · size 25% · config 20% · recency 20%. Top-matched comps best support the ARV.
Projected returns pro-forma
-3.0% appreciation · 4.29% rent growth · sell at horizon
- IRR
- 7.3%
- Equity multiple
- 1.29×
- Total profit
- $7,989
- Equity at exit
- $14,761
- IRR
- 17.8%
- Equity multiple
- 2.57×
- Total profit
- $43,412
- Equity at exit
- $8,560
Cash invested: $27,720 (down + closing). Projections, not guarantees.
Landlord ↔ Tenant lean methodology
- Overall (STATE)
- 62 Landlord-Friendly
- State Pennsylvania
- 62 Landlord-Friendly · EVEN
- County
- — inherits STATE
- City
- — inherits STATE
ZIP-level market 17102
- Home prices YoY
- -3.9%
- Rents YoY
- 4.3%
- Active inventory
- 58
- Price-to-rent
- 5.9×
Monthly cashflow live
- Estimated rent
- $1,389 high interval (Pro) →
- Mortgage (P&I)
- −$519
- Tax from tax record
- −$134 /mo · $1,606/yr
- Insurance
- −$41
- Flood insurance flood zone
- −$56 /mo · $666/yr
- HOA
- −$0
- Vacancy / Maint / Mgmt
- −$292
- Net cashflow
- $348
Break-even live
UW: 25.0% down · 7.5% · 30yr · 1.5% tax · 5.0% vac · 8.0% maint · 8.0% mgmt
Financing live
Cash to close
- Down payment
- $24,750
- Closing costs
- $2,970
- Reserves months
- —
- Total cash needed
- —
Loan-product check · same deal, 3 products live
Conventional
25% down · 7.5% · 30yr
- Down + closing
- —
- Monthly P&I
- —
- Monthly cashflow
- —
- DSCR
- —
- Eligible?
- —
Personal DTI + credit; lowest rate.
DSCR
20% down · 8.5% · 30yr
- Down + closing
- —
- Monthly P&I
- —
- Monthly cashflow
- —
- DSCR
- —
- Eligible?
- —
No personal income docs; deal must DSCR.
Hard money
10% down · 12.0% · 12mo
- Down + closing
- —
- Monthly P&I
- —
- Monthly cashflow
- —
- DSCR
- —
- Eligible?
- —
Short-term bridge; refi at stabilization.
Rent comps 38 comps
| Address | Beds | Baths | Sqft | Rent | $/sqft | DOM | Units | Dist |
|---|---|---|---|---|---|---|---|---|
| 1839 Green St Harrisburg, PA | 1.0–2.0 | 1.0 | 815 | $1,595 | $1.96 | 14d | 1 | 0.04mi |
| 269 Peffer St Harrisburg, PA | 2.0 | 1.0 | 1000 | $1,195 | $1.20 | 44d | 1 | 0.11mi |
| 1821 N 2nd St Unit 2 Harrisburg, PA | 2.0 | 1.0 | 1000 | $1,299 | $1.30 | 14d | 1 | 0.12mi |
| 1909 N 4th St Harrisburg, PA | 2.0 | 1.0 | 1000 | $1,240 | $1.24 | 44d | 1 | 0.14mi |
| 2042 N 4th St Harrisburg, PA | 3.0 | 1.0 | 1090 | $1,400 | $1.28 | 44d | 1 | 0.21mi |
| 1700 N 2nd St Apt 6 Harrisburg, PA | 2.0 | 1.0 | 725 | $1,145 | $1.58 | 14d | 1 | 0.22mi |
| 1700 N 2nd St Apt 28 Harrisburg, PA | 2.0 | 1.0 | 720 | $1,095 | $1.52 | 44d | 1 | 0.22mi |
| 352 Harris St Harrisburg, PA | 2.0 | 1.0 | 810 | $1,350 | $1.67 | 21d | 1 | 0.27mi |
| 2312 Orange St Harrisburg, PA | 2.0 | 1.0 | 754 | $1,230 | $1.63 | 44d | 1 | 0.50mi |
| 1300 N 3rd St Apt 301 Harrisburg, PA | 2.0 | 1.0 | 635 | $1,345 | $2.12 | 23d | 1 | 0.51mi |
| 1211 Green St Apt 2 Harrisburg, PA | 2.0 | 1.0 | 850 | $1,095 | $1.29 | 23d | 1 | 0.56mi |
| 273 Cumberland St Harrisburg, PA | 2.0 | 1.0 | 865 | $1,595 | $1.84 | 14d | 1 | 0.59mi |
| 1122 Green St #14 Harrisburg, PA | 2.0 | 1.0 | 918 | $1,895 | $2.06 | 44d | 1 | 0.60mi |
| 1116 N 3rd St Unit 3 Harrisburg, PA | 2.0 | 1.0 | 1100 | $1,375 | $1.25 | 23d | 1 | 0.61mi |
| 1012 N 3rd St Apt 4 Harrisburg, PA | 2.0 | 1.0 | 560 | $1,395 | $2.49 | 23d | 1 | 0.65mi |
| 1001 N 3rd St Unit 4 Harrisburg, PA | 2.0 | 1.0 | 550 | $1,125 | $2.05 | 23d | 1 | 0.68mi |
| 660 Boas St Harrisburg, PA | 2.0 | 1.0–2.0 | 800 | $1,574 | $1.97 | 14d | 21 | 0.69mi |
| 923 N 3rd St Unit 1 Harrisburg, PA | 2.0 | 1.0 | 853 | $1,495 | $1.75 | 23d | 1 | 0.73mi |
| 920 N 2nd St Unit 1 Harrisburg, PA | 2.0 | 1.0 | 900 | $1,475 | $1.64 | 14d | 1 | 0.74mi |
| 918 Grand St Harrisburg, PA | 3.0 | 1.5 | 890 | $1,450 | $1.63 | 44d | 1 | 0.74mi |
| 919 Grand St Harrisburg, PA | 2.0 | 1.5 | 1116 | $1,695 | $1.52 | 23d | 1 | 0.74mi |
| 719 N 2nd St Apt 6 Harrisburg, PA | 2.0 | 1.0 | 1000 | $1,150 | $1.15 | 14d | 1 | 0.83mi |
| 2609 N 5th St Harrisburg, PA | 2.0 | 1.0 | 809 | $1,525 | $1.89 | 23d | 1 | 0.86mi |
| 618 N 2nd St Harrisburg, PA | 2.0 | 1.0 | 1000 | $1,050 | $1.05 | 23d | 1 | 0.89mi |
| 612 N 2nd St Apt 2 Harrisburg, PA | 2.0 | 1.0 | 1050 | $1,445 | $1.38 | 44d | 1 | 0.90mi |
| 612 N 2nd St Apt 3 Harrisburg, PA | 2.0 | 1.0 | 1100 | $1,545 | $1.40 | 44d | 1 | 0.90mi |
| 420 Wiconisco St Apt 5 Harrisburg, PA | 2.0 | 1.0 | 628 | $995 | $1.58 | 44d | 1 | 0.96mi |
| 116 Pine St Harrisburg, PA | 1.0–2.0 | 1.0–2.0 | 900 | $1,638 | $1.82 | 14d | 14 | 1.07mi |
| 210 Walnut St Unit 206 Harrisburg, PA | 2.0 | 1.0 | 1007 | $1,695 | $1.68 | 14d | 1 | 1.16mi |
| 400 W Crestwood Dr Camp Hill, PA | 1.0–3.0 | 1.0–2.0 | 1042 | $2,071 | $1.99 | 14d | 14 | 1.26mi |
| 916 May St Harrisburg, PA | 2.0 | 1.5 | 810 | $1,250 | $1.54 | 14d | 1 | 1.26mi |
| 319 Market St Harrisburg, PA | 2.0 | 1.5 | 990 | $1,135 | $1.15 | 44d | 1 | 1.26mi |
| 508 N 2nd St Wormleysburg, PA | 2.0 | 1.0 | 887 | $1,395 | $1.57 | 44d | 1 | 1.27mi |
| 3003 Pennwood Rd Harrisburg, PA | 3.0 | 1.0 | 900 | $1,395 | $1.55 | 14d | 1 | 1.34mi |
| 301 Chestnut St Harrisburg, PA | 1.0–4.0 | 1.0–2.5 | 1437 | $2,097 | $1.46 | 44d | 1 | 1.38mi |
| 301 Chestnut St Harrisburg, PA | 4.0 | 1.0–2.5 | 1437 | $2,525 | $1.76 | 14d | 10 | 1.38mi |
| 101 S 2nd St Harrisburg, PA | 2.0 | 1.0 | 736 | $1,749 | $2.37 | 14d | 32 | 1.42mi |
| 200 S Court St Harrisburg, PA | 1.0–3.0 | 1.0–2.5 | 950 | $1,800 | $1.89 | 14d | 14 | 1.49mi |
Listing history 19 events
-
2026-06-18days on market $99,000 Active 20 DOM
-
2026-06-17days on market $99,000 Active 19 DOM
-
2026-06-16days on market $99,000 Active 18 DOM
-
2026-06-15days on market $99,000 Active 17 DOM
-
2026-06-14days on market $99,000 Active 15 DOM
-
2026-06-13statusdays on market $99,000 Active 14 DOM
-
2026-05-09$99,000 Active 289-char remark
-
2026-05-07historical $99,000 289-char remark
-
2019-10-18soldstatus $328,000
-
2016-08-31historical
-
2016-05-31$79,900
-
2016-05-04soldstatus $21,500
Show marketing remark (373 chars)
REDUCED!! Motivated Seller!! Brand new complete rehab. Fresh paint, new floors. Excellent opportunity for the 1st time buyer who may be eligible for the Dauphin County 1st time buyer program. Also an opportunity for the investor. Previously rented for $725.00 monthly. This home is in move-in-condition. Motivated seller looking for offers!! Schedule your showing today!
-
2016-04-18historical
Show marketing remark (373 chars)
REDUCED!! Motivated Seller!! Brand new complete rehab. Fresh paint, new floors. Excellent opportunity for the 1st time buyer who may be eligible for the Dauphin County 1st time buyer program. Also an opportunity for the investor. Previously rented for $725.00 monthly. This home is in move-in-condition. Motivated seller looking for offers!! Schedule your showing today!
-
2015-09-11$29,900
Show marketing remark (373 chars)
REDUCED!! Motivated Seller!! Brand new complete rehab. Fresh paint, new floors. Excellent opportunity for the 1st time buyer who may be eligible for the Dauphin County 1st time buyer program. Also an opportunity for the investor. Previously rented for $725.00 monthly. This home is in move-in-condition. Motivated seller looking for offers!! Schedule your showing today!
-
2010-04-26soldstatus $40,000
-
2010-04-13historical
-
2009-09-21$49,900
-
2008-10-14soldstatus $12,500
-
1999-07-27soldstatus $5,704
ⓘ Source: listings_history table (triggers on properties + properties_extension) + one-shot
backfill from property_details.listing_events for pre-trigger history.
Tax reassessment forecast PA · Partial reset (capped growth)
- Current annual tax
- $1,606 · $134/mo
- Projected year-2 tax
- $1,606 · $134/mo
- Expected delta
- $0/yr ($0/mo · 0.0%)
ⓘ Screening estimate from a state-policy table — verify with the county assessor before closing.
Climate risk First Street
- Flood 9/10 Extreme FEMA zone X (unshaded) · 99% chance over 30 yrs
- Wildfire 1/10 Low
- Heat 6/10 Major 7 d/yr ≥101°F today · 15 d/yr by 30 yrs out
- Wind 2/10 Low 4% chance of damaging wind over 30 yrs
- Air quality 2/10 Low 1 unhealthy d/yr today · 3 by 30 yrs out
Nearby sold comps map
Loading sold comps map…
Walkable amenities ~0.75 mi
Loading nearby amenities…
Taxation est. · year 1
- Rental income
- $16,670
- − Mortgage interest
- −$5,546
- − Property taxes
- −$1,606
- − Insurance
- −$1,162
- − Repairs & maintenance
- −$1,334
- − Management
- −$1,334
- − Depreciation
- −$2,880
- Taxable income
- $2,810
- Est. tax owed @ 24.0%
- −$674
- After-tax cash flow
- $3,498/yr
For passive investors: Depreciation is non-cash, so a rental often shows a tax loss while cash-flowing — sheltering income. Rental losses are passive: they offset passive income freely, and up to $25,000/yr can offset ordinary (W-2) income if you actively participate and your MAGI is under $100k (phasing out to $0 by $150k); unused losses carry forward. On sale, claimed depreciation is recaptured at up to 25%, and gains may owe capital-gains tax (a 1031 exchange can defer both). Figures are a year-1 estimate at your 24.0% rate — not tax advice; consult a CPA.
Schools (NCES district)
- District
- Harrisburg City SD
- NCES district ID
- 4211580
- Math proficiency
- 6% ▼ -6.00%
- Reading proficiency
- 13% ▼ -10.00%
- Median HH income
- $33,432
- Composite
- 7.6/100
- National rank
- #9945
- State rank
- #535 of 539 in PA
Livability — Harrisburg
- Score
- 84/100
- State rank
- #107
- US rank
- #826
Category grades
Schools grade is shown separately in the Schools card above.
Census & demographics
- Census place
- Harrisburg, PA
- County
- Dauphin County · 247,857 people
- City population
- 184,296
- Metro
- Harrisburg-Carlisle, PA
- Population (ZIP)
- 8,118
- Household income
- $54,573
- Rent vs Own
- Severe rent burden
- 720.0
Population outlook (Dauphin County) Hauer SSP2
- Today (2025)
- 281,628 people
- By 2030
- 283,549 · +0.7%
- By 2040
- 285,385 · +1.3%
- By 2050
- 286,188 · +1.6%
- By 2075
- 291,053 · +3.3%
- By 2100
- 282,374 · +0.3%
Race, ethnicity, and origin ACS 2023
- Neighborhood character
- Diverse neighborhood (Simpson 0.62)
- Race & ethnicity
- White 54% Black 25% Hispanic / Latino 14% Two or more races 7% Asian 2%
- Hispanic origin (detail)
- Mexican 1% Puerto Rican 8% Dominican 2%
- Common ancestry
- Romanian 5% Italian 2% Lithuanian 2%
- Foreign-born
- 7% · Canada, Vietnam, South Korea
- Languages at home
- 86% English-only · Spanish 9% Arabic 1% Other Asian/Pacific 1%
Political lean MEDSL · Dauphin
- 2024 margin
- Lean D (+5.9) · D 52.4% · R 46.5% · Other 1.1%
- 2008→2024 swing
- -3.1pp toward R · 2008: 9.1pp · 2024: 5.9pp
- All cycles
- 2024: D+5.9 2020: D+8.5 2016: D+2.8 2012: D+6.0 2008: D+9.1
Not yet ingested
- Civics
- —
Market trends
- HPI YoY
- ▼ -18.43%
- Current HPI
- 451.4739
- Rent YoY
- ▲ 4.29%
- Metro
- Harrisburg-Carlisle, PA
- State GDP YoY
- ▲ 1.68%
- F500 in state
- 34
Industry mix (Fortune 500 HQ in PA)
| Industry | F500 HQs | Revenue |
|---|---|---|
| Healthcare | 2 | $309B |
|
||
| Insurance | 2 | $27B |
|
||
| Telecommunications / Media | 1 | $124B |
|
||
| Industrial Distribution | 1 | $22B |
|
||
| Financial Services | 1 | $20B |
|
||
| Chemicals / Materials | 1 | $18B |
|
||
Price history
+1635.6% since first listed15 events — show timeline
- 2026-06-10 Relisted — BRIGHT MLS
- 2026-05-20 Contingent — BRIGHT MLS
- 2026-05-09 Listed $99,000 BRIGHT MLS
- 2026-05-07 Coming Soon $99,000 BRIGHT MLS
- 2019-10-18 Sold (Public Records) $328,000 Public Records
- 2016-08-31 Listing Removed — BRIGHT MLS
- 2016-05-31 Listed $79,900 BRIGHT MLS
- 2016-05-04 Sold (MLS) $21,500 BRIGHT MLS
- 2016-04-18 Listing Removed — BRIGHT MLS
- 2015-09-11 Listed $29,900 BRIGHT MLS
- 2010-04-26 Sold (MLS) $40,000 BRIGHT MLS
- 2010-04-13 Listing Removed — BRIGHT MLS
- 2009-09-21 Listed $49,900 BRIGHT MLS
- 2008-10-14 Sold (Public Records) $12,500 Public Records
- 1999-07-27 Sold (Public Records) $5,704 Public Records
Property tax history
+7.0%/yrLatest (2026): $1,606 · +1.5% YoY. Source: county tax records.
Cash-flow waterfall
monthlySold comps — $/sqft
last 12 mo · ≤1 miLoading sold comps…