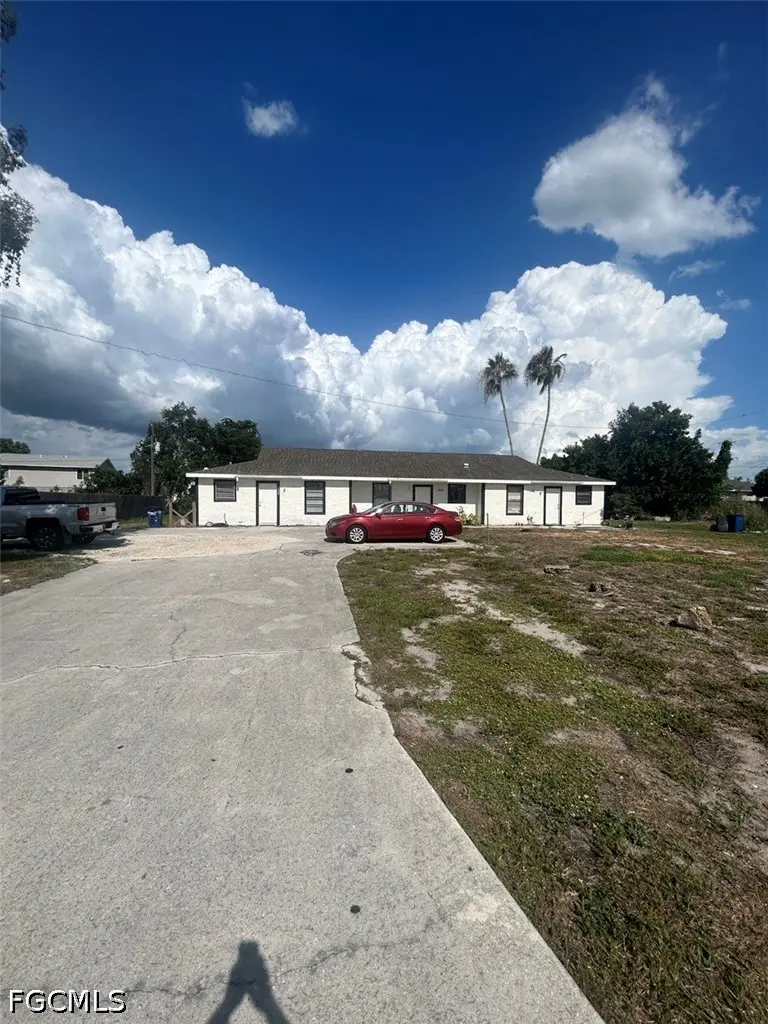
 Triplex
7582-7586 Carrier Rd · San Carlos Park, FL
Flood risk 6/10 · Moderate
- FEMA flood zone
- AE
- Chance of flooding over 30 yrs
- 0.55%
- Est. flood insurance / yr
- $1,737 – $8,500
Fire risk 1/10 · Minimal
- Est. fire insurance / yr
- $947 – $1,759
Heat risk 10/10 · Severe
- Hot days now (above 107°F)
- 7 days/yr
- Hot days in 30 yrs
- 30 days/yr
Wind risk 10/10 · Severe
- Chance of severe wind over 30 yrs
- 99.0%
Air-quality risk 2/10 · Minimal
- Unhealthy air days now
- 1 days/yr
- Unhealthy air days in 30 yrs
- 1 days/yr
Risk factors via First Street. Map © Google.
Why this score? — see what drove the C grade
The composite is a weighted blend of 9 inputs, each scored 0–100. Each bar is that input's sub-score; the figure is the points it added to the 100-point composite (weight × sub-score).
- Cash flow +24.3/30.0
- DSCR +7.9/10.0
- ARV discount +7.5/15.0
- 1% rule +5.9/10.0
- Schools +4.1/10.0
- Livability +3.2/5.0
- Condition / age +2.5/5.0
- Rent growth +1.1/5.0
- Appreciation +0.0/10.0
$499,900
🖨 Deal sheet 📄 Offer letter ✓ Due diligence
Multi-family units
County records classify this as Multi-Family (2-4 Unit). Listing-text estimate: 3 units. confirmed
Listing remarks MLS
SAN CARLOS PARK TRIPLEX - FULLY RENTED.
Key facts
- Large corner lot
- Own lanai
- New wood trim
Tags
Property features AI
Finance
- Other: Tenants pay cable TV, electricity, and internet; Pets are allowed
- Financial info: Gross scheduled income: $39,600; Operating expenses: $6,600; Unit rents (actual/pro forma): $1,000; $1,100; $1,200
- HOA & community: Non-gated community; No association fee
Exterior
- Parking: No parking details provided
- Security: No security details provided
- Utilities: Cable available; Septic tank; Private well
- Home design: Multi-unit property (3 units); Resale property; Zoned RM-2
- Construction: Stucco and wood frame construction; Shingle roof
- Exterior features: No specific exterior amenities listed; Oversized lot; Publicly maintained road access
Interior
- Kitchen: Cooktop/Range and Refrigerator in units; Some units list 'Family' (open living/dining concept implied)
- Bedrooms: Three units total; each unit is a 2-bedroom (units are unfurnished)
- Flooring: No flooring details provided
- Bathrooms: Each unit has 1 full bathroom (3 full bathrooms total)
- Heating & cooling: Central heating (electric); Central air conditioning (electric)
- Interior features: Single hung windows
- Laundry & utility: No laundry details provided
Neighborhood map
What this means for you Summary
Snapshot
- This is a 3 × 2-bed/1-bath units multifamily listed at $500k.
Deal economics
- At list price, monthly cash flow is $583 ($7k/yr) — positive. Per door: $194/mo.
- The deal already cash-flows at list — no discount required.
- Meets the 1% rule at list price ($5k rent vs $500k).
- Recommended offer: $492k (1.5% below list) — sets the bar for market timing.
- Cap rate 8.7% vs local median 2.4% in San Carlos Park — top-decile yield for the area; either an underpriced asset or a hidden risk that comps aren't pricing in. Stress-test before assuming the spread holds.
Location & tenants
- Location reads 65/100 on livability (#662 in FL) — a middle-class / working-renter tenant base. Strengths: housing A+, employment A-, crime B+; Watch: schools F, amenities F, commute F.
- Lee (suburban): math 47% / reading 50% proficiency, ranked #42 of 73 in FL (top 58%) — families likely to look elsewhere, expect single-tenant / working-renter base with shorter leases.
- Market conditions: Rents falling (-5.7%/yr); 226 active listings in the ZIP; 4 comparable units currently listed for rent nearby; rentals at typical pace (median 14d on market — plan ~3-4 weeks tenant-placement turnaround); solid renter incomes; 15,411 units permitted in Lee County in 2024 (4,686 in 5+ unit buildings).
- At $5,464/mo this rent would consume 72% of the median local household income ($91k/yr) (locally 491% of renters already pay >50% of income on rent) — very limited rent-growth headroom before tenants either downsize or default.
Forward outlook
- Local home prices are declining (-3.0%/yr); year-one equity from $3k of loan paydown is wiped out by about $15k of value loss. Plan a longer hold.
- Lee County population projected at +44% by 2050 — long-run rental-demand tailwind backs the buy-and-hold thesis.
Negotiation context
- It's been on market 26 days — a 2% lower offer ($492k) is reasonable based on typical stale-listing flexibility.
- 2 sale attempts since 12y ago with the ask held roughly flat each time — persistent listings suggest the price (not the market) is what's stuck; bring a comps-based counter.
- Current owner paid $113k; list at $500k implies a 342% gain — meaningful room to come down on a strong offer.
Risks & watch-outs
- Watch-outs: flood insurance adds $427/mo.
- Climate carrying-cost: in FEMA flood zone AE (mandatory federal flood insurance); severe wind risk, 99% chance of damaging wind over 30y; extreme-heat days projected 7→30/yr by 2055 (HVAC capex compounding) — expect insurance premiums to compound above CPI over the hold.
Questions for the listing agent
- Can we see the unit-by-unit rent roll, current vacancy, and any below-market leases? What's the average tenancy length?
- What capital expenditures (roof, boiler, parking lot, exteriors) have been made in the last 5 years, and what's planned in the next 2?
- What's the actual annual flood-insurance premium (NFIP or private), and is the property in a SFHA with mandatory coverage?
- Is there a deadline driving the sale (1031 exchange, divorce, estate, relocation)? That informs how much negotiation room exists.
- Schools are F-rated, which usually means shorter tenancies and higher turnover. Who's the typical renter profile here, and what's been the actual vacancy rate?
- What's the average days-on-market for RENTAL listings here right now (not sales)? A rising rental-DOM trend means longer vacancies and softer asking-rent achievability than the comps imply.
- What's the recent tenant-quality profile in this submarket — average credit score on applications, eviction rate, late-payment / NSF rate, and stable-employment percentage? A property-management company in the area should have these aggregated.
- How much new apartment / multifamily construction is in the pipeline within 1–3 miles? Heavy new supply (>2% of stock underway) typically softens rents 12–24 months out; light construction supports rent growth.
Investment metrics
- 1% rule
- 1.09% ✓
- Cap rate
- 8.72%
- Cash-on-cash
- 8.66%
- DSCR
- 1.39
- GRM
- 7.6
CMA / ARV
No comps found within radius.
Projected returns pro-forma
-3.0% appreciation · 0.0% rent growth · sell at horizon
- IRR
- -12.2%
- Equity multiple
- 0.57×
- Total profit
- $-59,631
- Equity at exit
- $74,537
- IRR
- -8.7%
- Equity multiple
- 0.54×
- Total profit
- $-64,962
- Equity at exit
- $43,222
Cash invested: $139,972 (down + closing). Projections, not guarantees.
Landlord ↔ Tenant lean methodology
- Overall (STATE)
- 87 Strongly Landlord-Friendly
- State Florida
- 87 Strongly Landlord-Friendly · R+3
- County
- — inherits STATE
- City
- — inherits STATE
ZIP-level market 33967
- Home prices YoY
- -29.3%
- Rents YoY
- -5.7%
- Active inventory
- 226
- Price-to-rent
- 22.9×
Monthly cashflow live
- Estimated rent
- $5,464 high interval (Pro) →
- Mortgage (P&I)
- −$2,622
- Tax from tax record
- −$477 /mo · $5,726/yr
- Insurance
- −$208
- Flood insurance flood zone
- −$427 /mo · $5,118/yr
- HOA
- −$0
- Vacancy / Maint / Mgmt
- −$1,147
- Net cashflow
- $583
Break-even live
3-unit breakdown (identical units grouped — click to expand)
| Units | Beds | Baths | Est. rent |
|---|---|---|---|
| 3× units | 2 | 1 | $5,463 |
| #1 | 2 | 1 | $1,821 |
| #2 | 2 | 1 | $1,821 |
| #3 | 2 | 1 | $1,821 |
| Total (3 units) | $5,464 | ||
UW: 25.0% down · 7.5% · 30yr · 1.5% tax · 5.0% vac · 8.0% maint · 8.0% mgmt
Financing live
Cash to close
- Down payment
- $124,975
- Closing costs
- $14,997
- Reserves months
- —
- Total cash needed
- —
Loan-product check · same deal, 3 products live
Conventional
25% down · 7.5% · 30yr
- Down + closing
- —
- Monthly P&I
- —
- Monthly cashflow
- —
- DSCR
- —
- Eligible?
- —
Personal DTI + credit; lowest rate.
DSCR
20% down · 8.5% · 30yr
- Down + closing
- —
- Monthly P&I
- —
- Monthly cashflow
- —
- DSCR
- —
- Eligible?
- —
No personal income docs; deal must DSCR.
Hard money
10% down · 12.0% · 12mo
- Down + closing
- —
- Monthly P&I
- —
- Monthly cashflow
- —
- DSCR
- —
- Eligible?
- —
Short-term bridge; refi at stabilization.
Rent comps 4 comps
| Address | Beds | Baths | Sqft | Rent | $/sqft | DOM | Units | Dist |
|---|---|---|---|---|---|---|---|---|
| 7435 Albany Rd Fort Myers, FL | 5.0 | 3.0 | 2147 | $2,700 | $1.26 | 14d | 1 | 0.08mi |
| 7395 Albany Rd Fort Myers, FL | 5.0 | 3.0 | 2360 | $2,500 | $1.06 | 12d | 1 | 0.12mi |
| 17337 Phlox Dr Fort Myers, FL | 4.0 | 2.0 | 2033 | $3,000 | $1.48 | 24d | 1 | 0.40mi |
| 18145 Baruch Dr Fort Myers, FL | 4.0 | 2.0 | 1818 | $2,531 | $1.39 | 3d | 1 | 0.78mi |
Listing history 22 events
-
2026-06-17days on market $499,900 Active 26 DOM
-
2026-06-16days on market $499,900 Active 25 DOM
-
2026-06-15days on market $499,900 Active 24 DOM
-
2026-06-13days on market $499,900 Active 22 DOM
-
2026-06-10days on market $499,900 Active 19 DOM
-
2026-06-09days on market $499,900 Active 18 DOM
-
2026-06-08days on market $499,900 Active 17 DOM
-
2026-06-07days on market $499,900 Active 16 DOM
-
2026-06-03days on market $499,900 Active 12 DOM
-
2026-06-02days on market $499,900 Active 11 DOM
-
2026-06-01days on market $499,900 Active 10 DOM
-
2026-05-31days on market $499,900 Active 9 DOM
-
2026-05-20$499,900 Active
-
2014-05-27soldstatus $113,000
-
2014-05-16price $116,917 39-char remark
Show marketing remark (39 chars)
SAN CARLOS PARK TRIPLEX - FULLY RENTED.
-
2014-05-16soldstatus $113,000 39-char remark
Show marketing remark (39 chars)
SAN CARLOS PARK TRIPLEX - FULLY RENTED.
-
2014-03-18$113,000 39-char remark
Show marketing remark (39 chars)
SAN CARLOS PARK TRIPLEX - FULLY RENTED.
-
2012-09-18soldstatus $104,000
-
2012-09-06soldstatus $108,000 397-char remark
Show marketing remark (397 chars)
Wow, a fantastic chance to own one of the nicest cash flowing buidings in san carlos. $1525.00 per month. tile and lots of upgrades have been put in this building. large parking area and fantastic tenants make this a great purchase. this is a pleasure to show. owner also has other properties ready to sell. this is a rare chance to own a triplex that is 100% occupied and the end units are tiled.
-
2010-07-28soldstatus $45,000
-
2010-07-09price $49,900
-
2000-08-30soldstatus $59,300
ⓘ Source: listings_history table (triggers on properties + properties_extension) + one-shot
backfill from property_details.listing_events for pre-trigger history.
Tax reassessment forecast FL · Resets to sale price
- Current annual tax
- $5,726 · $477/mo
- Projected year-2 tax
- $5,726 · $477/mo
- Expected delta
- $0/yr ($0/mo · 0.0%)
ⓘ Screening estimate from a state-policy table — verify with the county assessor before closing.
Climate risk First Street
- Flood 6/10 Major FEMA zone AE · 55% chance over 30 yrs
- Wildfire 1/10 Low
- Heat 10/10 Extreme 7 d/yr ≥107°F today · 30 d/yr by 30 yrs out
- Wind 10/10 Extreme 99% chance of damaging wind over 30 yrs
- Air quality 2/10 Low 1 unhealthy d/yr today · 1 by 30 yrs out
Nearby sold comps map
Loading sold comps map…
Walkable amenities ~0.75 mi
Loading nearby amenities…
Taxation est. · year 1
- Rental income
- $65,568
- − Mortgage interest
- −$28,002
- − Property taxes
- −$5,726
- − Insurance
- −$7,618
- − Repairs & maintenance
- −$5,245
- − Management
- −$5,245
- − Depreciation
- −$14,543
- Taxable loss
- −$812
- Est. tax savings @ 24.0%
- +$195
- After-tax cash flow
- $7,191/yr
For passive investors: Depreciation is non-cash, so a rental often shows a tax loss while cash-flowing — sheltering income. Rental losses are passive: they offset passive income freely, and up to $25,000/yr can offset ordinary (W-2) income if you actively participate and your MAGI is under $100k (phasing out to $0 by $150k); unused losses carry forward. On sale, claimed depreciation is recaptured at up to 25%, and gains may owe capital-gains tax (a 1031 exchange can defer both). Figures are a year-1 estimate at your 24.0% rate — not tax advice; consult a CPA.
Schools (NCES district)
- District
- Lee
- NCES district ID
- 1201080
- Math proficiency
- 47% ▼ -11.00%
- Reading proficiency
- 50% ▼ -4.00%
- Median HH income
- $49,518
- Composite
- 41.49/100
- National rank
- #3458
- State rank
- #42 of 73 in FL
Livability — San Carlos Park
- Score
- 65/100
- State rank
- #662
- US rank
- #13354
Category grades
Schools grade is shown separately in the Schools card above.
Census & demographics
- Census place
- San Carlos Park, FL
- County
- Lee County · 788,662 people
- City population
- 27,337
- Metro
- Cape Coral-Fort Myers, FL
- Population (ZIP)
- 28,341
- Household income
- $90,519
- Rent vs Own
- Severe rent burden
- 491.0
Population outlook (Lee County) Hauer SSP2
- Today (2025)
- 871,946 people
- By 2030
- 955,468 · +9.6%
- By 2040
- 1,113,587 · +27.7%
- By 2050
- 1,256,891 · +44.1%
- By 2075
- 1,560,270 · +78.9%
- By 2100
- 1,726,848 · +98.0%
Race, ethnicity, and origin ACS 2023
- Neighborhood character
- Predominantly White (67%)
- Race & ethnicity
- White 67% Hispanic / Latino 23% Two or more races 16% Asian 3% Black 3%
- Hispanic origin (detail)
- Mexican 8% Puerto Rican 2% Cuban 4% Dominican 1%
- Common ancestry
- Romanian 3% Lithuanian 2% Slovak 2%
- Foreign-born
- 14% · Canada, Jamaica, Vietnam
- Languages at home
- 79% English-only · Spanish 16% Other Indo-European 1% Vietnamese 1%
Political lean MEDSL · Lee
- 2024 margin
- Strong R (+28.4) · D 35.5% · R 63.9%
- 2008→2024 swing
- -18.0pp toward R · 2008: -10.4pp · 2024: -28.4pp
- All cycles
- 2024: R+28.4 2020: R+19.2 2016: R+20.4 2012: R+16.6 2008: R+10.4
Not yet ingested
- Civics
- —
Market trends
- HPI YoY
- ▼ -123.07%
- Current HPI
- 296.5923
- Rent YoY
- ▼ -5.68%
- Metro
- Cape Coral-Fort Myers, FL
- State GDP YoY
- ▲ 3.28%
- F500 in state
- 36
Industry mix (Fortune 500 HQ in FL)
| Industry | F500 HQs | Revenue |
|---|---|---|
| Industrial Technology | 2 | $29B |
|
||
| Insurance | 2 | $17B |
|
||
| Retail | 1 | $60B |
|
||
| Technology Distribution | 1 | $58B |
|
||
| Homebuilding | 1 | $35B |
|
||
| Technology Manufacturing | 1 | $35B |
|
||
Price history
+743.0% since first listed10 events — show timeline
- 2026-05-20 Listed $499,900 FORTMLS
- 2014-05-27 Sold (Public Records) $113,000 Public Records
- 2014-05-16 Sold (MLS) $113,000 FORTMLS
- 2014-05-16 Price Changed $116,917 FORTMLS
- 2014-03-18 Listed $113,000 FORTMLS
- 2012-09-18 Sold (Public Records) $104,000 Public Records
- 2012-09-06 Sold (MLS) $108,000 FORTMLS
- 2010-07-28 Sold (MLS) $45,000 FORTMLS
- 2010-07-09 Price Changed $49,900 FORTMLS
- 2000-08-30 Sold (Public Records) $59,300 Public Records
Property tax history
+8.9%/yrLatest (2025): $5,726 · +13.0% YoY. Source: county tax records.
Cash-flow waterfall
monthlySold comps — $/sqft
last 12 mo · ≤1 miLoading sold comps…