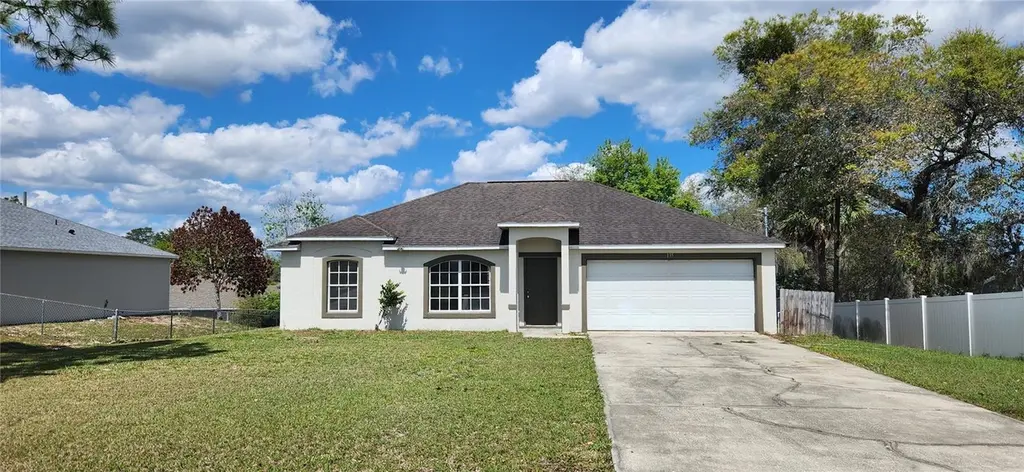
135 Larchmont Dr · Deltona, FL
Flood risk 1/10 · Minimal
- FEMA flood zone
- X (unshaded)
- Chance of flooding over 30 yrs
- 0.0%
- Est. flood insurance / yr
- $507 – $1,088
Fire risk 6/10 · Moderate
- Est. fire insurance / yr
- $947 – $1,759
Heat risk 9/10 · Severe
- Hot days now (above 106°F)
- 7 days/yr
- Hot days in 30 yrs
- 21 days/yr
Wind risk 9/10 · Severe
- Chance of severe wind over 30 yrs
- 99.0%
Air-quality risk 2/10 · Minimal
- Unhealthy air days now
- 1 days/yr
- Unhealthy air days in 30 yrs
- 1 days/yr
Risk factors via First Street. Map © Google.
Why this score? — see what drove the D- grade
The composite is a weighted blend of 9 inputs, each scored 0–100. Each bar is that input's sub-score; the figure is the points it added to the 100-point composite (weight × sub-score).
- Cash flow +11.6/30.0
- ARV discount +7.5/15.0
- Schools +3.9/10.0
- Livability +3.6/5.0
- DSCR +3.4/10.0
- 1% rule +3.3/10.0
- Rent growth +3.0/5.0
- Condition / age +2.5/5.0
- Appreciation +0.0/10.0
$287,000
🖨 Deal sheet (PDF) 📄 Offer letter ✓ Due diligence
Listing remarks MLS
Fresh Paint and New Kitchen with Quartz Counter tops, New wood looking tiles in kitchen and living room. Ready for new owner to move in. Priced to sell!
Key facts
- New kitchen
- Fresh paint
- Quartz counter tops
Tags
Neighborhood map
What this means for you Summary
Snapshot
- This is a 4-bed/2.0-bath single-family listed at $287k.
Deal economics
- At list price, monthly cash flow is $-91 ($-1k/yr) — negative.
- To cash-flow at today's rent, offer at most $271k (5.6% below list).
- To meet the 1% rule (rent ≥ 1% of price), the offer needs to be $239k (16.8% below list).
- Recommended offer: $239k (16.8% below list) — sets the bar for 1% rule.
Location & tenants
- Location reads 71/100 on livability (#381 in FL) — a middle-class / working-renter tenant base. Strengths: cost of living A+, housing A+, health & safety A+; Watch: amenities F, commute F.
- Volusia (suburban): math 44% / reading 49% proficiency, ranked #47 of 73 in FL (top 64%) — families likely to look elsewhere, expect single-tenant / working-renter base with shorter leases.
- Zoned schools: Osteen Elementary School (math 54% / reading 56%, grade C, #872 of 2,144 statewide, top 42%, 469 students, 60% FRL); Heritage Middle School (math 38% / reading 41%, grade F, #373 of 571 statewide, top 66%, 993 students, 61% FRL); Pine Ridge High School (math 19% / reading 38%, grade F, #458 of 667 statewide, top 69%, 1,636 students, 54% FRL).
- Market conditions: Rents rising (+2.1%/yr); 389 active listings in the ZIP; 3 comparable units currently listed for rent nearby; rentals leasing fast (median 7d on market — plan ~1-2 weeks tenant-placement turnaround); solid renter incomes; 3,402 units permitted in Volusia County in 2024 (681 in 5+ unit buildings).
- This rent runs 36% of the median local income ($80k/yr) — at the standard rent-burdened threshold; future hikes will face affordability resistance.
Forward outlook
- Local home prices are declining (-3.0%/yr); year-one equity from $2k of loan paydown is wiped out by about $9k of value loss. Plan a longer hold.
- Volusia County population projected at +19% by 2050 — long-run rental-demand tailwind backs the buy-and-hold thesis.
Negotiation context
- It's been on market 74 days — a 6% lower offer ($270k) is reasonable based on typical stale-listing flexibility.
Risks & watch-outs
- Climate carrying-cost: severe wind risk, 99% chance of damaging wind over 30y; major wildfire risk; extreme-heat days projected 7→21/yr by 2055 (HVAC capex compounding) — expect insurance premiums to compound above CPI over the hold.
Questions for the listing agent
- What do current leases actually rent for vs. the listed asking? Can we see a recent rent roll and the last 12 months of T-12 income?
- It's been on market 74 days. Have you received any prior offers? Is the seller open to a 17% concession, seller financing, or rate buy-down credit?
- Why hasn't it sold? Are there any deal-killer items the seller is aware of (foundation, flood, title, zoning, code violations)?
- Is there a deadline driving the sale (1031 exchange, divorce, estate, relocation)? That informs how much negotiation room exists.
- Schools are D-rated, which usually means shorter tenancies and higher turnover. Who's the typical renter profile here, and what's been the actual vacancy rate?
- The area grade is low — what's the realistic commute time and amenity access for the typical tenant pool here? Any planned neighborhood developments (good or bad) we should know about?
- What's the average days-on-market for RENTAL listings here right now (not sales)? A rising rental-DOM trend means longer vacancies and softer asking-rent achievability than the comps imply.
- What's the recent tenant-quality profile in this submarket — average credit score on applications, eviction rate, late-payment / NSF rate, and stable-employment percentage? A property-management company in the area should have these aggregated.
- How much new for-sale + rental construction is in the pipeline within 1–3 miles? Heavy new supply typically softens prices + rents 12–24 months out; constrained supply supports both.
Investment metrics
- 1% rule
- 0.83% ✗
- Cap rate
- 5.91%
- Cash-on-cash
- -1.36%
- DSCR
- 0.94
- GRM
- 10.0
CMA / ARV
No comps found within radius.
Projected returns pro-forma
-3.0% appreciation · 2.1% rent growth · sell at horizon
- IRR
- -19.5%
- Equity multiple
- 0.32×
- Total profit
- $-54,415
- Equity at exit
- $42,793
- IRR
- -14.3%
- Equity multiple
- 0.21×
- Total profit
- $-63,354
- Equity at exit
- $24,815
Cash invested: $80,360 (down + closing). Projections, not guarantees.
Landlord ↔ Tenant lean methodology
- Overall (STATE)
- 87 Strongly Landlord-Friendly
- State Florida
- 87 Strongly Landlord-Friendly · R+3
- County
- — inherits STATE
- City
- — inherits STATE
ZIP-level market 32738
- Home prices YoY
- -31.8%
- Rents YoY
- 2.1%
- Active inventory
- 389
- Price-to-rent
- 10.0×
Monthly cashflow live
- Estimated rent
- $2,387 medium interval (Pro) →
- Mortgage (P&I)
- −$1,505
- Tax from tax record
- −$352 /mo · $4,229/yr
- Insurance
- −$120
- HOA
- −$0
- Vacancy / Maint / Mgmt
- −$501
- Net cashflow
- $-91
Break-even live
Sensitivity live
| Price | -10% $71 | -5% $-10 | +0% $-91 | +5% $-172 | +10% $-254 |
|---|---|---|---|---|---|
| Rent | -10% $-280 | -5% $-185 | +0% $-91 | +5% $3 | +10% $98 |
| Rate | -1.0pp $53 | -0.5pp $-18 | base $-91 | +0.5pp $-165 | +1.0pp $-241 |
UW: 25.0% down · 7.5% · 30yr · 1.5% tax · 5.0% vac · 8.0% maint · 8.0% mgmt
Financing live
Cash to close
- Down payment
- $71,750
- Closing costs
- $8,610
- Reserves months
- —
- Total cash needed
- —
Loan-product check · same deal, 3 products live
Conventional
25% down · 7.5% · 30yr
- Down + closing
- —
- Monthly P&I
- —
- Monthly cashflow
- —
- DSCR
- —
- Eligible?
- —
Personal DTI + credit; lowest rate.
DSCR
20% down · 8.5% · 30yr
- Down + closing
- —
- Monthly P&I
- —
- Monthly cashflow
- —
- DSCR
- —
- Eligible?
- —
No personal income docs; deal must DSCR.
Hard money
10% down · 12.0% · 12mo
- Down + closing
- —
- Monthly P&I
- —
- Monthly cashflow
- —
- DSCR
- —
- Eligible?
- —
Short-term bridge; refi at stabilization.
Rent comps 3 comps
| Address | Beds | Baths | Sqft | Rent | $/sqft | DOM | Units | Dist |
|---|---|---|---|---|---|---|---|---|
| 3031 Staten Dr Deltona, FL | 3.0 | 2.0 | 1706 | $2,299 | $1.35 | 6d | 1 | 0.97mi |
| 3031 Staten Dr Deltona, FL | 3.0 | 2.0 | 1706 | $2,299 | $1.35 | 0d | 1 | 0.97mi |
| 495 Fort Smith Blvd Deltona, FL | 3.0 | 2.0 | 1134 | $1,800 | $1.59 | 25d | 1 | 1.01mi |
Listing history 12 events
-
2026-06-09remarks 192-char remark
-
2026-06-09status $287,000 Pending 74 DOM
-
2026-06-08days on market $287,000 Active 74 DOM
-
2026-06-07days on market $287,000 Active 73 DOM
-
2026-06-05days on market $287,000 Active 70 DOM
-
2026-06-03days on market $287,000 Active 69 DOM
-
2026-06-03days on market $287,000 Active 68 DOM
-
2026-06-01days on market $287,000 Active 67 DOM
-
2026-05-31days on market $287,000 Active 66 DOM
-
2026-05-31days on market $287,000 Active 65 DOM
-
2026-05-09price $287,000 152-char remark
Show marketing remark (152 chars)
Fresh Paint and New Kitchen with Quartz Counter tops, New wood looking tiles in kitchen and living room. Ready for new owner to move in. Priced to sell!
-
2026-03-26$295,000 Active 152-char remark
Show marketing remark (152 chars)
Fresh Paint and New Kitchen with Quartz Counter tops, New wood looking tiles in kitchen and living room. Ready for new owner to move in. Priced to sell!
ⓘ Source: listings_history table (triggers on properties + properties_extension) + one-shot
backfill from property_details.listing_events for pre-trigger history.
Tax reassessment forecast FL · Resets to sale price
- Current annual tax
- $4,229 · $352/mo
- Projected year-2 tax
- $4,229 · $352/mo
- Expected delta
- $0/yr ($0/mo · 0.0%)
ⓘ Screening estimate from a state-policy table — verify with the county assessor before closing.
Climate risk First Street
- Flood 1/10 Low FEMA zone X (unshaded) · 0% chance over 30 yrs
- Wildfire 6/10 Major
- Heat 9/10 Extreme 7 d/yr ≥106°F today · 21 d/yr by 30 yrs out
- Wind 9/10 Extreme 99% chance of damaging wind over 30 yrs
- Air quality 2/10 Low 1 unhealthy d/yr today · 1 by 30 yrs out
Nearby sold comps map
Loading sold comps map…
Walkable amenities ~0.75 mi
Loading nearby amenities…
Taxation est. · year 1
- Rental income
- $28,649
- − Mortgage interest
- −$16,076
- − Property taxes
- −$4,229
- − Insurance
- −$1,435
- − Repairs & maintenance
- −$2,292
- − Management
- −$2,292
- − Depreciation
- −$8,349
- Taxable loss
- −$6,025
- Est. tax savings @ 24.0%
- +$1,446
- After-tax cash flow
- $353/yr
For passive investors: Depreciation is non-cash, so a rental often shows a tax loss while cash-flowing — sheltering income. Rental losses are passive: they offset passive income freely, and up to $25,000/yr can offset ordinary (W-2) income if you actively participate and your MAGI is under $100k (phasing out to $0 by $150k); unused losses carry forward. On sale, claimed depreciation is recaptured at up to 25%, and gains may owe capital-gains tax (a 1031 exchange can defer both). Figures are a year-1 estimate at your 24.0% rate — not tax advice; consult a CPA.
Schools (NCES district)
- District
- Volusia
- NCES district ID
- 1201920
- Math proficiency
- 44% ▼ -9.00%
- Reading proficiency
- 49% ▼ -3.00%
- Median HH income
- $42,946
- Composite
- 39.2/100
- National rank
- #4019
- State rank
- #47 of 73 in FL
Livability — Deltona
- Score
- 71/100
- State rank
- #381
- US rank
- #6749
Category grades
Schools grade is shown separately in the Schools card above.
Census & demographics
- Census place
- Deltona, FL
- County
- Volusia County · 556,871 people
- City population
- 101,355
- Metro
- Deltona-Daytona Beach-Ormond Beach, FL
- Population (ZIP)
- 49,368
- Household income
- $80,224
- Rent vs Own
- Severe rent burden
- 636.0
Population outlook (Volusia County) Hauer SSP2
- Today (2025)
- 572,749 people
- By 2030
- 598,695 · +4.5%
- By 2040
- 644,880 · +12.6%
- By 2050
- 681,451 · +19.0%
- By 2075
- 759,957 · +32.7%
- By 2100
- 778,902 · +36.0%
Race, ethnicity, and origin ACS 2023
- Neighborhood character
- Diverse neighborhood (Simpson 0.63)
- Race & ethnicity
- White 46% Hispanic / Latino 37% Black 13% Two or more races 12%
- Hispanic origin (detail)
- Puerto Rican 23% Cuban 3% Dominican 3%
- Common ancestry
- Romanian 2% Italian 2% Slovak 1%
- Foreign-born
- 11% · Canada, Jamaica
- Languages at home
- 72% English-only · Spanish 26%
Political lean MEDSL · Volusia
- 2024 margin
- Strong R (+21.8) · D 38.7% · R 60.5%
- 2008→2024 swing
- -27.4pp toward R · 2008: 5.7pp · 2024: -21.8pp
- All cycles
- 2024: R+21.8 2020: R+14.1 2016: R+13.1 2012: R+1.2 2008: D+5.7
Not yet ingested
- Civics
- —
Market trends
- HPI YoY
- ▼ -154.91%
- Current HPI
- 331.8842
- Rent YoY
- ▲ 2.10%
- Metro
- Deltona-Daytona Beach-Ormond Beach, FL
- State GDP YoY
- ▲ 3.28%
- F500 in state
- 36
Industry mix (Fortune 500 HQ in FL)
| Industry | F500 HQs | Revenue |
|---|---|---|
| Industrial Technology | 2 | $29B |
|
||
| Insurance | 2 | $17B |
|
||
| Retail | 1 | $60B |
|
||
| Technology Distribution | 1 | $58B |
|
||
| Homebuilding | 1 | $35B |
|
||
| Technology Manufacturing | 1 | $35B |
|
||
Price history
-2.7% since first listed2 events — show timeline
- 2026-05-09 Price Changed $287,000 Stellar MLS as Distributed by MLS Grid
- 2026-03-26 Listed $295,000 Stellar MLS as Distributed by MLS Grid
Property tax history
+7.5%/yrLatest (2025): $4,229 · +6.2% YoY. Source: county tax records.
Cash-flow waterfall
monthlySold comps — $/sqft
last 12 mo · ≤1 miLoading sold comps…