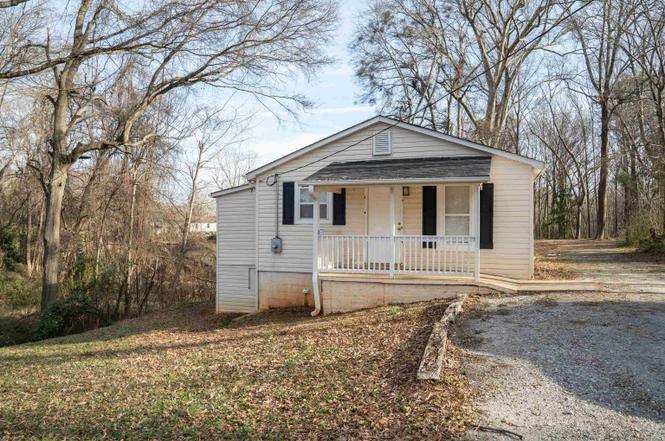
171 Brown St · Cowpens, SC
Flood risk 1/10 · Minimal
- FEMA flood zone
- X (unshaded)
- Chance of flooding over 30 yrs
- 0.0%
- Est. flood insurance / yr
- $507 – $1,088
Fire risk 4/10 · Minor
- Est. fire insurance / yr
- $783 – $1,453
Heat risk 5/10 · Moderate
- Hot days now (above 105°F)
- 7 days/yr
- Hot days in 30 yrs
- 15 days/yr
Wind risk 2/10 · Minimal
- Chance of severe wind over 30 yrs
- 3.0%
Air-quality risk 4/10 · Minor
- Unhealthy air days now
- 4 days/yr
- Unhealthy air days in 30 yrs
- 4 days/yr
Risk factors via First Street. Map © Google.
Why this score? — see what drove the D+ grade
The composite is a weighted blend of 9 inputs, each scored 0–100. Each bar is that input's sub-score; the figure is the points it added to the 100-point composite (weight × sub-score).
- Cash flow +19.1/30.0
- DSCR +6.0/10.0
- ARV discount +5.8/15.0
- 1% rule +4.6/10.0
- Schools +3.7/10.0
- Livability +3.1/5.0
- Rent growth +2.5/5.0
- Condition / age +2.5/5.0
- Appreciation +0.0/10.0
$158,500
🖨 Deal sheet 📄 Offer letter ✓ Due diligence
Listing remarks
BACK ON THE MARKET AT NO FAULT OF THE SELLERS, BUYERS FINANCING FELL THROUGH * * * MOTIVATED SELLERS * * * Welcome to 171 Brown Street, a beautifully updated 2-bedroom, 2-bathroom bungalow. Nestled on approximately an acre of land, this cozy 920-square-foot home offers ample outdoor space for gardening, entertaining, or simply unwinding. The renovated kitchen and stylish bathrooms add modern comfort, while the master bath features a walk-in closet and double vanity sink. Enjoy the inviting front porch, a small back balcony, and the expansive backyard perfect for outdoor activities. All appliances are included, and there’s no HOA, giving you more freedom. Plus, benefit from city-
Key facts
- Updated bungalow
- Acre of land
- Inviting front porch
Tags
Property features AI
Finance
- Financial info: Annual tax listed
Exterior
- Parking: Driveway
- Security: Smoke detectors
- Utilities: Public water; Public sewer
- Home design: Single-family residence; One level
- Construction: Vinyl siding
- Exterior features: Porch; Barbecue / Outdoor grill; Wooded lot
Interior
- Kitchen: Dishwasher; Refrigerator; Cooktop; Electric cooktop; Electric oven; Microwave
- Bedrooms: 2 main-level bedrooms
- Flooring: Carpet; Laminate
- Bathrooms: 2 full bathrooms (both on the main level)
- Heating & cooling: Central air; Ceiling fans; Electric heating; Forced air
- Interior features: Walk-in closets; Ceiling fans; Pantry
- Laundry & utility: Washer; Dryer; Laundry on main level; Electric water heater
Neighborhood map
What this means for you Summary
Snapshot
- This is a 2-bed/1.0-bath single-family listed at $158k.
Deal economics
- At list price, monthly cash flow is $168 ($2k/yr) — positive.
- The deal already cash-flows at list — no discount required.
- To meet the 1% rule (rent ≥ 1% of price), the offer needs to be $153k (3.7% below list).
- Recommended offer: $144k (9.0% below list) — sets the bar for market timing.
- Cap rate 7.6% vs local median 3.7% in Cowpens — top-decile yield for the area; either an underpriced asset or a hidden risk that comps aren't pricing in. Stress-test before assuming the spread holds.
Location & tenants
- Location reads 61/100 on livability (#213 in SC) — a middle-class / working-renter tenant base. Strengths: cost of living A+, housing B+; Watch: amenities F, commute F, employment F.
- Spartanburg 03 (suburban): math 39% / reading 49% proficiency, ranked #28 of 80 in SC (top 35%) — families likely to look elsewhere, expect single-tenant / working-renter base with shorter leases.
- Zoned schools: Cowpens Elementary (math 57% / reading 52%, grade C, #123 of 597 statewide, top 22%, 461 students, 100% FRL); Clifdale Middle (695 students, 78% FRL); Broome High (math 42% / reading 80%, grade C+, #105 of 196 statewide, top 54%, 825 students, 68% FRL) — zoned schools average 82% FRL vs 57% district-wide (25 pts higher); higher-poverty schools than district average — tighter screening recommended.
- Zoned-school proficiency averages 58% at this address vs 44% district-wide (+14 pts) — the actual schools serving this property are materially stronger than the Spartanburg 03 average implies; a family-tenant draw the district grade alone would hide.
- Market conditions: 69 active listings in the ZIP; 2 comparable units currently listed for rent nearby; 3,129 units permitted in Spartanburg County in 2024 (40 in 5+ unit buildings).
Forward outlook
- Local home prices are declining (-3.0%/yr); year-one equity from $1k of loan paydown is wiped out by about $5k of value loss. Plan a longer hold.
- Spartanburg County population projected at +18% by 2050 — long-run rental-demand tailwind backs the buy-and-hold thesis.
Negotiation context
- It's been on market 117 days — a 9% lower offer ($144k) is reasonable based on typical stale-listing flexibility.
- 3 sale attempts with the ask held roughly flat each time — persistent listings suggest the price (not the market) is what's stuck; bring a comps-based counter.
Risks & watch-outs
- Climate carrying-cost: extreme-heat days projected 7→15/yr by 2055 (HVAC capex compounding) — expect insurance premiums to compound above CPI over the hold.
Questions for the listing agent
- It's been on market 117 days. Have you received any prior offers? Is the seller open to a 9% concession, seller financing, or rate buy-down credit?
- Built in 1979 — when were the roof, HVAC, electrical panel, plumbing, and water heater last replaced?
- Why hasn't it sold? Are there any deal-killer items the seller is aware of (foundation, flood, title, zoning, code violations)?
- Is there a deadline driving the sale (1031 exchange, divorce, estate, relocation)? That informs how much negotiation room exists.
- Schools are F-rated, which usually means shorter tenancies and higher turnover. Who's the typical renter profile here, and what's been the actual vacancy rate?
- The area grade is low — what's the realistic commute time and amenity access for the typical tenant pool here? Any planned neighborhood developments (good or bad) we should know about?
- What's the average days-on-market for RENTAL listings here right now (not sales)? A rising rental-DOM trend means longer vacancies and softer asking-rent achievability than the comps imply.
- What's the recent tenant-quality profile in this submarket — average credit score on applications, eviction rate, late-payment / NSF rate, and stable-employment percentage? A property-management company in the area should have these aggregated.
- How much new for-sale + rental construction is in the pipeline within 1–3 miles? Heavy new supply typically softens prices + rents 12–24 months out; constrained supply supports both.
Investment metrics
- 1% rule
- 0.96% ✗
- Cap rate
- 7.57%
- Cash-on-cash
- 4.55%
- DSCR
- 1.20
- GRM
- 8.7
CMA / ARV
- ARV (on-the-fly)
- $152,640
- Comps found
- 12
Show comp detail 12 sales within ~0.75 mi
| Address | Dist | Beds/Ba | Sqft | Sold | Price | $/sf | Match |
|---|---|---|---|---|---|---|---|
| 125 S Linda St | 0.20mi | 2/1.0 | 1,020 (+6%) | 3mo | $162,500 | $159 | 78 |
| 132 S Linda St | 0.17mi | 2/1.0 | 896 (-7%) | 10mo | $165,000 | $184 | 73 |
| 126 Washington Rd | 0.34mi | 2/1.0 | 1,004 (+5%) | 6mo | $142,000 | $141 | 72 |
| 143 Greenway Dr | 0.42mi | 2/1.0 | 980 (+2%) | 14mo | $219,000 | $223 | 65 |
| 152 Washington Rd | 0.47mi | 2/1.0 | 1,035 (+8%) | 0mo | $168,000 | $162 | 65 |
| 107 Marion St | 0.27mi | 2/1.5 | 1,060 (+10%) | 4mo | $160,000 | $151 | 65 |
| 4963 S Main St | 0.64mi | 2/1.0 | 1,008 (+5%) | 6mo | $125,000 | $124 | 57 |
| 133 Washington Rd | 0.39mi | 2/1.0 | 864 (-10%) | 13mo | $47,500 | $55 | 54 |
| 197 Washington Rd | 0.66mi | 2/1.0 | 939 (-2%) | 16mo | $100,000 | $106 | 53 |
| 123 Washington Rd | 0.34mi | 2/2.0 | 1,100 (+15%) | 9mo | $132,000 | $120 | 49 |
| 108 Catawba St | 0.36mi | 2/2.0 | 1,099 (+14%) | 15mo | $192,000 | $175 | 42 |
| 185 Washington Rd | 0.64mi | 3/2.0 (+1) | 1,080 (+12%) | 12mo | $206,500 | $191 | 30 |
Match score weights: distance 35% · size 25% · config 20% · recency 20%. Top-matched comps best support the ARV.
Projected returns pro-forma
-3.0% appreciation · 3.0% rent growth · sell at horizon
- IRR
- -9.2%
- Equity multiple
- 0.66×
- Total profit
- $-14,990
- Equity at exit
- $23,633
- IRR
- 0.2%
- Equity multiple
- 1.02×
- Total profit
- $683
- Equity at exit
- $13,704
Cash invested: $44,380 (down + closing). Projections, not guarantees.
Landlord ↔ Tenant lean methodology
- Overall (STATE)
- 90 Strongly Landlord-Friendly
- State South Carolina
- 90 Strongly Landlord-Friendly · R+6
- County
- — inherits STATE
- City
- — inherits STATE
ZIP-level market 29330
- Home prices YoY
- -9.2%
- Active inventory
- 69
- Price-to-rent
- 8.7×
Monthly cashflow live
- Estimated rent
- $1,526 medium interval (Pro) →
- Mortgage (P&I)
- −$831
- Tax from tax record
- −$141 /mo · $1,687/yr
- Insurance
- −$66
- HOA
- −$0
- Vacancy / Maint / Mgmt
- −$321
- Net cashflow
- $168
Break-even live
UW: 25.0% down · 7.5% · 30yr · 1.5% tax · 5.0% vac · 8.0% maint · 8.0% mgmt
Financing live
Cash to close
- Down payment
- $39,625
- Closing costs
- $4,755
- Reserves months
- —
- Total cash needed
- —
Loan-product check · same deal, 3 products live
Conventional
25% down · 7.5% · 30yr
- Down + closing
- —
- Monthly P&I
- —
- Monthly cashflow
- —
- DSCR
- —
- Eligible?
- —
Personal DTI + credit; lowest rate.
DSCR
20% down · 8.5% · 30yr
- Down + closing
- —
- Monthly P&I
- —
- Monthly cashflow
- —
- DSCR
- —
- Eligible?
- —
No personal income docs; deal must DSCR.
Hard money
10% down · 12.0% · 12mo
- Down + closing
- —
- Monthly P&I
- —
- Monthly cashflow
- —
- DSCR
- —
- Eligible?
- —
Short-term bridge; refi at stabilization.
Rent comps 2 comps
| Address | Beds | Baths | Sqft | Rent | $/sqft | DOM | Units | Dist |
|---|---|---|---|---|---|---|---|---|
| 5365 N Main St Apt 202 Cowpens, SC | 2.0 | 2.0 | 810 | $1,540 | $1.90 | 21d | 1 | 0.42mi |
| 115 Anile St Unit B Cowpens, SC | 2.0 | 2.0 | 1050 | $1,495 | $1.42 | 13d | 1 | 1.06mi |
Listing history 21 events
-
2026-06-18days on market $158,500 Active 117 DOM
-
2026-06-17days on market $158,500 Active 116 DOM
-
2026-06-16days on market $158,500 Active 115 DOM
-
2026-06-15days on market $158,500 Active 114 DOM
-
2026-06-14days on market $158,500 Active 112 DOM
-
2026-06-13status $158,500 Active 111 DOM
-
2026-05-22status Pending
-
2026-05-13status Active
-
2026-05-03status Pending
-
2026-04-28price $158,500
-
2026-03-05price $160,000
-
2026-01-21$165,000 Active
-
2025-11-01price $160,000
-
2025-10-04price $165,000
-
2025-09-02price $167,500
-
2025-08-18price $170,000
-
2025-08-02price $172,500
-
2025-07-03price $175,000
-
2025-06-05$185,000 Active
-
2022-07-22soldstatus $160,000
-
2021-11-24soldstatus $579,333
ⓘ Source: listings_history table (triggers on properties + properties_extension) + one-shot
backfill from property_details.listing_events for pre-trigger history.
Tax reassessment forecast SC · Resets to sale price
- Current annual tax
- $1,687 · $141/mo
- Projected year-2 tax
- $1,687 · $141/mo
- Expected delta
- $0/yr ($0/mo · 0.0%)
ⓘ Screening estimate from a state-policy table — verify with the county assessor before closing.
Climate risk First Street
- Flood 1/10 Low FEMA zone X (unshaded) · 0% chance over 30 yrs
- Wildfire 4/10 Moderate
- Heat 5/10 Major 7 d/yr ≥105°F today · 15 d/yr by 30 yrs out
- Wind 2/10 Low 3% chance of damaging wind over 30 yrs
- Air quality 4/10 Moderate 4 unhealthy d/yr today · 4 by 30 yrs out
Nearby sold comps map
Loading sold comps map…
Walkable amenities ~0.75 mi
Loading nearby amenities…
Taxation est. · year 1
- Rental income
- $18,318
- − Mortgage interest
- −$8,878
- − Property taxes
- −$1,687
- − Insurance
- −$792
- − Repairs & maintenance
- −$1,465
- − Management
- −$1,465
- − Depreciation
- −$4,611
- Taxable loss
- −$582
- Est. tax savings @ 24.0%
- +$140
- After-tax cash flow
- $2,157/yr
For passive investors: Depreciation is non-cash, so a rental often shows a tax loss while cash-flowing — sheltering income. Rental losses are passive: they offset passive income freely, and up to $25,000/yr can offset ordinary (W-2) income if you actively participate and your MAGI is under $100k (phasing out to $0 by $150k); unused losses carry forward. On sale, claimed depreciation is recaptured at up to 25%, and gains may owe capital-gains tax (a 1031 exchange can defer both). Figures are a year-1 estimate at your 24.0% rate — not tax advice; consult a CPA.
Schools (NCES district)
- District
- Spartanburg 03
- NCES district ID
- 4503540
- Math proficiency
- 39% ▼ -5.00%
- Reading proficiency
- 49% ▲ 6.00%
- Median HH income
- $36,898
- Composite
- 36.52/100
- National rank
- #4645
- State rank
- #28 of 80 in SC
Livability — Cowpens
- Score
- 61/100
- State rank
- #213
- US rank
- #17912
Category grades
Schools grade is shown separately in the Schools card above.
Census & demographics
- Census place
- Cowpens, SC
- Population (ZIP)
- 8,720
Population outlook (Spartanburg County) Hauer SSP2
- Today (2025)
- 325,495 people
- By 2030
- 338,800 · +4.1%
- By 2040
- 363,471 · +11.7%
- By 2050
- 384,156 · +18.0%
- By 2075
- 430,137 · +32.1%
- By 2100
- 442,733 · +36.0%
Race, ethnicity, and origin ACS 2023
- Neighborhood character
- Predominantly White (81%)
- Race & ethnicity
- White 81% Hispanic / Latino 7% Two or more races 7% Black 6%
- Hispanic origin (detail)
- Mexican 2% Puerto Rican 2%
- Common ancestry
- Italian 2% Serbian 1%
- Foreign-born
- 4% · Canada, South Korea, Jamaica
- Languages at home
- 91% English-only · Spanish 6% Chinese 1% Other Asian/Pacific 1%
Political lean MEDSL · Spartanburg
- 2024 margin
- Solid R (+33.6) · D 32.6% · R 66.2% · Other 1.2%
- 2008→2024 swing
- -12.0pp toward R · 2008: -21.6pp · 2024: -33.6pp
- All cycles
- 2024: R+33.6 2020: R+27.3 2016: R+30.0 2012: R+23.1 2008: R+21.6
Not yet ingested
- Civics
- —
Market trends
- HPI YoY
- ▼ -26.81%
- Current HPI
- 263.1439
- Rent YoY
- —
- Metro
- —
- State GDP YoY
- ▲ 4.51%
- F500 in state
- 2
Industry mix (Fortune 500 HQ in SC)
| Industry | F500 HQs | Revenue |
|---|---|---|
| Packaging | 1 | $7B |
|
||
Price history
-72.6% since first listed15 events — show timeline
- 2026-05-22 Pending — SPMLS
- 2026-05-13 Relisted — SPMLS
- 2026-05-03 Pending — SPMLS
- 2026-04-28 Price Changed $158,500 SPMLS
- 2026-03-05 Price Changed $160,000 SPMLS
- 2026-01-21 Listed $165,000 SPMLS
- 2025-11-01 Price Changed $160,000 SPMLS
- 2025-10-04 Price Changed $165,000 SPMLS
- 2025-09-02 Price Changed $167,500 SPMLS
- 2025-08-18 Price Changed $170,000 SPMLS
- 2025-08-02 Price Changed $172,500 SPMLS
- 2025-07-03 Price Changed $175,000 SPMLS
- 2025-06-05 Listed $185,000 SPMLS
- 2022-07-22 Sold (Public Records) $160,000 Public Records
- 2021-11-24 Sold (Public Records) $579,333 Public Records
Property tax history
+12.0%/yrLatest (2025): $1,687 · +0.6% YoY. Source: county tax records.
Cash-flow waterfall
monthlySold comps — $/sqft
last 12 mo · ≤1 miLoading sold comps…