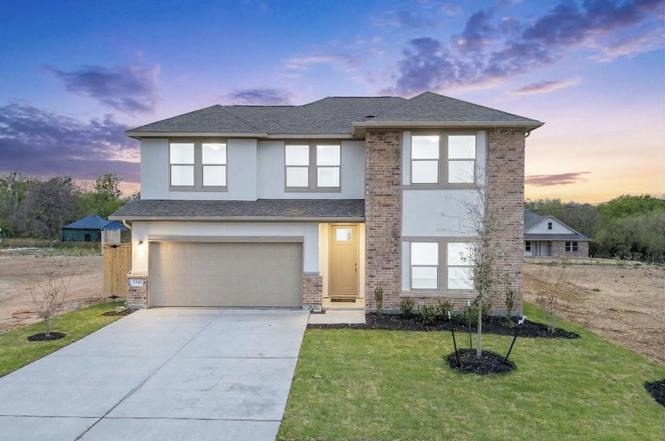
25517 Ashton Look Dr · Elgin, TX
Flood risk 1/10 · Minimal
- FEMA flood zone
- X (unshaded)
- Chance of flooding over 30 yrs
- 0.0%
- Est. flood insurance / yr
- $507 – $1,088
Fire risk 3/10 · Minor
- Est. fire insurance / yr
- $1,222 – $2,270
Heat risk 8/10 · Major
- Hot days now (above 109°F)
- 7 days/yr
- Hot days in 30 yrs
- 22 days/yr
Wind risk 8/10 · Major
- Chance of severe wind over 30 yrs
- 80.0%
Air-quality risk 1/10 · Minimal
- Unhealthy air days now
- 0 days/yr
- Unhealthy air days in 30 yrs
- 0 days/yr
Risk factors via First Street. Map © Google.
Why this score? — see what drove the D- grade
The composite is a weighted blend of 9 inputs, each scored 0–100. Each bar is that input's sub-score; the figure is the points it added to the 100-point composite (weight × sub-score).
- Appreciation +10.0/10.0
- ARV discount +9.1/15.0
- Cash flow +6.3/30.0
- Livability +3.7/5.0
- Rent growth +3.3/5.0
- Condition / age +2.5/5.0
- Schools +2.0/10.0
- 1% rule +1.9/10.0
- DSCR +0.6/10.0
$342,000
🖨 Deal sheet (PDF) 📄 Offer letter ✓ Due diligence
Listing remarks
New Dream Finders Home! The Howard floorplan is a thoughtfully designed 2-story home that offers comfort, functionality, and a sense of privacy rarely found in today’s market. Featuring an open-concept layout, the kitchen, dining, and living areas flow seamlessly together—creating an inviting space for both everyday living and entertaining. The kitchen overlooks the main living area and includes ample counter space, generous cabinetry, and a central island that serves as a natural gathering point. The private primary suite is tucked away from the secondary bedrooms and provides a relaxing retreat with a walk-in closet and an ensuite bath. One of the standout features of the Howa
Key facts
- Central island
- Ample counter space
- Generous cabinetry
Tags
Property features AI
Finance
- HOA & community: Part of a homeowners association (Briarwood Community); Annual association fee; Association covers common area maintenance; Community amenities include fitness center, playground, park, pool, pet amenities, common grounds/areas, and curbs
Exterior
- Parking: Attached garage with inside entrance; Garage faces front; Single garage door; Driveway parking; 2 covered parking spaces (total 2 parking spaces)
- Security: Smoke detector(s)
- Utilities: Municipal water; Municipal sewer (Municipal Utility District); Electricity available; Natural gas available; Cable available; Phone available; Underground utilities
- Home design: Two-story home; New construction by Dream Finder Homes; Faces north; Slab foundation
- Construction: Built with frame, HardiPlank type, glass, masonry, and concrete materials; Composition shingle roof
- Exterior features: Private yard; Covered front porch and patio; Patio; Rain gutters; Privacy wood fencing; Sprinkler system (front, rear, side; automatic, in-ground); Back yard and front yard; Community pool
Interior
- Kitchen: Dishwasher; Gas cooktop; Oven; Microwave; Disposal; Stainless steel appliances; Vented exhaust fan; Pantry
- Bedrooms: One main-level bedroom; Additional bedrooms on main and second levels (see remarks for details)
- Flooring: Carpet; Laminate; Tile
- Bathrooms: Three full bathrooms; One half bathroom; Double vanity in at least one bathroom
- Heating & cooling: Central heating; Central air conditioning
- Interior features: Open floorplan; Entrance foyer; Recessed lighting; No interior steps; Main level primary bedroom; Walk-in closet(s); Double pane, insulated, ENERGY STAR qualified windows with screens; Quartz counters; Breakfast bar; Eat-in kitchen; Kitchen island; See remarks (additional interior details)
- Laundry & utility: Laundry room on main level; Washer hookup; Electric dryer hookup; Inside laundry
Neighborhood map
What this means for you Summary
Snapshot
- This is a 5-bed/3.5-bath single-family listed at $342k.
Deal economics
- At list price, monthly cash flow is $-608 ($-7k/yr) — negative.
- To cash-flow at today's rent, offer at most $254k (25.7% below list).
- To meet the 1% rule (rent ≥ 1% of price), the offer needs to be $234k (31.5% below list).
- Recommended offer: $234k (31.5% below list) — sets the bar for 1% rule.
Location & tenants
- Location reads 74/100 on livability (#167 in TX, #4,404 nationally) — a middle-class / working-renter tenant base. Strengths: cost of living A+, housing A+, health & safety A+; Watch: schools F, amenities F, commute F.
- Elgin ISD (rural): math 17% / reading 26% proficiency, ranked #741 of 826 in TX (top 90%) — low school quality limits family demand, transient renter base, plan for 1-2y turnover; 67% free/reduced lunch — lower-income household profile, screen leases tightly.
- Market conditions: Rents rising (+3.1%/yr); 813 active listings in the ZIP; 24 comparable units currently listed for rent nearby; rentals at typical pace (median 22d on market — plan ~3-4 weeks tenant-placement turnaround); solid renter incomes; 17,121 units permitted in Travis County in 2024 (11,963 in 5+ unit buildings).
Forward outlook
- In year one you build about $37k of equity ($2k loan paydown + $34k appreciation (10.0% local appreciation)).
- Travis County population projected at +60% by 2050 — long-run rental-demand tailwind backs the buy-and-hold thesis.
- By year 2, paydown + projected appreciation supports a ~$59k cash-out refi (75% LTV) — recoverable capital for the next deal without selling this one.
Negotiation context
- It's been on market 88 days — a 6% lower offer ($321k) is reasonable based on typical stale-listing flexibility.
Risks & watch-outs
- Climate carrying-cost: severe wind risk, 80% chance of damaging wind over 30y; extreme-heat days projected 7→22/yr by 2055 (HVAC capex compounding) — expect insurance premiums to compound above CPI over the hold.
Questions for the listing agent
- What do current leases actually rent for vs. the listed asking? Can we see a recent rent roll and the last 12 months of T-12 income?
- It's been on market 88 days. Have you received any prior offers? Is the seller open to a 31% concession, seller financing, or rate buy-down credit?
- What does the HOA fee cover, when was the last increase, and are there any pending special assessments or reserve-fund shortfalls?
- Why hasn't it sold? Are there any deal-killer items the seller is aware of (foundation, flood, title, zoning, code violations)?
- Is there a deadline driving the sale (1031 exchange, divorce, estate, relocation)? That informs how much negotiation room exists.
- Schools are F-rated, which usually means shorter tenancies and higher turnover. Who's the typical renter profile here, and what's been the actual vacancy rate?
- The area grade is low — what's the realistic commute time and amenity access for the typical tenant pool here? Any planned neighborhood developments (good or bad) we should know about?
- What's the average days-on-market for RENTAL listings here right now (not sales)? A rising rental-DOM trend means longer vacancies and softer asking-rent achievability than the comps imply.
- What's the recent tenant-quality profile in this submarket — average credit score on applications, eviction rate, late-payment / NSF rate, and stable-employment percentage? A property-management company in the area should have these aggregated.
- How much new for-sale + rental construction is in the pipeline within 1–3 miles? Heavy new supply typically softens prices + rents 12–24 months out; constrained supply supports both.
Investment metrics
- 1% rule
- 0.69% ✗
- Cap rate
- 4.16%
- Cash-on-cash
- -7.61%
- DSCR
- 0.66
- GRM
- 12.2
CMA / ARV
- ARV (on-the-fly)
- $354,620
- Comps found
- 12
Show comp detail 12 sales within ~0.75 mi
| Address | Dist | Beds/Ba | Sqft | Sold | Price | $/sf | Match |
|---|---|---|---|---|---|---|---|
| 18436 Windtree Ln | 0.20mi | 4/3.0 (-1) | 2,420 (-4%) | 3mo | $282,000 | $117 | 74 |
| 13421 Hamilton Hart Dr | 0.10mi | 4/3.0 (-1) | 2,780 (+10%) | 7mo | $394,990 | $142 | 66 |
| 13631 Barn Chime St | 0.38mi | 4/3.0 (-1) | 2,640 (+4%) | 7mo | $389,990 | $148 | 62 |
| 13501 Barn Chime St | 0.44mi | 5/3.0 | 2,740 (+8%) | 3mo | $349,990 | $128 | 61 |
| 18400 Sun Haven Cv | 0.35mi | 4/3.0 (-1) | 2,343 (-8%) | 4mo | $273,900 | $117 | 61 |
| 13605 Hamilton Hart Dr | 0.16mi | 4/3.0 (-1) | 2,211 (-13%) | 6mo | $374,990 | $170 | 59 |
| 18316 Willow Sage Ln | 0.32mi | 5/2.5 | 2,209 (-13%) | 2mo | $265,000 | $120 | 58 |
| 25624 Wheat Seed Ln | 0.47mi | 4/2.5 (-1) | 2,348 (-7%) | 2mo | $319,995 | $136 | 55 |
| 25604 Becky Bourne Ln | 0.23mi | 4/3.0 (-1) | 2,168 (-14%) | 6mo | $399,990 | $184 | 54 |
| 25620 Wheat Seed Ln | 0.47mi | 4/2.5 (-1) | 2,319 (-8%) | 2mo | $324,990 | $140 | 54 |
| 25605 Flora Bella Ln | 0.27mi | 4/2.5 (-1) | 2,162 (-15%) | 2mo | $319,995 | $148 | 52 |
| 13444 Barn Chime St | 0.48mi | 4/2.0 (-1) | 2,257 (-11%) | 3mo | $314,990 | $140 | 46 |
Match score weights: distance 35% · size 25% · config 20% · recency 20%. Top-matched comps best support the ARV.
Projected returns pro-forma
10.0% appreciation · 3.12% rent growth · sell at horizon
- IRR
- 19.0%
- Equity multiple
- 2.54×
- Total profit
- $147,939
- Equity at exit
- $308,101
- IRR
- 17.6%
- Equity multiple
- 5.88×
- Total profit
- $466,856
- Equity at exit
- $664,431
Cash invested: $95,760 (down + closing). Projections, not guarantees.
Landlord ↔ Tenant lean methodology
- Overall (STATE)
- 87 Strongly Landlord-Friendly
- State Texas
- 87 Strongly Landlord-Friendly · R+5
- County
- — inherits STATE
- City
- — inherits STATE
ZIP-level market 78621
- Home prices YoY
- 7.6%
- Rents YoY
- 3.1%
- Active inventory
- 813
- Price-to-rent
- 12.2×
Monthly cashflow live
- Estimated rent
- $2,344 high interval (Pro) →
- Mortgage (P&I)
- −$1,793
- Tax est. 1.5%
- −$428 /mo · $5,130/yr
- Insurance
- −$142
- HOA
- −$96
- Vacancy / Maint / Mgmt
- −$492
- Net cashflow
- $-608
Break-even live
Sensitivity live
| Price | -10% $-371 | -5% $-489 | +0% $-608 | +5% $-726 | +10% $-844 |
|---|---|---|---|---|---|
| Rent | -10% $-793 | -5% $-700 | +0% $-608 | +5% $-515 | +10% $-422 |
| Rate | -1.0pp $-435 | -0.5pp $-521 | base $-608 | +0.5pp $-696 | +1.0pp $-786 |
UW: 25.0% down · 7.5% · 30yr · 1.5% tax · 5.0% vac · 8.0% maint · 8.0% mgmt
Financing live
Cash to close
- Down payment
- $85,500
- Closing costs
- $10,260
- Reserves months
- —
- Total cash needed
- —
Loan-product check · same deal, 3 products live
Conventional
25% down · 7.5% · 30yr
- Down + closing
- —
- Monthly P&I
- —
- Monthly cashflow
- —
- DSCR
- —
- Eligible?
- —
Personal DTI + credit; lowest rate.
DSCR
20% down · 8.5% · 30yr
- Down + closing
- —
- Monthly P&I
- —
- Monthly cashflow
- —
- DSCR
- —
- Eligible?
- —
No personal income docs; deal must DSCR.
Hard money
10% down · 12.0% · 12mo
- Down + closing
- —
- Monthly P&I
- —
- Monthly cashflow
- —
- DSCR
- —
- Eligible?
- —
Short-term bridge; refi at stabilization.
Rent comps 24 comps
| Address | Beds | Baths | Sqft | Rent | $/sqft | DOM | Units | Dist |
|---|---|---|---|---|---|---|---|---|
| 18436 Weatherby Ln Elgin, TX | 4.0 | 2.5 | 2095 | $2,000 | $0.95 | 5d | 1 | 0.12mi |
| 13501 Sierra Wind Ln Elgin, TX | 4.0 | 2.5 | 2066 | $2,500 | $1.21 | 21d | 1 | 0.47mi |
| 14129 Tordillo Dr Unit NA Elgin, TX | 4.0 | 2.5 | 1874 | $2,595 | $1.38 | 5d | 1 | 0.83mi |
| 14129 Tordillo Dr Elgin, TX | 4.0 | 2.5 | 1874 | $2,675 | $1.43 | 25d | 1 | 0.83mi |
| 722 Lavaca Loop Elgin, TX | 4.0 | 2.5 | 2075 | $1,895 | $0.91 | 19d | 1 | 0.86mi |
| 19017 Romano Dr Elgin, TX | 4.0 | 3.0 | 2473 | $2,198 | $0.89 | 5d | 1 | 0.92mi |
| 18505 Quiet Range Dr Unit 18505 Elgin, TX | 4.0 | 2.0 | 1794 | $1,785 | $0.99 | 5d | 1 | 1.00mi |
| 18505 Quiet Range Dr Elgin, TX | 4.0 | 2.0 | 1794 | $1,950 | $1.09 | 25d | 1 | 1.00mi |
| 18721 Quiet Range Dr Elgin, TX | 3.0–5.0 | 2.0–3.5 | 1773 | $2,820 | $1.59 | 3d | 1 | 1.00mi |
| 13725 Knights Branch Dr Elgin, TX | 4.0 | 2.5 | 1800 | $2,100 | $1.17 | 25d | 1 | 1.01mi |
| 18525 Quiet Range Dr Elgin, TX | 4.0 | 2.0 | 1794 | $1,725 | $0.96 | 19d | 1 | 1.02mi |
| 11524 Rush Ln Elgin, TX | 4.0 | 3.0 | 2473 | $2,300 | $0.93 | 45d | 1 | 1.07mi |
| 16429 Farmhouse Ln Elgin, TX | 5.0 | 2.5 | 2542 | $2,000 | $0.79 | 4d | 1 | 1.08mi |
| 14101 Prospector Way Unit 14101 Elgin, TX | 4.0 | 2.5 | 2198 | $2,099 | $0.95 | 25d | 1 | 1.10mi |
| 14101 Prospector Way Elgin, TX | 4.0 | 2.5 | 2198 | $2,099 | $0.95 | 45d | 1 | 1.10mi |
| 18612 Allen Welch Dr Elgin, TX | 4.0 | 2.0 | 1794 | $1,885 | $1.05 | 5d | 1 | 1.11mi |
| 14300 Boomtown Way Elgin, TX | 4.0 | 2.0 | 1794 | $2,050 | $1.14 | 25d | 1 | 1.16mi |
| 17041 Dusty Boots Ln Elgin, TX | 5.0 | 2.5 | 2542 | $2,370 | $0.93 | 4d | 1 | 1.17mi |
| 18741 Speculator Ln Elgin, TX | 5.0 | 2.5 | 2542 | $1,980 | $0.78 | 25d | 1 | 1.19mi |
| 19024 Quiet Range Dr Elgin, TX | 5.0 | 2.5 | 2542 | $1,995 | $0.78 | 45d | 1 | 1.19mi |
| 17001 Dusty Boots Ln Elgin, TX | 5.0 | 2.5 | 2542 | $1,945 | $0.77 | 21d | 1 | 1.24mi |
| 18300 Speculator Ln Elgin, TX | 4.0 | 2.0 | 1794 | $1,995 | $1.11 | 25d | 1 | 1.24mi |
| 18501 Spotted Eagle Ln Elgin, TX | 5.0 | 3.5 | 2891 | $2,800 | $0.97 | 4d | 1 | 1.40mi |
| 209 Lake Placid Run Elgin, TX | 5.0 | 3.0 | 2196 | $2,200 | $1.00 | 25d | 1 | 1.49mi |
HOA detail
- Monthly dues
- $96 · $1,152/yr
Listing history 7 events
-
2026-04-10status Pending
-
2026-03-09price $342,000
-
2026-03-03price $359,000
-
2026-03-01price $362,000
-
2026-02-27price $359,000
-
2026-02-02price $366,955
-
2026-01-12$363,955 Active
ⓘ Source: listings_history table (triggers on properties + properties_extension) + one-shot
backfill from property_details.listing_events for pre-trigger history.
Climate risk First Street
- Flood 1/10 Low FEMA zone X (unshaded) · 0% chance over 30 yrs
- Wildfire 3/10 Moderate
- Heat 8/10 Severe 7 d/yr ≥109°F today · 22 d/yr by 30 yrs out
- Wind 8/10 Severe 80% chance of damaging wind over 30 yrs
- Air quality 1/10 Low 0 unhealthy d/yr today · 0 by 30 yrs out
Nearby sold comps map
Loading sold comps map…
Walkable amenities ~0.75 mi
Loading nearby amenities…
Taxation est. · year 1
- Rental income
- $28,129
- − Mortgage interest
- −$19,157
- − Property taxes
- −$5,130
- − Insurance
- −$1,710
- − Repairs & maintenance
- −$2,250
- − Management
- −$2,250
- − HOA
- −$1,152
- − Depreciation
- −$9,949
- Taxable loss
- −$13,470
- Est. tax savings @ 24.0%
- +$3,233
- After-tax cash flow
- $-4,059/yr
For passive investors: Depreciation is non-cash, so a rental often shows a tax loss while cash-flowing — sheltering income. Rental losses are passive: they offset passive income freely, and up to $25,000/yr can offset ordinary (W-2) income if you actively participate and your MAGI is under $100k (phasing out to $0 by $150k); unused losses carry forward. On sale, claimed depreciation is recaptured at up to 25%, and gains may owe capital-gains tax (a 1031 exchange can defer both). Figures are a year-1 estimate at your 24.0% rate — not tax advice; consult a CPA.
Schools (NCES district)
- District
- Elgin ISD
- NCES district ID
- 4818360
- Math proficiency
- 17% ▼ -9.00%
- Reading proficiency
- 26% ▼ -5.00%
- Median HH income
- $55,176
- Composite
- 19.62/100
- National rank
- #8749
- State rank
- #741 of 826 in TX
Livability — Elgin
- Score
- 74/100
- State rank
- #167
- US rank
- #4404
Category grades
Schools grade is shown separately in the Schools card above.
Census & demographics
- Census place
- Elgin, TX
- County
- Bastrop County · 68,601 people
- City population
- 27,860
- Metro
- Austin-Round Rock-Georgetown, TX
- Population (ZIP)
- 30,411
- Household income
- $98,534
- Rent vs Own
- Severe rent burden
- 235.0
Population outlook (Travis County) Hauer SSP2
- Today (2025)
- 1,545,133 people
- By 2030
- 1,729,269 · +11.9%
- By 2040
- 2,097,596 · +35.8%
- By 2050
- 2,463,890 · +59.5%
- By 2075
- 3,249,374 · +110.3%
- By 2100
- 3,801,868 · +146.1%
Race, ethnicity, and origin ACS 2023
- Neighborhood character
- Diverse neighborhood (Simpson 0.64)
- Race & ethnicity
- Hispanic / Latino 46% White 38% Two or more races 19% Black 11% Native American 1%
- Hispanic origin (detail)
- Mexican 38%
- Common ancestry
- Slovak 2% Italian 2% Romanian 1%
- Foreign-born
- 17% · Canada, Vietnam
- Languages at home
- 63% English-only · Spanish 36%
Political lean MEDSL · Travis
- 2024 margin
- Solid D (+39.3) · D 68.8% · R 29.4% · Other 1.8%
- 2008→2024 swing
- +9.9pp toward D · 2008: 29.4pp · 2024: 39.3pp
- All cycles
- 2024: D+39.3 2020: D+45.0 2016: D+38.9 2012: D+23.9 2008: D+29.4
Not yet ingested
- Civics
- —
Market trends
- HPI YoY
- ▲ 29.47%
- Current HPI
- 416.87
- Rent YoY
- ▲ 3.12%
- Metro
- Austin-Round Rock-Georgetown, TX
- State GDP YoY
- ▲ 3.95%
- F500 in state
- 110
Industry mix (Fortune 500 HQ in TX)
| Industry | F500 HQs | Revenue |
|---|---|---|
| Energy | 16 | $1,198B |
|
||
| Technology | 5 | $198B |
|
||
| Engineering / Construction | 4 | $72B |
|
||
| Energy Services | 3 | $60B |
|
||
| Utilities | 3 | $41B |
|
||
| Healthcare | 2 | $330B |
|
||
Price history
-6.0% since first listed7 events — show timeline
- 2026-04-10 Pending — Unlock MLS
- 2026-03-09 Price Changed $342,000 Unlock MLS
- 2026-03-03 Price Changed $359,000 Unlock MLS
- 2026-03-01 Price Changed $362,000 Unlock MLS
- 2026-02-27 Price Changed $359,000 Unlock MLS
- 2026-02-02 Price Changed $366,955 Unlock MLS
- 2026-01-12 Listed $363,955 Unlock MLS
Cash-flow waterfall
monthlySold comps — $/sqft
last 12 mo · ≤1 miLoading sold comps…