 Multi-family
4000 NE 109th Ave · Vancouver, WA
Flood risk No data
- FEMA flood zone
- —
- Chance of flooding over 30 yrs
- —
- Est. flood insurance / yr
- —
Fire risk No data
- Est. fire insurance / yr
- —
Heat risk No data
- Hot days now (above threshold)
- —
- Hot days in 30 yrs
- —
Wind risk No data
- Chance of severe wind over 30 yrs
- —
Air-quality risk No data
- Unhealthy air days now
- —
- Unhealthy air days in 30 yrs
- —
Risk factors via First Street. Map © Google.
Why this score? — see what drove the C- grade
The composite is a weighted blend of 9 inputs, each scored 0–100. Each bar is that input's sub-score; the figure is the points it added to the 100-point composite (weight × sub-score).
- Cash flow +19.1/30.0
- ARV discount +7.5/15.0
- 1% rule +6.3/10.0
- DSCR +6.0/10.0
- Schools +4.3/10.0
- Livability +4.1/5.0
- Rent growth +2.7/5.0
- Condition / age +2.5/5.0
- Appreciation +0.0/10.0
$275,000
🖨 Deal sheet (PDF) 📄 Offer letter ✓ Due diligence
Multi-family units
County records classify this as Multi-Family (5+ Unit). Listing-text estimate: 1 unit. estimate disagrees with records
5+ unit building — per-unit beds/baths from public records are typically unavailable; the breakdown below (if shown) is an estimate from the listing text.
Listing remarks MLS
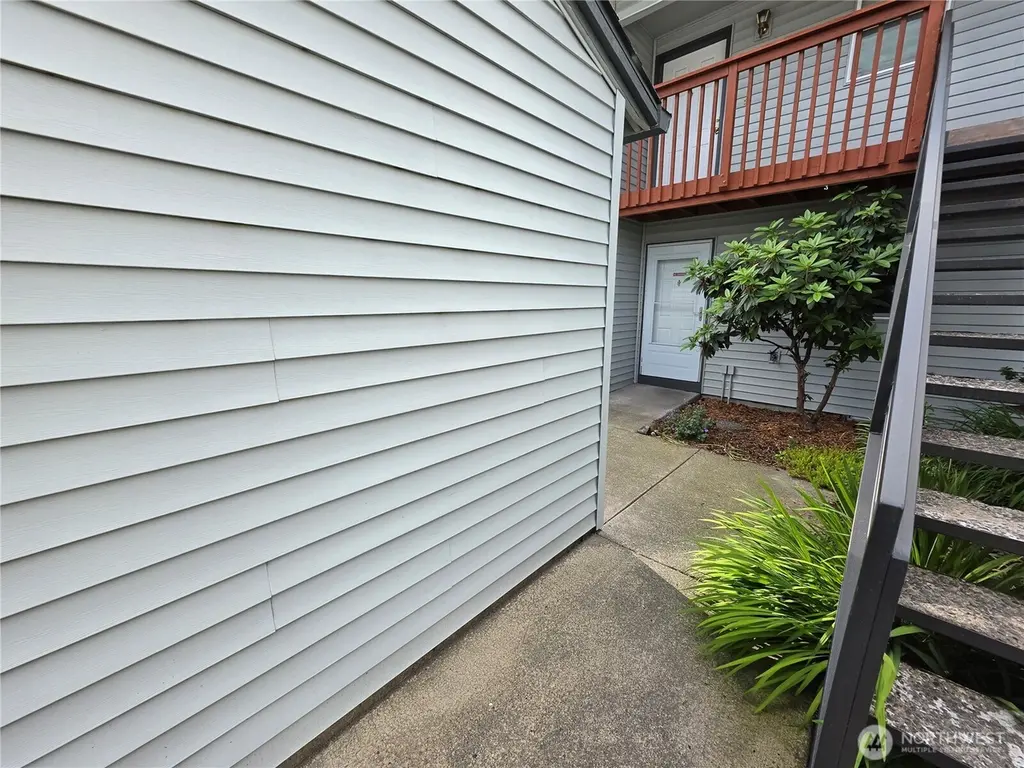
This updated 2-bedroom, 1-bathroom townhouse offers 832 sqft of cozy living space. Recently updated throughout, this home features a bright living area and a modern kitchen, ready for you to move right in.Enjoy the small fenced patio for some outdoor space, plus a detached 1-car garage for parking and extra storage.Located in a great Vancouver neighborhood, you’re just minutes from shopping, dining, and easy access to main roads. Don’t miss out—schedule a showing today!
Key facts
- Cozy gas fireplace
- Serene wooded area
- Private back patio
Tags
Property features AI
Finance
- Other: Stonebrook Condominiums; Calculated living area: 889 square feet; Floor number: 1
- Financial info: Listing terms: Cash or Conventional
- HOA & community: HOA managed by Invest West Management; Monthly association fee of $274.34 (includes water and sewer; see remarks for details); Community has 248 units
Exterior
- Parking: Individual garage (covered: 1 space); Uncovered parking available
- Utilities: Water: City of Vancouver; Sewer: City of Vancouver; Power: Clark PUD; Energy sources: Electric and natural gas
- Home design: Attached condominium; One-level condo unit (ground floor); Main entry; Unit has a view; Building has 2 stories
- Construction: Metal/vinyl construction; Composition roof
- Exterior features: Sidewalk; Metal/vinyl exterior
Interior
- Kitchen: Dishwasher; Stove/Range
- Bedrooms: 2 bedrooms (both on main level)
- Flooring: Ceramic tile; Laminate; Carpet
- Bathrooms: 1 full bathroom; 1 three-quarter bathroom; One bathtub and two showers
- Heating & cooling: Forced air heating; Heat pump cooling
- Interior features: Fireplace (gas); Dryer-electric hookup; Washer hookup
- Laundry & utility: Washer hookup; Electric dryer hookup
Neighborhood map
What this means for you Summary
Snapshot
- This is a 2-bed/2.0-bath multifamily listed at $275k.
Deal economics
- At list price, monthly cash flow is $290 ($3k/yr) — positive.
- The deal already cash-flows at list — no discount required.
- Meets the 1% rule at list price ($3k rent vs $275k).
- Cap rate 7.6% vs local median 2.7% in Vancouver — top-decile yield for the area; either an underpriced asset or a hidden risk that comps aren't pricing in. Stress-test before assuming the spread holds.
Location & tenants
- Location reads 82/100 on livability (#62 in WA, #1,133 nationally) — a professional / high-income tenant draw. Strengths: amenities A+, commute A+, housing A+; Watch: crime F, cost of living D-.
- Evergreen School District (Clark) (urban): math 41% / reading 51% proficiency, ranked #164 of 291 in WA (top 56%) — families likely to look elsewhere, expect single-tenant / working-renter base with shorter leases.
- Zoned schools: Fircrest Elementary School (294 students, 74% FRL); Covington Middle School (868 students, 73% FRL); Evergreen High School (1,550 students, 64% FRL) — zoned schools average 70% FRL vs 39% district-wide (32 pts higher); higher-poverty schools than district average — tighter screening recommended.
- Market conditions: Rents flat; 463 active listings in the ZIP; 40 comparable units currently listed for rent nearby; rentals leasing fast (median 9d on market — plan ~1-2 weeks tenant-placement turnaround); solid renter incomes; 3,547 units permitted in Clark County in 2024 (1,361 in 5+ unit buildings).
- This rent runs 37% of the median local income ($100k/yr) — at the standard rent-burdened threshold; future hikes will face affordability resistance.
Forward outlook
- Local home prices are declining (-3.0%/yr); year-one equity from $2k of loan paydown is wiped out by about $8k of value loss. Plan a longer hold.
- Clark County population projected at +29% by 2050 — long-run rental-demand tailwind backs the buy-and-hold thesis.
Negotiation context
- Only 1 days on market — expect competitive offers; lowballing is unlikely to land.
- 30 sale attempts since 26y ago with the ask held roughly flat each time — persistent listings suggest the price (not the market) is what's stuck; bring a comps-based counter.
Questions for the listing agent
- What does the HOA fee cover, when was the last increase, and are there any pending special assessments or reserve-fund shortfalls?
- Is there a deadline driving the sale (1031 exchange, divorce, estate, relocation)? That informs how much negotiation room exists.
- Crime grade is F in this area — have there been break-ins, vandalism, or insurance claims at this property in the last 3 years? What carrier currently insures it and at what premium?
- What's the average days-on-market for RENTAL listings here right now (not sales)? A rising rental-DOM trend means longer vacancies and softer asking-rent achievability than the comps imply.
- What's the recent tenant-quality profile in this submarket — average credit score on applications, eviction rate, late-payment / NSF rate, and stable-employment percentage? A property-management company in the area should have these aggregated.
- How much new apartment / multifamily construction is in the pipeline within 1–3 miles? Heavy new supply (>2% of stock underway) typically softens rents 12–24 months out; light construction supports rent growth.
Investment metrics
- 1% rule
- 1.13% ✓
- Cap rate
- 7.56%
- Cash-on-cash
- 4.52%
- DSCR
- 1.20
- GRM
- 7.3
CMA / ARV
No comps found within radius.
Projected returns pro-forma
-3.0% appreciation · 0.63% rent growth · sell at horizon
- IRR
- -12.2%
- Equity multiple
- 0.57×
- Total profit
- $-33,123
- Equity at exit
- $41,003
- IRR
- -7.6%
- Equity multiple
- 0.58×
- Total profit
- $-32,598
- Equity at exit
- $23,777
Cash invested: $77,000 (down + closing). Projections, not guarantees.
Landlord ↔ Tenant lean methodology
- Overall (STATE)
- 28 Tenant-Leaning
- State Washington
- 28 Tenant-Leaning · D+8
- County
- — inherits STATE
- City
- — inherits STATE
ZIP-level market 98682
- Rents YoY
- 0.6%
- Active inventory
- 463
- Price-to-rent
- 14.7×
Monthly cashflow live
- Estimated rent
- $3,120 medium interval (Pro) →
- Mortgage (P&I)
- −$1,442
- Tax est. 1.5%
- −$344 /mo · $4,125/yr
- Insurance
- −$115
- HOA
- −$274
- Vacancy / Maint / Mgmt
- −$655
- Net cashflow
- $290
Break-even live
Sensitivity live
| Price | -10% $480 | -5% $385 | +0% $290 | +5% $195 | +10% $100 |
|---|---|---|---|---|---|
| Rent | -10% $44 | -5% $167 | +0% $290 | +5% $414 | +10% $537 |
| Rate | -1.0pp $429 | -0.5pp $360 | base $290 | +0.5pp $219 | +1.0pp $147 |
2-unit breakdown (identical units grouped — click to expand)
| Units | Beds | Baths | Est. rent |
|---|---|---|---|
| 2× units | 2 | 2 | $3,120 |
| #1 | 2 | 2 | $1,560 |
| #2 | 2 | 2 | $1,560 |
| Total (2 units) | $3,120 | ||
UW: 25.0% down · 7.5% · 30yr · 1.5% tax · 5.0% vac · 8.0% maint · 8.0% mgmt
Financing live
Cash to close
- Down payment
- $68,750
- Closing costs
- $8,250
- Reserves months
- —
- Total cash needed
- —
Loan-product check · same deal, 3 products live
Conventional
25% down · 7.5% · 30yr
- Down + closing
- —
- Monthly P&I
- —
- Monthly cashflow
- —
- DSCR
- —
- Eligible?
- —
Personal DTI + credit; lowest rate.
DSCR
20% down · 8.5% · 30yr
- Down + closing
- —
- Monthly P&I
- —
- Monthly cashflow
- —
- DSCR
- —
- Eligible?
- —
No personal income docs; deal must DSCR.
Hard money
10% down · 12.0% · 12mo
- Down + closing
- —
- Monthly P&I
- —
- Monthly cashflow
- —
- DSCR
- —
- Eligible?
- —
Short-term bridge; refi at stabilization.
Rent comps 40 comps
| Address | Beds | Baths | Sqft | Rent | $/sqft | DOM | Units | Dist |
|---|---|---|---|---|---|---|---|---|
| 4000 NE 109th Ave Vancouver, WA | 1.0–2.0 | 1.0–2.5 | 780 | $1,950 | $2.50 | 4d | 2 | 0.16mi |
| 3708 NE 109th Ave Vancouver, WA | 1.0–3.0 | 1.0–2.0 | 854 | $1,816 | $2.13 | 0d | 32 | 0.17mi |
| 4202 NE Morrow Rd #203 Vancouver, WA | 2.0 | 1.5 | 921 | $1,795 | $1.95 | 45d | 1 | 0.25mi |
| 10809 NE 48th Cir Apt C Vancouver, WA | 2.0 | 1.0 | 806 | $1,395 | $1.73 | 45d | 1 | 0.48mi |
| 10415 NE Oakbrook Cir Vancouver, WA | 1.0–2.0 | 1.0–1.5 | 764 | $1,556 | $2.04 | 0d | 5 | 0.52mi |
| 11111 NE 48th Cir Unit D Vancouver, WA | 2.0 | 1.0 | 860 | $1,575 | $1.83 | 45d | 1 | 0.56mi |
| 11114 NE 48th Cir Unit B Vancouver, WA | 2.0 | 1.0 | 700 | $1,395 | $1.99 | 45d | 1 | 0.57mi |
| 4821 NE 110th Ave Vancouver, WA | 2.0 | 2.0 | 1020 | $1,595 | $1.56 | 25d | 3 | 0.60mi |
| 11205 NE 49th St Unit 11303D Vancouver, WA | 2.0 | 1.0 | 944 | $1,595 | $1.69 | 21d | 1 | 0.62mi |
| 11205 NE 49th St Unit 11209B Vancouver, WA | 2.0 | 1.0 | 1104 | $1,675 | $1.52 | 14d | 1 | 0.62mi |
| 4619 NE 112th Ave Vancouver, WA | 1.0–3.0 | 1.0–2.0 | 820 | $1,650 | $2.01 | 0d | 25 | 0.71mi |
| 11412 NE 49th St Vancouver, WA | 1.0–2.0 | 1.0–2.0 | 810 | $1,665 | $2.06 | 0d | 8 | 0.75mi |
| 4902 NE 94th Ave Vancouver, WA | 2.0 | 1.0 | 471 | $1,532 | $3.25 | 4d | 1 | 0.82mi |
| 11716 NE 49th St Vancouver, WA | 1.0–3.0 | 1.0–2.5 | 1090 | $1,788 | $1.64 | 0d | 13 | 0.86mi |
| 11328 NE 51st Cir Vancouver, WA | 2.0–4.0 | 1.0–2.0 | 1086 | $1,549 | $1.43 | 9d | 8 | 0.89mi |
| 2201 NE 112th Ave Vancouver, WA | 1.0–3.0 | 1.0–2.0 | 935 | $1,846 | $1.97 | 6d | 1 | 0.93mi |
| 2201 NE 112th Ave Vancouver, WA | 1.0 | 1.0 | 713 | $1,565 | $2.19 | 45d | 1 | 0.93mi |
| 2201 NE 112th Ave Vancouver, WA | 1.0 | 1.0 | 713 | $1,575 | $2.21 | 14d | 1 | 0.93mi |
| 11022 NE 18th St Unit E223 Vancouver, WA | 2.0 | 2.0 | 1010 | $1,445 | $1.43 | 45d | 1 | 0.95mi |
| 11022 NE 18th St Unit E322 Vancouver, WA | 2.0 | 2.0 | 1010 | $1,395 | $1.38 | 25d | 1 | 0.95mi |
| 11022 NE 18th St Unit C211 Vancouver, WA | 2.0 | 2.0 | 1010 | $1,445 | $1.43 | 4d | 1 | 0.95mi |
| 11022 NE 18th St Unit C213 Vancouver, WA | 2.0 | 2.0 | 1010 | $1,445 | $1.43 | 9d | 1 | 0.95mi |
| 11202 NE 20th St Vancouver, WA | 1.0–2.0 | 1.0–2.0 | 928 | $1,923 | $2.07 | 0d | 6 | 0.95mi |
| 2000 NE 112th Ave Unit C33 Vancouver, WA | 1.0 | 1.0 | 824 | $1,325 | $1.61 | 17d | 1 | 0.97mi |
| 2000 NE 112th Ave Unit A12 Vancouver, WA | 2.0 | 2.0 | 1056 | $1,545 | $1.46 | 45d | 1 | 0.97mi |
| 11018 NE 18th St Unit B20 Vancouver, WA | 1.0 | 1.0 | 801 | $1,345 | $1.68 | 25d | 1 | 1.01mi |
| 11018 NE 18th St Unit C26 Vancouver, WA | 1.0 | 1.0 | 801 | $1,295 | $1.62 | 45d | 1 | 1.01mi |
| 9009 NE 54th St Vancouver, WA | 1.0–3.0 | 1.0–2.0 | 1175 | $2,098 | $1.78 | 0d | 6 | 1.03mi |
| 4905 NE 122nd Ave Vancouver, WA | 1.0 | 1.0 | 684 | $1,500 | $2.19 | 9d | 1 | 1.04mi |
| 5264 NE 121st Ave Vancouver, WA | 2.0 | 2.0 | 944 | $1,850 | $1.96 | 45d | 1 | 1.04mi |
| 1900 NE 113th Ct Vancouver, WA | 1.0–2.0 | 1.0–2.0 | 887 | $1,777 | $2.00 | 0d | 6 | 1.05mi |
| 9013 NE 54th St Vancouver, WA | 2.0 | 2.0 | 1033 | $1,405 | $1.36 | 3d | 2 | 1.06mi |
| 12101 NE 28th St Vancouver, WA | 1.0–2.0 | 1.0–2.0 | 806 | $2,086 | $2.59 | 0d | 12 | 1.08mi |
| 6001 NE 102nd Ave Vancouver, WA | 2.0–3.0 | 2.0 | 1125 | $1,750 | $1.56 | 3d | 6 | 1.10mi |
| 9001 NE 54th St Vancouver, WA | 1.0–2.0 | 1.0 | 618 | $1,660 | $2.68 | 4d | 1 | 1.11mi |
| 11900 NE 18th St Vancouver, WA | 1.0–3.0 | 1.0–3.0 | 1318 | $2,188 | $1.66 | 45d | 1 | 1.11mi |
| 1618 NE 112th Ave Vancouver, WA | 1.0 | 1.0 | 588 | $1,504 | $2.56 | 4d | 3 | 1.13mi |
| 8701 NE 54th St Vancouver, WA | 1.0–3.0 | 1.0–2.0 | 1006 | $1,794 | $1.78 | 0d | 9 | 1.15mi |
| 8011 NE Fourth Plain Blvd Vancouver, WA | 1.0–2.0 | 1.0–2.0 | 855 | $1,625 | $1.90 | 4d | 6 | 1.22mi |
| 8778 NE 54th St Vancouver, WA | 1.0–2.0 | 1.0–2.0 | 857 | $1,911 | $2.23 | 0d | 11 | 1.24mi |
HOA detail
- Monthly dues
- $274 · $3,288/yr
Listing history 2 events
-
2026-06-09remarks 503-char remark
-
2026-06-09$275,000 Active 1 DOM
ⓘ Source: listings_history table (triggers on properties + properties_extension) + one-shot
backfill from property_details.listing_events for pre-trigger history.
Nearby sold comps map
Loading sold comps map…
Walkable amenities ~0.75 mi
Loading nearby amenities…
Taxation est. · year 1
- Rental income
- $37,440
- − Mortgage interest
- −$15,404
- − Property taxes
- −$4,125
- − Insurance
- −$1,375
- − Repairs & maintenance
- −$2,995
- − Management
- −$2,995
- − HOA
- −$3,288
- − Depreciation
- −$8,000
- Taxable loss
- −$743
- Est. tax savings @ 24.0%
- +$178
- After-tax cash flow
- $3,662/yr
For passive investors: Depreciation is non-cash, so a rental often shows a tax loss while cash-flowing — sheltering income. Rental losses are passive: they offset passive income freely, and up to $25,000/yr can offset ordinary (W-2) income if you actively participate and your MAGI is under $100k (phasing out to $0 by $150k); unused losses carry forward. On sale, claimed depreciation is recaptured at up to 25%, and gains may owe capital-gains tax (a 1031 exchange can defer both). Figures are a year-1 estimate at your 24.0% rate — not tax advice; consult a CPA.
Schools (NCES district)
- District
- Evergreen School District (Clark)
- NCES district ID
- 5302700
- Math proficiency
- 41% ▼ -3.00%
- Reading proficiency
- 51% ▼ -3.00%
- Median HH income
- $59,418
- Composite
- 42.53/100
- National rank
- #6859
- State rank
- #164 of 291 in WA
Livability — Vancouver
- Score
- 82/100
- State rank
- #62
- US rank
- #1133
Category grades
Schools grade is shown separately in the Schools card above.
Census & demographics
- Census place
- Vancouver, WA
- County
- Clark County · 513,189 people
- City population
- 360,195
- Metro
- Portland-Vancouver-Hillsboro, OR-WA
- Population (ZIP)
- 68,305
- Household income
- $99,918
- Rent vs Own
- Severe rent burden
- 1618.0
Population outlook (Clark County) Hauer SSP2
- Today (2025)
- 529,610 people
- By 2030
- 563,242 · +6.4%
- By 2040
- 625,905 · +18.2%
- By 2050
- 681,558 · +28.7%
- By 2075
- 805,967 · +52.2%
- By 2100
- 877,450 · +65.7%
Race, ethnicity, and origin ACS 2023
- Neighborhood character
- Predominantly White (69%)
- Race & ethnicity
- White 69% Hispanic / Latino 15% Two or more races 13% Asian 6% Black 2% Pacific Islander 1%
- Hispanic origin (detail)
- Mexican 12%
- Common ancestry
- Portuguese 3% Subsaharan African 3% Scotch-Irish 2%
- Foreign-born
- 13% · Canada, Vietnam, South Korea
- Languages at home
- 79% English-only · Spanish 8% Russian/Polish/Slavic 6% Other Asian/Pacific 2%
Political lean MEDSL · Clark
- 2024 margin
- Lean D (+7.0) · D 52.1% · R 45.1% · Other 2.8%
- 2008→2024 swing
- +0.9pp no change · 2008: 6.1pp · 2024: 7.0pp
- All cycles
- 2024: D+7.0 2020: D+5.1 2016: D+0.1 2012: D+0.1 2008: D+6.1
Not yet ingested
- Civics
- —
Market trends
- HPI YoY
- ▼ -303.95%
- Current HPI
- 307.0529
- Rent YoY
- ▲ 0.63%
- Metro
- Portland-Vancouver-Hillsboro, OR-WA
- State GDP YoY
- ▲ 4.65%
- F500 in state
- 22
Industry mix (Fortune 500 HQ in WA)
| Industry | F500 HQs | Revenue |
|---|---|---|
| Retail | 2 | $269B |
|
||
| Technology / Retail | 1 | $638B |
|
||
| Technology | 1 | $245B |
|
||
| Telecommunications | 1 | $38B |
|
||
| Food / Beverage | 1 | $36B |
|
||
| Automotive / Trucks | 1 | $34B |
|
||
Price history
+221.8% since first listed88 events — show timeline
- 2026-06-08 Listed $275,000 NWMLS as Distributed by MLS Grid
- 2025-04-04 Sold (MLS) $275,000 RMLS
- 2025-02-22 Pending — RMLS
- 2025-01-23 Price Changed $270,000 RMLS
- 2025-01-21 Listed $265,000 RMLS
- 2024-04-10 Rental Removed $1,299 APPFOLIO
- 2024-04-06 Rental Removed $1,299 APPFOLIO
- 2024-04-05 Listed for Rent $1,299 APPFOLIO
- 2024-03-15 Listed for Rent $1,870 APPFOLIO
- 2024-03-15 Rental Removed $1,870 APPFOLIO
- 2024-03-15 Listed for Rent $1,870 APPFOLIO
- 2024-03-13 Rental Removed $2,299 APPFOLIO
- 2024-01-26 Listed for Rent $2,299 APPFOLIO
- 2024-01-02 Rental Removed $2,090 APPFOLIO
- 2024-01-02 Listed for Rent $2,090 APPFOLIO
- 2023-12-13 Rental Removed $2,090 APPFOLIO
- 2023-11-13 Listed for Rent $2,090 APPFOLIO
- 2018-11-14 Sold (MLS) $161,000 NWMLS as Distributed by MLS Grid
- 2018-10-12 Pending — NWMLS as Distributed by MLS Grid
- 2018-09-23 Price Changed $168,750 NWMLS as Distributed by MLS Grid
- 2018-08-24 Listed $174,900 NWMLS as Distributed by MLS Grid
- 2018-03-08 Sold (MLS) $179,900 RMLS
- 2018-01-25 Pending — RMLS
- 2018-01-05 Delisted — RMLS
- 2018-01-04 Listed $179,900 RMLS
- 2018-01-04 Relisted — RMLS
- 2016-12-22 Sold (MLS) $142,500 RMLS
- 2016-11-08 Pending — RMLS
- 2016-11-02 Delisted — RMLS
- 2016-10-27 Price Changed $150,000 RMLS
- 2016-10-07 Listed $155,000 RMLS
- 2016-09-01 Sold (MLS) $150,000 RMLS
- 2016-08-30 Sold (MLS) $124,000 RMLS
- 2016-07-20 Pending — RMLS
- 2016-07-06 Listed $150,000 RMLS
- 2016-07-06 Delisted — RMLS
- 2016-06-22 Listed $139,900 RMLS
- 2014-12-03 Sold (MLS) $112,500 RMLS
- 2014-10-22 Pending — RMLS
- 2014-10-13 Price Changed $112,500 RMLS
- 2014-09-30 Listed $119,000 RMLS
- 2013-08-23 Sold (MLS) $73,000 RMLS
- 2013-08-14 Pending — RMLS
- 2013-08-09 Price Changed $73,000 RMLS
- 2013-08-06 Contingent — RMLS
- 2013-06-08 Pending — RMLS
- 2013-04-09 Contingent — RMLS
- 2013-04-02 Listed $79,900 RMLS
- 2012-11-16 Sold (MLS) $64,000 RMLS
- 2012-11-05 Pending — RMLS
- 2012-07-11 Contingent — RMLS
- 2012-06-27 Listed $65,000 RMLS
- 2011-06-24 Sold (MLS) $64,000 NWMLS as Distributed by MLS Grid
- 2011-04-08 Pending — NWMLS as Distributed by MLS Grid
- 2011-03-27 Listed $69,900 NWMLS as Distributed by MLS Grid
- 2010-07-30 Sold (Public Records) $825,000 Public Records
- 2010-07-30 Sold (MLS) $825,000 RMLS
- 2009-09-17 Sold (MLS) $96,500 RMLS
- 2009-09-04 Delisted — RMLS
- 2009-06-13 Delisted — RMLS
- 2009-04-10 Sold (MLS) $100,000 NWMLS as Distributed by MLS Grid
- 2009-02-27 Listed $135,000 RMLS
- 2009-02-21 Delisted — NWMLS as Distributed by MLS Grid
- 2009-02-02 Listed $94,500 NWMLS as Distributed by MLS Grid
- 2009-01-05 Listed $3,400,000 RMLS
- 2005-05-11 Sold (MLS) $127,900 RMLS
- 2005-04-19 Delisted — RMLS
- 2005-04-08 Listed $124,900 RMLS
- 2005-03-03 Sold (MLS) $123,250 RMLS
- 2005-03-03 Sold (MLS) $121,000 RMLS
- 2005-03-02 Delisted — RMLS
- 2005-03-02 Delisted — RMLS
- 2005-03-01 Listed $123,250 RMLS
- 2005-03-01 Listed $121,000 RMLS
- 2002-04-26 Sold (MLS) $102,500 RMLS
- 2002-02-05 Listed $102,500 RMLS
- 2001-11-02 Sold (MLS) $99,500 RMLS
- 2001-07-20 Sold (MLS) $107,300 RMLS
- 2001-06-22 Sold (MLS) $105,400 RMLS
- 2001-05-29 Sold (MLS) $89,900 RMLS
- 2001-05-25 Sold (MLS) $89,900 RMLS
- 2001-04-20 Sold (MLS) $108,300 RMLS
- 2001-04-15 Sold (MLS) $89,908 RMLS
- 2000-11-13 Listed $103,400 RMLS
- 2000-11-13 Listed $105,400 RMLS
- 2000-11-13 Listed $108,300 RMLS
- 2000-11-13 Listed $108,300 RMLS
- 2000-10-13 Listed $85,450 RMLS
Property tax history
+37.9%/yrLatest (2026): $205,304 · +2.0% YoY. Source: county tax records.
Cash-flow waterfall
monthlySold comps — $/sqft
last 12 mo · ≤1 miLoading sold comps…