2551 W Golf Blvd #209 · Pompano Beach, FL
Flood risk 4/10 · Minor
- FEMA flood zone
- AH
- Chance of flooding over 30 yrs
- 0.23%
- Est. flood insurance / yr
- $1,142 – $2,507
Fire risk 1/10 · Minimal
- Est. fire insurance / yr
- $947 – $1,759
Heat risk 9/10 · Severe
- Hot days now (above 106°F)
- 3 days/yr
- Hot days in 30 yrs
- 12 days/yr
Wind risk 10/10 · Severe
- Chance of severe wind over 30 yrs
- 99.0%
Air-quality risk 2/10 · Minimal
- Unhealthy air days now
- 1 days/yr
- Unhealthy air days in 30 yrs
- 3 days/yr
Risk factors via First Street. Map © Google.
Why this score? — see what drove the B grade
The composite is a weighted blend of 9 inputs, each scored 0–100. Each bar is that input's sub-score; the figure is the points it added to the 100-point composite (weight × sub-score).
- Cash flow +30.0/30.0
- 1% rule +10.0/10.0
- DSCR +10.0/10.0
- ARV discount +7.5/15.0
- Schools +4.1/10.0
- Livability +3.7/5.0
- Rent growth +2.9/5.0
- Condition / age +2.5/5.0
- Appreciation +0.0/10.0
$89,900
🖨 Deal sheet (PDF) 📄 Offer letter ✓ Due diligence
Listing remarks
PRICE REDUCED! Pompano Beach 2 BR/2 BA Second Floor Condo overlooking garden in Private Golf Community. Freshly Painted and light bright. Low Master HOA and Condo Fees. This 2 BR/2BA will go fast. Great Price! HOA fee includes: Common Areas, FREE RESIDENT GOLF, Scheduled classes/events. 2 Pools, 2 Clubhouises. Minutes to Pompano Beach, Casino, Horseracing, restaurants and shopping. This is a verified 55+ community with a MADATORY 700 credit score. Cash only. No Land Lease. Condo Termite Treated 2023.
Key facts
- $514 HOA
- Parking
- Community pool
Property features AI
Finance
- Other: Allows pets (restrictions possible); Resale property; Senior community
- HOA & community: Monthly association fee of $514; Association includes water, common areas, and golf; Amenities: pool, clubhouse, community room, billiard room, game room, bocce ball, shuffleboard court, golf course, library, sidewalks, storage, manager on site, on-site management
Exterior
- Parking: Assigned parking; 1 open parking space
- Utilities: Public water; Public sewer; Sewer available; Water available
- Home design: Condominium; 2 total stories; North-facing
- Construction: Block and concrete construction; Concrete and tile roof
- Exterior features: Not waterfront
Interior
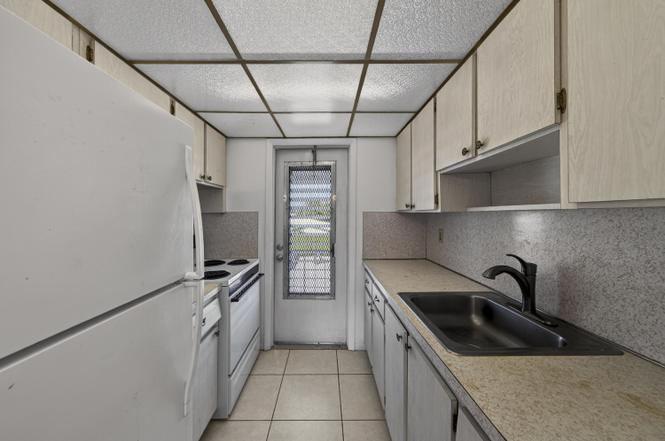
- Kitchen: Electric range; Refrigerator
- Bedrooms: 2 bedrooms on the main level
- Flooring: Carpet; Ceramic tile
- Bathrooms: 2 full bathrooms on the main level
- Heating & cooling: Central individual heating; Central individual cooling
- Interior features: Stacked bedroom layout; Unfurnished
- Laundry & utility: Electric water heater
Neighborhood map
What this means for you Summary
Snapshot
- This is a 2-bed/2.0-bath condo listed at $90k.
Deal economics
- At list price, monthly cash flow is $212 ($3k/yr) — positive.
- The deal already cash-flows at list — no discount required.
- Meets the 1% rule at list price ($2k rent vs $90k).
- Recommended offer: $79k (12.0% below list) — sets the bar for market timing.
- Cap rate 11.2% vs local median 3.1% in Pompano Beach — top-decile yield for the area; either an underpriced asset or a hidden risk that comps aren't pricing in. Stress-test before assuming the spread holds.
Location & tenants
- Location reads 74/100 on livability (#284 in FL, #4,541 nationally) — a middle-class / working-renter tenant base. Strengths: commute A+, housing A+, cost of living B+; Watch: schools D+, employment D+, amenities F.
- Broward (suburban): math 42% / reading 53% proficiency, ranked #46 of 73 in FL (top 63%) — families likely to look elsewhere, expect single-tenant / working-renter base with shorter leases.
- Market conditions: Rents rising (+1.8%/yr); 597 active listings in the ZIP; 40 comparable units currently listed for rent nearby; rentals at typical pace (median 25d on market — plan ~3-4 weeks tenant-placement turnaround); 2,111 units permitted in Broward County in 2024 (1,265 in 5+ unit buildings).
- This rent runs 34% of the median local income ($71k/yr) — at the standard rent-burdened threshold; future hikes will face affordability resistance.
Forward outlook
- Local home prices are declining (-3.0%/yr); year-one equity from $622 of loan paydown is wiped out by about $3k of value loss. Plan a longer hold.
- Broward County population projected at +34% by 2050 — long-run rental-demand tailwind backs the buy-and-hold thesis.
Negotiation context
- It's been on market 159 days — a 12% lower offer ($79k) is reasonable based on typical stale-listing flexibility.
- Current owner paid $16k; list at $90k implies a 473% gain — meaningful room to come down on a strong offer.
Risks & watch-outs
- Watch-outs: property tax is 2.7% of price; flood insurance adds $152/mo; HOA is 26% of rent.
- Climate carrying-cost: in FEMA flood zone AH (mandatory federal flood insurance); severe wind risk, 99% chance of damaging wind over 30y; extreme-heat days projected 3→12/yr by 2055 (HVAC capex compounding) — expect insurance premiums to compound above CPI over the hold.
Questions for the listing agent
- It's been on market 159 days. Have you received any prior offers? Is the seller open to a 12% concession, seller financing, or rate buy-down credit?
- Built in 1971 — when were the roof, HVAC, electrical panel, plumbing, and water heater last replaced?
- Property tax is high relative to price — has the assessment been appealed recently, and will the sale trigger a re-assessment?
- What's the actual annual flood-insurance premium (NFIP or private), and is the property in a SFHA with mandatory coverage?
- What does the HOA fee cover, when was the last increase, and are there any pending special assessments or reserve-fund shortfalls?
- Any open or pending special assessments — roof, HVAC, plumbing, elevator, façade? What's the per-unit balance and payoff schedule, and is the seller paying it off at close or rolling it to the buyer?
- Why hasn't it sold? Are there any deal-killer items the seller is aware of (foundation, flood, title, zoning, code violations)?
- Is there a deadline driving the sale (1031 exchange, divorce, estate, relocation)? That informs how much negotiation room exists.
- Schools are D-rated, which usually means shorter tenancies and higher turnover. Who's the typical renter profile here, and what's been the actual vacancy rate?
- What's the average days-on-market for RENTAL listings here right now (not sales)? A rising rental-DOM trend means longer vacancies and softer asking-rent achievability than the comps imply.
- What's the recent tenant-quality profile in this submarket — average credit score on applications, eviction rate, late-payment / NSF rate, and stable-employment percentage? A property-management company in the area should have these aggregated.
- How much new apartment / multifamily construction is in the pipeline within 1–3 miles? Heavy new supply (>2% of stock underway) typically softens rents 12–24 months out; light construction supports rent growth.
Investment metrics
- 1% rule
- 2.24% ✓
- Cap rate
- 11.16%
- Cash-on-cash
- 17.38%
- DSCR
- 1.77
- GRM
- 3.7
CMA / ARV
No comps found within radius.
Projected returns pro-forma
-3.0% appreciation · 1.75% rent growth · sell at horizon
- IRR
- -3.3%
- Equity multiple
- 0.88×
- Total profit
- $-3,043
- Equity at exit
- $13,404
- IRR
- 4.1%
- Equity multiple
- 1.27×
- Total profit
- $6,776
- Equity at exit
- $7,773
Cash invested: $25,172 (down + closing). Projections, not guarantees.
Landlord ↔ Tenant lean methodology
- Overall (STATE)
- 87 Strongly Landlord-Friendly
- State Florida
- 87 Strongly Landlord-Friendly · R+3
- County
- — inherits STATE
- City
- — inherits STATE
ZIP-level market 33064
- Home prices YoY
- -18.7%
- Rents YoY
- 1.8%
- Active inventory
- 597
- Price-to-rent
- 3.7×
Monthly cashflow live
- Estimated rent
- $2,014 high interval (Pro) →
- Mortgage (P&I)
- −$471
- Tax from tax record
- −$203 /mo · $2,440/yr
- Insurance
- −$37
- Flood insurance flood zone
- −$152 /mo · $1,824/yr
- HOA
- −$514
- Vacancy / Maint / Mgmt
- −$423
- Net cashflow
- $212
Break-even live
Sensitivity live
| Price | -10% $263 | -5% $238 | +0% $212 | +5% $187 | +10% $162 |
|---|---|---|---|---|---|
| Rent | -10% $53 | -5% $133 | +0% $212 | +5% $292 | +10% $372 |
| Rate | -1.0pp $258 | -0.5pp $235 | base $212 | +0.5pp $189 | +1.0pp $165 |
UW: 25.0% down · 7.5% · 30yr · 1.5% tax · 5.0% vac · 8.0% maint · 8.0% mgmt
Financing live
Cash to close
- Down payment
- $22,475
- Closing costs
- $2,697
- Reserves months
- —
- Total cash needed
- —
Loan-product check · same deal, 3 products live
Conventional
25% down · 7.5% · 30yr
- Down + closing
- —
- Monthly P&I
- —
- Monthly cashflow
- —
- DSCR
- —
- Eligible?
- —
Personal DTI + credit; lowest rate.
DSCR
20% down · 8.5% · 30yr
- Down + closing
- —
- Monthly P&I
- —
- Monthly cashflow
- —
- DSCR
- —
- Eligible?
- —
No personal income docs; deal must DSCR.
Hard money
10% down · 12.0% · 12mo
- Down + closing
- —
- Monthly P&I
- —
- Monthly cashflow
- —
- DSCR
- —
- Eligible?
- —
Short-term bridge; refi at stabilization.
Rent comps 40 comps
| Address | Beds | Baths | Sqft | Rent | $/sqft | DOM | Units | Dist |
|---|---|---|---|---|---|---|---|---|
| 2501 W Golf Blvd Pompano Beach, FL | 1.0 | 1.0 | 600 | $1,375 | $2.29 | 25d | 1 | 0.02mi |
| 251 S Golf Blvd #294 Pompano Beach, FL | 2.0 | 2.0 | 825 | $2,100 | $2.55 | 12d | 1 | 0.20mi |
| 251 S Golf Blvd #294 Pompano Beach, FL | 2.0 | 2.0 | 825 | $2,400 | $2.91 | 25d | 1 | 0.20mi |
| 220 Leisure Blvd Pompano Beach, FL | 2.0 | 1.0 | 1046 | $2,200 | $2.10 | 25d | 1 | 0.21mi |
| 201 S Golf Blvd #298 Pompano Beach, FL | 2.0 | 1.0 | 750 | $1,600 | $2.13 | 16d | 1 | 0.27mi |
| 201 S Golf Blvd #2004 Pompano Beach, FL | 2.0 | 1.0 | 820 | $1,700 | $2.07 | 25d | 1 | 0.27mi |
| 2751 E Golf Blvd #2018 Pompano Beach, FL | 2.0 | 2.0 | 825 | $1,800 | $2.18 | 25d | 1 | 0.36mi |
| 3000 NW 5th Ter #129 Pompano Beach, FL | 2.0 | 2.0 | 912 | $2,000 | $2.19 | 25d | 1 | 0.41mi |
| 300 NW 30th Ct #202 Pompano Beach, FL | 1.0 | 1.0 | 633 | $1,650 | $2.61 | 25d | 1 | 0.44mi |
| 3005 NW 5th Ter #2 Pompano Beach, FL | 2.0 | 1.0 | 968 | $2,100 | $2.17 | 25d | 1 | 0.46mi |
| 231 NE 24th St Unit 1 Pompano Beach, FL | 2.0 | 1.0 | 750 | $2,250 | $3.00 | 0d | 1 | 0.60mi |
| 3109 NW 2nd Ter Unit 4-156 Pompano Beach, FL | 1.0 | 1.0 | 680 | $1,600 | $2.35 | 16d | 1 | 0.61mi |
| 3109 NW 2nd Ter Unit 4-156 Pompano Beach, FL | 1.0 | 1.0 | 680 | $1,600 | $2.35 | 25d | 1 | 0.61mi |
| 3050 NW 1st Ave Pompano Beach, FL | 2.0 | 1.0 | 1044 | $1,800 | $1.72 | 25d | 1 | 0.62mi |
| 111 NW 31st Ct Pompano Beach, FL | 2.0 | 1.0 | 874 | $1,995 | $2.28 | 25d | 1 | 0.66mi |
| 2001 NE 2nd Ter Pompano Beach, FL | 3.0 | 2.0 | 999 | $3,000 | $3.00 | 25d | 1 | 0.74mi |
| 401 NW 34th St Pompano Beach, FL | 2.0 | 1.0–1.5 | 704 | $2,294 | $3.26 | 3d | 16 | 0.75mi |
| 250 W Sample Rd Pompano Beach, FL | 1.0–2.0 | 1.0–2.0 | 900 | $2,150 | $2.39 | 25d | 1 | 0.78mi |
| 3550 NW 8th Ave Pompano Beach, FL | 2.0 | 1.5 | 765 | $1,775 | $2.32 | 16d | 4 | 0.79mi |
| 3281 E Golf Blvd #12 Pompano Beach, FL | 2.0 | 1.0 | 1020 | $2,200 | $2.16 | 25d | 1 | 0.81mi |
| 3281 E Golf Blvd #4 Pompano Beach, FL | 2.0 | 1.5 | 1020 | $2,200 | $2.16 | 25d | 1 | 0.82mi |
| 521 NW 35th Ct Unit D Pompano Beach, FL | 1.0 | 1.0 | 600 | $1,525 | $2.54 | 25d | 1 | 0.84mi |
| 1548 NW 3rd Ter Pompano Beach, FL | 2.0 | 1.0 | 576 | $2,050 | $3.56 | 25d | 1 | 0.98mi |
| 555 NW 15th Ct Pompano Beach, FL | 2.0 | 1.0 | 576 | $2,500 | $4.34 | 25d | 1 | 1.05mi |
| 858 Crystal Lake Dr #858 Pompano Beach, FL | 2.0 | 2.0 | 987 | $2,200 | $2.23 | 25d | 1 | 1.06mi |
| 2550 NE 7th Ter Pompano Beach, FL | 2.0 | 1.0 | 893 | $2,445 | $2.74 | 0d | 1 | 1.09mi |
| 3500 Blue Lake Dr #101 Pompano Beach, FL | 1.0 | 1.5 | 850 | $1,900 | $2.24 | 25d | 1 | 1.11mi |
| 3400 Blue Lake Dr Pompano Beach, FL | 2.0 | 2.0 | 1039 | $2,288 | $2.20 | 25d | 2 | 1.11mi |
| 3550 Blue Lake Dr Pompano Beach, FL | 1.0 | 1.5 | 850 | $1,850 | $2.18 | 25d | 1 | 1.14mi |
| 3421 NE 5th Ave Unit A Pompano Beach, FL | 2.0 | 1.0 | 970 | $2,500 | $2.58 | 25d | 1 | 1.14mi |
| 941 Crystal Lake Dr #302 Deerfield Beach, FL | 2.0 | 2.0 | 882 | $1,890 | $2.14 | 16d | 1 | 1.17mi |
| 1100 Crystal Lake Dr #207 Deerfield Beach, FL | 1.0 | 1.0 | 660 | $1,900 | $2.88 | 25d | 1 | 1.18mi |
| 1021 Crystal Lake Dr #203 Deerfield Beach, FL | 2.0 | 2.0 | 890 | $1,800 | $2.02 | 16d | 1 | 1.19mi |
| 1101 Crystal Lake Dr #203 Deerfield Beach, FL | 2.0 | 2.0 | 930 | $2,200 | $2.37 | 25d | 1 | 1.21mi |
| 3901 NW 9th Ave Deerfield Beach, FL | 2.0 | 2.0 | 800 | $1,995 | $2.49 | 25d | 1 | 1.22mi |
| 1309 NW 2nd Ave Unit 3 Pompano Beach, FL | 2.0 | 1.0 | 700 | $1,750 | $2.50 | 25d | 1 | 1.24mi |
| 4061 NW 9th Ave #206 Deerfield Beach, FL | 2.0 | 2.0 | 800 | $1,900 | $2.38 | 25d | 1 | 1.35mi |
| 1101 NE 23rd Pl Unit 1 Pompano Beach, FL | 3.0 | 2.0 | 1117 | $3,000 | $2.69 | 25d | 1 | 1.36mi |
| 216 NW 12th St Unit 1 Pompano Beach, FL | 1.0 | 1.0 | 850 | $1,600 | $1.88 | 25d | 1 | 1.37mi |
| 3910 Crystal Lake Dr #201 Deerfield Beach, FL | 2.0 | 2.0 | 884 | $2,000 | $2.26 | 25d | 1 | 1.38mi |
HOA detail condo
- Monthly dues
- $514 · $6,168/yr
- Likely covers
- pool
- Assessments
- None detected in remarks — confirm with the listing agent.
Listing history 9 events
-
2026-05-20status Pending
-
2026-05-04historical Active Under Contract
-
2026-03-30price $89,900
-
2026-03-19price $99,900
-
2026-02-17price $109,000
-
2026-01-16price $114,000
-
2025-12-12$119,000 Active
-
2025-11-27historical $119,000
-
1971-05-01soldstatus $15,700
ⓘ Source: listings_history table (triggers on properties + properties_extension) + one-shot
backfill from property_details.listing_events for pre-trigger history.
Tax reassessment forecast FL · Resets to sale price
- Current annual tax
- $2,440 · $203/mo
- Projected year-2 tax
- $2,440 · $203/mo
- Expected delta
- $0/yr ($0/mo · 0.0%)
ⓘ Screening estimate from a state-policy table — verify with the county assessor before closing.
Climate risk First Street
- Flood 4/10 Moderate FEMA zone AH · 23% chance over 30 yrs
- Wildfire 1/10 Low
- Heat 9/10 Extreme 3 d/yr ≥106°F today · 12 d/yr by 30 yrs out
- Wind 10/10 Extreme 99% chance of damaging wind over 30 yrs
- Air quality 2/10 Low 1 unhealthy d/yr today · 3 by 30 yrs out
Nearby sold comps map
Loading sold comps map…
Walkable amenities ~0.75 mi
Loading nearby amenities…
Taxation est. · year 1
- Rental income
- $24,163
- − Mortgage interest
- −$5,036
- − Property taxes
- −$2,440
- − Insurance
- −$2,274
- − Repairs & maintenance
- −$1,933
- − Management
- −$1,933
- − HOA
- −$6,168
- − Depreciation
- −$2,615
- Taxable income
- $1,764
- Est. tax owed @ 24.0%
- −$423
- After-tax cash flow
- $2,126/yr
For passive investors: Depreciation is non-cash, so a rental often shows a tax loss while cash-flowing — sheltering income. Rental losses are passive: they offset passive income freely, and up to $25,000/yr can offset ordinary (W-2) income if you actively participate and your MAGI is under $100k (phasing out to $0 by $150k); unused losses carry forward. On sale, claimed depreciation is recaptured at up to 25%, and gains may owe capital-gains tax (a 1031 exchange can defer both). Figures are a year-1 estimate at your 24.0% rate — not tax advice; consult a CPA.
Schools (NCES district)
- District
- Broward
- NCES district ID
- 1200180
- Math proficiency
- 42% ▼ -18.00%
- Reading proficiency
- 53% ▼ -5.00%
- Median HH income
- $52,139
- Composite
- 40.88/100
- National rank
- #3621
- State rank
- #46 of 73 in FL
Livability — Pompano Beach
- Score
- 74/100
- State rank
- #284
- US rank
- #4541
Category grades
Schools grade is shown separately in the Schools card above.
Census & demographics
- Census place
- Pompano Beach, FL
- County
- Broward County · 1,963,430 people
- City population
- 155,861
- Metro
- Miami-Fort Lauderdale-Pompano Beach, FL
- Population (ZIP)
- 64,563
- Household income
- $71,301
- Rent vs Own
- Severe rent burden
- 2907.0
Population outlook (Broward County) Hauer SSP2
- Today (2025)
- 2,207,033 people
- By 2030
- 2,360,704 · +7.0%
- By 2040
- 2,661,208 · +20.6%
- By 2050
- 2,946,698 · +33.5%
- By 2075
- 3,602,273 · +63.2%
- By 2100
- 3,970,984 · +79.9%
Race, ethnicity, and origin ACS 2023
- Neighborhood character
- Highly diverse neighborhood (Simpson 0.75)
- Race & ethnicity
- White 34% Hispanic / Latino 27% Black 25% Two or more races 24% Asian 2%
- Hispanic origin (detail)
- Mexican 4% Puerto Rican 4% Cuban 4% Dominican 2%
- Common ancestry
- Hispanic 13% Estonian 10% Romanian 1%
- Foreign-born
- 43% · Canada, Jamaica, Dominican Republic
- Languages at home
- 45% English-only · Spanish 23% French/Haitian/Cajun 16% Other Indo-European 13%
Political lean MEDSL · Broward
- 2024 margin
- D (+17.0) · D 58.0% · R 41.0%
- 2008→2024 swing
- -17.8pp toward R · 2008: 34.7pp · 2024: 17.0pp
- All cycles
- 2024: D+17.0 2020: D+29.8 2016: D+35.0 2012: D+34.9 2008: D+34.7
Not yet ingested
- Civics
- —
Market trends
- HPI YoY
- ▼ -109.09%
- Current HPI
- 474.7007
- Rent YoY
- ▲ 1.75%
- Metro
- Miami-Fort Lauderdale-Pompano Beach, FL
- State GDP YoY
- ▲ 3.28%
- F500 in state
- 36
Industry mix (Fortune 500 HQ in FL)
| Industry | F500 HQs | Revenue |
|---|---|---|
| Industrial Technology | 2 | $29B |
|
||
| Insurance | 2 | $17B |
|
||
| Retail | 1 | $60B |
|
||
| Technology Distribution | 1 | $58B |
|
||
| Homebuilding | 1 | $35B |
|
||
| Technology Manufacturing | 1 | $35B |
|
||
Price history
+472.6% since first listed9 events — show timeline
- 2026-05-20 Pending — Beaches MLS
- 2026-05-04 Contingent — Beaches MLS
- 2026-03-30 Price Changed $89,900 Beaches MLS
- 2026-03-19 Price Changed $99,900 Beaches MLS
- 2026-02-17 Price Changed $109,000 Beaches MLS
- 2026-01-16 Price Changed $114,000 Beaches MLS
- 2025-12-12 Listed $119,000 Beaches MLS
- 2025-11-27 Coming Soon $119,000 Beaches MLS
- 1971-05-01 Sold (Public Records) $15,700 Public Records
Property tax history
+9.7%/yrLatest (2025): $2,440 · +6.3% YoY. Source: county tax records.
Cash-flow waterfall
monthlySold comps — $/sqft
last 12 mo · ≤1 miLoading sold comps…