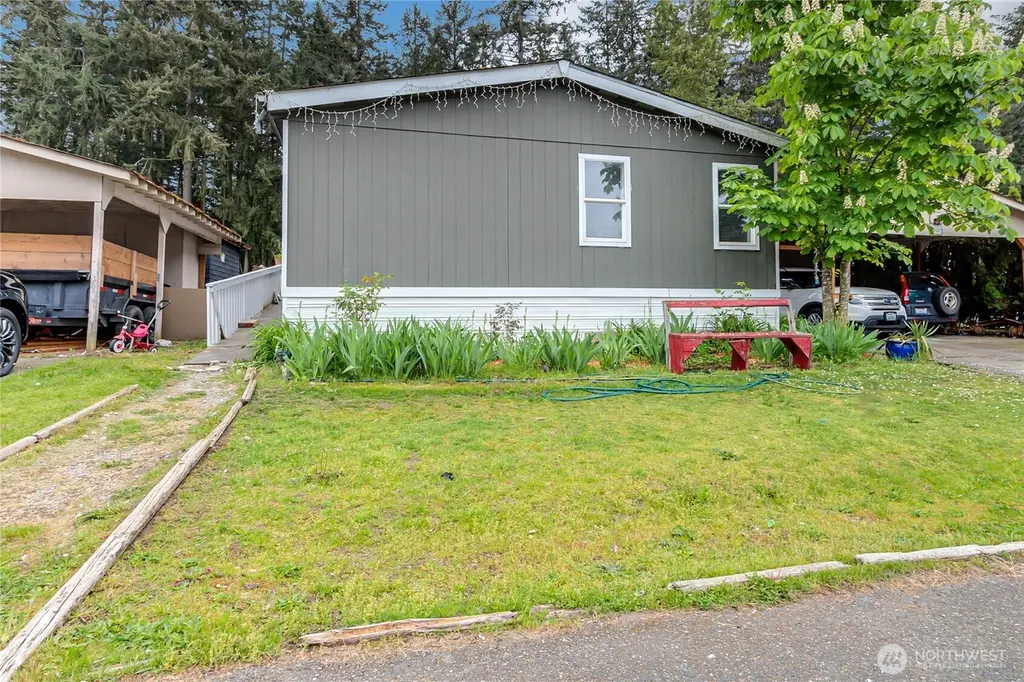
7502 189th Avenue Ct E #9 · Frederickson, WA
Flood risk 1/10 · Minimal
- FEMA flood zone
- X (unshaded)
- Chance of flooding over 30 yrs
- 0.0%
- Est. flood insurance / yr
- $507 – $1,088
Fire risk 1/10 · Minimal
- Est. fire insurance / yr
- $604 – $1,122
Heat risk 3/10 · Minor
- Hot days now (above 87°F)
- 7 days/yr
- Hot days in 30 yrs
- 14 days/yr
Wind risk 1/10 · Minimal
- Chance of severe wind over 30 yrs
- —
Air-quality risk 7/10 · Major
- Unhealthy air days now
- 10 days/yr
- Unhealthy air days in 30 yrs
- 10 days/yr
Risk factors via First Street. Map © Google.
Why this score? — see what drove the B+ grade
The composite is a weighted blend of 9 inputs, each scored 0–100. Each bar is that input's sub-score; the figure is the points it added to the 100-point composite (weight × sub-score).
- Cash flow +30.0/30.0
- ARV discount +11.0/15.0
- 1% rule +10.0/10.0
- DSCR +10.0/10.0
- Schools +4.9/10.0
- Livability +3.7/5.0
- Rent growth +3.2/5.0
- Condition / age +2.5/5.0
- Appreciation +0.0/10.0
$149,900
🖨 Deal sheet (PDF) 📄 Offer letter ✓ Due diligence
Listing remarks
Charming Mobile home in all-age Woodland Estate MH Park! This 1994 home offers 1620 sq/ft, 4 beds, and 2 bathrooms and has been very well taken care of. An extended kitchen area to the dining room and lots of cabinet space, and new quartz countertops. The spacious living room opens to the dining room. Large main bedroom with bathroom and walk-in closet, and 3 more good-sized bedrooms. New waterproof laminated flooring throughout the house and bedrooms. Large backyard for entertaining or gardening. The property offers 4 parking spaces on the side of the home. Enjoy comfortable living with an open-concept layout, spacious bedrooms, and abundant natural light throughout. Conveniently located n
Key facts
- 4 parking spots
- Built 1994
- Listed 44 days
Property features AI
Finance
- Other: Mobile home remains on site
- Financial info: Land lease amount applies ($1,350); Acceptable financing: Cash or conventional
- HOA & community: Located in Woodland Estate MH Park (park-approved for sale); Approximately 51 homes in the park; Pets allowed: Dogs and cats; Park amenities include recreational area
Exterior
- Parking: Carport; Uncovered parking; RV parking available in park
- Utilities: Public water (included in park bill); Sewer included in park bill; Electric power (PSE); Energy sources: Electric and wood
- Home design: Manufactured double-wide home (GLEN OAKS model by LIBER); One level; East facing
- Construction: Wood construction materials; Composition roof; Tie-down foundation; Manufactured after 6/15/1976
- Exterior features: Wood products siding; Patio/porch/deck; Dead-end street; Open space; Paved
Interior
- Kitchen: Dishwasher; Refrigerator; Stove/Range; Kitchen with eating space; Dining room
- Bedrooms: 4 bedrooms
- Flooring: Laminate
- Bathrooms: 2 full bathrooms; 2 bathtubs; 2 showers; Primary bathroom with bath off primary
- Heating & cooling: Forced air heating; No central cooling; Ceiling fan(s)
- Interior features: Fireplace (wood burning); Water heater (tank)
- Laundry & utility: Utility room (water heater located here); Utility room
Neighborhood map
What this means for you Summary
Snapshot
- This is a 3-bed/2.0-bath manufactured listed at $150k.
Deal economics
- At list price, monthly cash flow is $1k ($16k/yr) — positive.
- The deal already cash-flows at list — no discount required.
- Meets the 1% rule at list price ($3k rent vs $150k).
- Recommended offer: $145k (3.0% below list) — sets the bar for market timing.
- Cap rate 16.9% vs local median 3.5% in Frederickson — top-decile yield for the area; either an underpriced asset or a hidden risk that comps aren't pricing in. Stress-test before assuming the spread holds.
Location & tenants
- Location reads 73/100 on livability (#197 in WA) — a middle-class / working-renter tenant base. Strengths: employment A+, housing A+, health & safety A+; Watch: crime D+, amenities D-, commute F.
- Bethel School District (suburban): math 47% / reading 59% proficiency, ranked #103 of 291 in WA (top 35%) — acceptable for families but not a draw, mixed tenant base, ~2y average lease.
- Zoned schools: Elk Plain School of Choice (570 students, 39% FRL); Liberty Middle School (936 students, 55% FRL); Graham Kapowsin High School (2,011 students, 49% FRL).
- Market conditions: Rents rising (+2.8%/yr); 285 active listings in the ZIP; 11 comparable units currently listed for rent nearby; rentals at typical pace (median 20d on market — plan ~3-4 weeks tenant-placement turnaround); high-income renter base; 3,209 units permitted in Pierce County in 2024 (1,269 in 5+ unit buildings).
Forward outlook
- Local home prices are declining (-3.0%/yr); year-one equity from $1k of loan paydown is wiped out by about $4k of value loss. Plan a longer hold.
- Pierce County population projected at +26% by 2050 — long-run rental-demand tailwind backs the buy-and-hold thesis.
- At projected returns (-3.0% appreciation + 2.8% rent growth), your $42k cash investment doubles in ~4 years — after that, you're playing with house money.
Negotiation context
- It's been on market 44 days — a 3% lower offer ($145k) is reasonable based on typical stale-listing flexibility.
Questions for the listing agent
- It's been on market 44 days. Have you received any prior offers? Is the seller open to a 3% concession, seller financing, or rate buy-down credit?
- Is there a deadline driving the sale (1031 exchange, divorce, estate, relocation)? That informs how much negotiation room exists.
- Schools are F-rated, which usually means shorter tenancies and higher turnover. Who's the typical renter profile here, and what's been the actual vacancy rate?
- Crime grade is D in this area — have there been break-ins, vandalism, or insurance claims at this property in the last 3 years? What carrier currently insures it and at what premium?
- What's the average days-on-market for RENTAL listings here right now (not sales)? A rising rental-DOM trend means longer vacancies and softer asking-rent achievability than the comps imply.
- What's the recent tenant-quality profile in this submarket — average credit score on applications, eviction rate, late-payment / NSF rate, and stable-employment percentage? A property-management company in the area should have these aggregated.
- How much new for-sale + rental construction is in the pipeline within 1–3 miles? Heavy new supply typically softens prices + rents 12–24 months out; constrained supply supports both.
Investment metrics
- 1% rule
- 1.92% ✓
- Cap rate
- 16.93%
- Cash-on-cash
- 37.97%
- DSCR
- 2.69
- GRM
- 4.3
CMA / ARV
- ARV (on-the-fly)
- $162,408
- Comps found
- 12
Show comp detail 12 sales within ~0.75 mi
| Address | Dist | Beds/Ba | Sqft | Sold | Price | $/sf | Match |
|---|---|---|---|---|---|---|---|
| 7508 189th St Ct E #15 | 0.03mi | 3/2.0 | 1,432 (-11%) | 12mo | $50,000 | $35 | 70 |
| 7503 189th Street Ct E #12 | 0.03mi | 4/2.0 (+1) | 1,440 (-10%) | 11mo | $75,000 | $52 | 67 |
| 7425 188th Street Ct E #28 | 0.09mi | 3/2.0 | 1,404 (-13%) | 13mo | $90,000 | $64 | 64 |
| 8009 195th St E #89 | 0.44mi | 3/2.0 | 1,772 (+10%) | 5mo | $125,000 | $71 | 58 |
| 8102 195th St E #95 | 0.43mi | 3/2.0 | 1,778 (+11%) | 5mo | $180,000 | $101 | 58 |
| 8004 192nd Street Ct E #10 | 0.38mi | 4/2.0 (+1) | 1,782 (+11%) | 11mo | $230,000 | $129 | 50 |
| 8215 192nd Street Ct E #34 | 0.51mi | 4/2.0 (+1) | 1,782 (+11%) | 4mo | $190,000 | $107 | 50 |
| 7218 191st Street Ct E | 0.20mi | 4/2.0 (+1) | 1,848 (+15%) | 14mo | $480,000 | $260 | 50 |
| 19801 67th Ave E | 0.73mi | 3/2.0 | 1,435 (-11%) | 1mo | $440,000 | $307 | 47 |
| 8104 194th St E #51 | 0.47mi | 4/2.0 (+1) | 1,778 (+11%) | 15mo | $145,000 | $82 | 43 |
| 20001 69th Avenue Ct E | 0.71mi | 3/2.0 | 1,387 (-14%) | 3mo | $441,450 | $318 | 42 |
| 8417 195th St E #121 | 0.68mi | 4/2.0 (+1) | 1,782 (+11%) | 16mo | $175,000 | $98 | 32 |
Match score weights: distance 35% · size 25% · config 20% · recency 20%. Top-matched comps best support the ARV.
Projected returns pro-forma
-3.0% appreciation · 2.79% rent growth · sell at horizon
- IRR
- 33.8%
- Equity multiple
- 2.42×
- Total profit
- $59,686
- Equity at exit
- $22,351
- IRR
- 40.6%
- Equity multiple
- 4.77×
- Total profit
- $158,380
- Equity at exit
- $12,961
Cash invested: $41,972 (down + closing). Projections, not guarantees.
Landlord ↔ Tenant lean methodology
- Overall (STATE)
- 28 Tenant-Leaning
- State Washington
- 28 Tenant-Leaning · D+8
- County
- — inherits STATE
- City
- — inherits STATE
ZIP-level market 98375
- Rents YoY
- 2.8%
- Active inventory
- 285
- Price-to-rent
- 4.3×
Monthly cashflow live
- Estimated rent
- $2,884 high interval (Pro) →
- Mortgage (P&I)
- −$786
- Tax from tax record
- −$102 /mo · $1,223/yr
- Insurance
- −$62
- HOA
- −$0
- Vacancy / Maint / Mgmt
- −$606
- Net cashflow
- $1,328
Break-even live
Sensitivity live
| Price | -10% $1,413 | -5% $1,371 | +0% $1,328 | +5% $1,286 | +10% $1,243 |
|---|---|---|---|---|---|
| Rent | -10% $1,100 | -5% $1,214 | +0% $1,328 | +5% $1,442 | +10% $1,556 |
| Rate | -1.0pp $1,404 | -0.5pp $1,366 | base $1,328 | +0.5pp $1,289 | +1.0pp $1,250 |
UW: 25.0% down · 7.5% · 30yr · 1.5% tax · 5.0% vac · 8.0% maint · 8.0% mgmt
Financing live
Cash to close
- Down payment
- $37,475
- Closing costs
- $4,497
- Reserves months
- —
- Total cash needed
- —
Loan-product check · same deal, 3 products live
Conventional
25% down · 7.5% · 30yr
- Down + closing
- —
- Monthly P&I
- —
- Monthly cashflow
- —
- DSCR
- —
- Eligible?
- —
Personal DTI + credit; lowest rate.
DSCR
20% down · 8.5% · 30yr
- Down + closing
- —
- Monthly P&I
- —
- Monthly cashflow
- —
- DSCR
- —
- Eligible?
- —
No personal income docs; deal must DSCR.
Hard money
10% down · 12.0% · 12mo
- Down + closing
- —
- Monthly P&I
- —
- Monthly cashflow
- —
- DSCR
- —
- Eligible?
- —
Short-term bridge; refi at stabilization.
Rent comps 11 comps
| Address | Beds | Baths | Sqft | Rent | $/sqft | DOM | Units | Dist |
|---|---|---|---|---|---|---|---|---|
| 17814 75th Ave E Puyallup, WA | 2.0 | 1.5 | 1064 | $2,295 | $2.16 | 22d | 1 | 0.68mi |
| 17908 72nd Ave E Puyallup, WA | 3.0 | 2.5 | 1719 | $1,400 | $0.81 | 26d | 1 | 0.68mi |
| 19605 84th Ave E Spanaway, WA | 3.0 | 2.5 | 1916 | $3,050 | $1.59 | 26d | 1 | 0.72mi |
| 20121 70th Ave E Spanaway, WA | 4.0 | 3.0 | 1680 | $2,950 | $1.76 | 1d | 1 | 0.78mi |
| 7343 177th St E Puyallup, WA | 3.0 | 3.0 | 1962 | $2,795 | $1.42 | 24d | 1 | 0.81mi |
| 7513 177th Street Ct E Puyallup, WA | 1.0–4.0 | 1.0–2.5 | 1243 | $2,940 | $2.37 | 12d | 7 | 0.81mi |
| 20519 80th Ave E Spanaway, WA | 4.0 | 2.5 | 2031 | $2,925 | $1.44 | 7d | 1 | 1.03mi |
| 8345 175th Street Ct E Puyallup, WA | 2.0 | 2.5 | 1588 | $2,300 | $1.45 | 14d | 1 | 1.07mi |
| 20624 74th Ave E Spanaway, WA | 4.0 | 2.5 | 2197 | $1,400 | $0.64 | 1d | 1 | 1.07mi |
| 18317 96th Ave E Puyallup, WA | 4.0 | 2.5 | 2150 | $5,500 | $2.56 | 46d | 1 | 1.40mi |
| 18511 97th Ave E Puyallup, WA | 3.0 | 2.5 | 2104 | $2,895 | $1.38 | 20d | 1 | 1.43mi |
Listing history 16 events
-
2026-06-21days on market $149,900 Active 44 DOM
-
2026-06-18days on market $149,900 Active 41 DOM
-
2026-06-17days on market $149,900 Active 40 DOM
-
2026-06-16days on market $149,900 Active 39 DOM
-
2026-06-15days on market $149,900 Active 38 DOM
-
2026-06-13days on market $149,900 Active 36 DOM
-
2026-06-13days on market $149,900 Active 35 DOM
-
2026-06-09days on market $149,900 Active 32 DOM
-
2026-06-08days on market $149,900 Active 31 DOM
-
2026-06-07days on market $149,900 Active 30 DOM
-
2026-06-04days on market $149,900 Active 27 DOM
-
2026-06-03days on market $149,900 Active 26 DOM
-
2026-06-02days on market $149,900 Active 25 DOM
-
2026-06-01days on market $149,900 Active 24 DOM
-
2026-05-31days on market $149,900 Active 23 DOM
-
2026-05-08$149,900 Active
ⓘ Source: listings_history table (triggers on properties + properties_extension) + one-shot
backfill from property_details.listing_events for pre-trigger history.
Tax reassessment forecast WA · Resets to sale price
- Current annual tax
- $1,223 · $102/mo
- Projected year-2 tax
- $1,469 · $122/mo
- Expected delta
- +$246/yr (+$20/mo · 20.1%)
ⓘ Screening estimate from a state-policy table — verify with the county assessor before closing.
Climate risk First Street
- Flood 1/10 Low FEMA zone X (unshaded) · 0% chance over 30 yrs
- Wildfire 1/10 Low
- Heat 3/10 Moderate 7 d/yr ≥87°F today · 14 d/yr by 30 yrs out
- Wind 1/10 Low
- Air quality 7/10 Severe 10 unhealthy d/yr today · 10 by 30 yrs out
Nearby sold comps map
Loading sold comps map…
Walkable amenities ~0.75 mi
Loading nearby amenities…
Taxation est. · year 1
- Rental income
- $34,613
- − Mortgage interest
- −$8,397
- − Property taxes
- −$1,223
- − Insurance
- −$750
- − Repairs & maintenance
- −$2,769
- − Management
- −$2,769
- − Depreciation
- −$4,361
- Taxable income
- $14,345
- Est. tax owed @ 24.0%
- −$3,443
- After-tax cash flow
- $12,496/yr
For passive investors: Depreciation is non-cash, so a rental often shows a tax loss while cash-flowing — sheltering income. Rental losses are passive: they offset passive income freely, and up to $25,000/yr can offset ordinary (W-2) income if you actively participate and your MAGI is under $100k (phasing out to $0 by $150k); unused losses carry forward. On sale, claimed depreciation is recaptured at up to 25%, and gains may owe capital-gains tax (a 1031 exchange can defer both). Figures are a year-1 estimate at your 24.0% rate — not tax advice; consult a CPA.
Schools (NCES district)
- District
- Bethel School District
- NCES district ID
- 5300480
- Math proficiency
- 47% ▬ 0.00%
- Reading proficiency
- 59% ▲ 2.00%
- Median HH income
- $65,872
- Composite
- 48.66/100
- National rank
- #4568
- State rank
- #103 of 291 in WA
Livability — Frederickson
- Score
- 73/100
- State rank
- #197
- US rank
- #5426
Category grades
Schools grade is shown separately in the Schools card above.
Census & demographics
- Census place
- Frederickson, WA
- County
- Pierce County · 788,257 people
- City population
- 32,195
- Metro
- Seattle-Tacoma-Bellevue, WA
- Population (ZIP)
- 31,187
- Household income
- $117,074
- Rent vs Own
- Severe rent burden
- 541.0
Population outlook (Pierce County) Hauer SSP2
- Today (2025)
- 956,648 people
- By 2030
- 1,010,862 · +5.7%
- By 2040
- 1,113,170 · +16.4%
- By 2050
- 1,206,524 · +26.1%
- By 2075
- 1,436,425 · +50.2%
- By 2100
- 1,563,654 · +63.5%
Race, ethnicity, and origin ACS 2023
- Neighborhood character
- Diverse neighborhood (Simpson 0.64)
- Race & ethnicity
- White 57% Two or more races 22% Hispanic / Latino 13% Black 8% Asian 6% Pacific Islander 1%
- Hispanic origin (detail)
- Mexican 10% Puerto Rican 1%
- Common ancestry
- Portuguese 3% Lithuanian 3% Italian 3%
- Foreign-born
- 11% · Canada, China, South Korea
- Languages at home
- 82% English-only · Spanish 8% Other Indo-European 2% Other Asian/Pacific 2%
Political lean MEDSL · Pierce
- 2024 margin
- D (+10.8) · D 53.9% · R 43.1% · Other 3.0%
- 2008→2024 swing
- -1.4pp toward R · 2008: 12.2pp · 2024: 10.8pp
- All cycles
- 2024: D+10.8 2020: D+11.2 2016: D+7.5 2012: D+11.0 2008: D+12.2
Not yet ingested
- Civics
- —
Market trends
- HPI YoY
- ▼ -189.98%
- Current HPI
- 285.0074
- Rent YoY
- ▲ 2.79%
- Metro
- Seattle-Tacoma-Bellevue, WA
- State GDP YoY
- ▲ 4.65%
- F500 in state
- 22
Industry mix (Fortune 500 HQ in WA)
| Industry | F500 HQs | Revenue |
|---|---|---|
| Retail | 2 | $269B |
|
||
| Technology / Retail | 1 | $638B |
|
||
| Technology | 1 | $245B |
|
||
| Telecommunications | 1 | $38B |
|
||
| Food / Beverage | 1 | $36B |
|
||
| Automotive / Trucks | 1 | $34B |
|
||
Price history
1 event — show timeline
- 2026-05-08 Listed $149,900 NWMLS as Distributed by MLS Grid
Property tax history
+6.9%/yrLatest (2026): $1,223 · +6.6% YoY. Source: county tax records.
Cash-flow waterfall
monthlySold comps — $/sqft
last 12 mo · ≤1 miLoading sold comps…