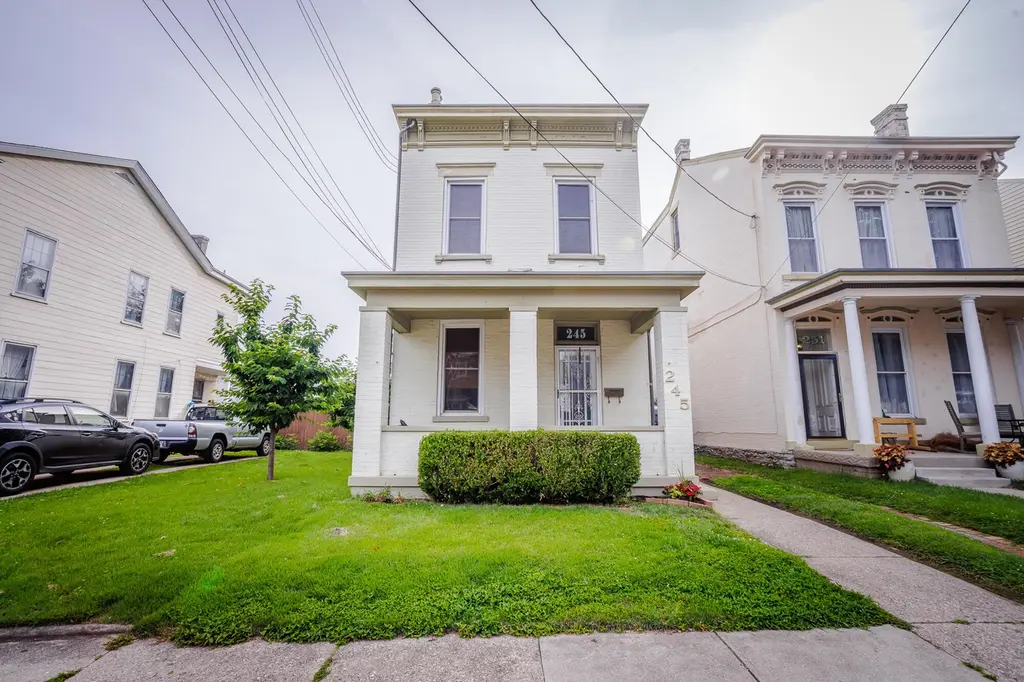
245 Berry Ave · Bellevue, KY
Flood risk 1/10 · Minimal
- FEMA flood zone
- X (unshaded)
- Chance of flooding over 30 yrs
- 0.0%
- Est. flood insurance / yr
- $507 – $1,088
Fire risk 1/10 · Minimal
- Est. fire insurance / yr
- $839 – $1,559
Heat risk 5/10 · Moderate
- Hot days now (above 103°F)
- 7 days/yr
- Hot days in 30 yrs
- 19 days/yr
Wind risk 2/10 · Minimal
- Chance of severe wind over 30 yrs
- 1.0%
Air-quality risk 3/10 · Minor
- Unhealthy air days now
- 2 days/yr
- Unhealthy air days in 30 yrs
- 3 days/yr
Risk factors via First Street. Map © Google.
Why this score? — see what drove the C+ grade
The composite is a weighted blend of 9 inputs, each scored 0–100. Each bar is that input's sub-score; the figure is the points it added to the 100-point composite (weight × sub-score).
- Cash flow +23.8/30.0
- ARV discount +15.0/15.0
- DSCR +7.7/10.0
- 1% rule +5.5/10.0
- Livability +4.6/5.0
- Rent growth +2.5/5.0
- Condition / age +2.5/5.0
- Schools +2.2/10.0
- Appreciation +0.0/10.0
$275,000
🖨 Deal sheet (PDF) 📄 Offer letter ✓ Due diligence
Listing remarks
Charming Bellevue home just 1.5 blocks from the restaurants, shops, and nightlife of Fairfield Ave! This 3-4 bedroom, 2 full bath home offers fresh paint throughout and brand-new carpet upstairs. Flexible floor plan provides space for an office, guest room, or additional bedroom. Enjoy a fenced backyard, off-street parking, garage for storage and classic character throughout. Major updates include a new water heater (2025) and updated box gutters (2018) new carpet (2026) and fresh paint (2026). Convenient location minutes to the highway. Close to everything Bellevue has to offer while still tucked into a residential setting. Home is being sold as-is.
Key facts
- Flexible floor plan
- Garage for storage
- Convenient location
Tags
Property features AI
Exterior
- Parking: Driveway; Off-street parking
- Utilities: Public water; Public sewer
- Home design: Single-family house; Two levels; Built in 1880
- Construction: Brick construction; Membrane roof; Stone foundation
- Exterior features: Covered porch; Private yard; Privacy wood fencing; Shed(s)
Interior
- Kitchen: Electric range; Microwave; Refrigerator; Eat-in kitchen
- Bedrooms: Primary bedroom (15.1 x 10.6); Bedroom 2 — pass-through bedroom (16 x 14); Bedroom 3 (15.4 x 16.1)
- Bathrooms: 2 full bathrooms; Primary bath (5.1 x 8.1); Bathroom 2 (4.11 x 9.8)
- Heating & cooling: Central air conditioning; Forced air heating
- Interior features: Barn doors; Eat-in kitchen; Crown molding; Chandelier; Built-in features; High ceilings; Multi-panel doors; Natural woodwork; Dehumidifier
- Laundry & utility: Washer; Dryer; Laundry in basement
Neighborhood map
What this means for you Summary
Snapshot
- This is a 3-bed/2.0-bath single-family listed at $275k.
Deal economics
- At list price, monthly cash flow is $531 ($6k/yr) — positive.
- The deal already cash-flows at list — no discount required.
- Meets the 1% rule at list price ($3k rent vs $275k).
- Cap rate 8.6% vs local median 4.5% in Bellevue — top-decile yield for the area; either an underpriced asset or a hidden risk that comps aren't pricing in. Stress-test before assuming the spread holds.
Location & tenants
- Location reads 92/100 on livability (#8 in KY, #24 nationally) — a professional / high-income tenant draw. Strengths: crime A+, amenities A+, commute A+.
- Bellevue Independent (suburban): math 17% / reading 33% proficiency, ranked #136 of 165 in KY (top 82%) — low school quality limits family demand, transient renter base, plan for 1-2y turnover.
- Zoned schools: Grandview Elementary School (math 8% / reading 32%, grade F, #568 of 676 statewide, top 84%, 277 students, 65% FRL); Bellevue High School (math 22% / reading 32%, grade F, #158 of 254 statewide, top 68%, 362 students, 61% FRL).
- Market conditions: Rents flat; 49 active listings in the ZIP; 35 comparable units currently listed for rent nearby; rentals leasing fast (median 0d on market — plan ~1-2 weeks tenant-placement turnaround); 247 units permitted in Campbell County in 2024 (77 in 5+ unit buildings).
- At $2,877/mo this rent would consume 49% of the median local household income ($71k/yr) (locally 173% of renters already pay >50% of income on rent) — very limited rent-growth headroom before tenants either downsize or default.
Forward outlook
- Local home prices are declining (-3.0%/yr); year-one equity from $2k of loan paydown is wiped out by about $8k of value loss. Plan a longer hold.
Negotiation context
- Only 1 days on market — expect competitive offers; lowballing is unlikely to land.
Risks & watch-outs
- Watch-outs: built in 1880 — expect roof / HVAC / electrical / plumbing capex.
- Climate carrying-cost: extreme-heat days projected 7→19/yr by 2055 (HVAC capex compounding) — expect insurance premiums to compound above CPI over the hold.
Questions for the listing agent
- Built in 1880 — when were the roof, HVAC, electrical panel, plumbing, and water heater last replaced?
- Is there a deadline driving the sale (1031 exchange, divorce, estate, relocation)? That informs how much negotiation room exists.
- What's the average days-on-market for RENTAL listings here right now (not sales)? A rising rental-DOM trend means longer vacancies and softer asking-rent achievability than the comps imply.
- What's the recent tenant-quality profile in this submarket — average credit score on applications, eviction rate, late-payment / NSF rate, and stable-employment percentage? A property-management company in the area should have these aggregated.
- How much new for-sale + rental construction is in the pipeline within 1–3 miles? Heavy new supply typically softens prices + rents 12–24 months out; constrained supply supports both.
Investment metrics
- 1% rule
- 1.05% ✓
- Cap rate
- 8.61%
- Cash-on-cash
- 8.27%
- DSCR
- 1.37
- GRM
- 8.0
CMA / ARV
- ARV (on-the-fly)
- $390,744
- Comps found
- 12
Show comp detail 12 sales within ~0.75 mi
| Address | Dist | Beds/Ba | Sqft | Sold | Price | $/sf | Match |
|---|---|---|---|---|---|---|---|
| 220 Berry Ave | 0.05mi | 3/2.0 | 1,812 (-7%) | 1mo | $385,000 | $212 | 85 |
| 335 Berry Ave | 0.09mi | 4/2.5 (+1) | 1,984 (+2%) | 1mo | $399,000 | $201 | 85 |
| 144 Fairfield Ave | 0.10mi | 3/2.5 | 2,016 (+4%) | 4mo | $385,000 | $191 | 84 |
| 443 Washington Ave | 0.34mi | 3/2.0 | 1,974 (+2%) | 2mo | $185,000 | $94 | 80 |
| 341 Eden Ave | 0.31mi | 3/1.5 | 1,990 (+2%) | 2mo | $320,000 | $161 | 78 |
| 228 Center St | 0.19mi | 3/2.0 | 1,776 (-9%) | 1mo | $325,000 | $183 | 76 |
| 605 Linden Ave | 0.55mi | 4/2.5 (+1) | 2,008 (+3%) | 2mo | $572,000 | $285 | 61 |
| 530 Lexington Ave | 0.54mi | 3/2.5 | 2,122 (+9%) | 0mo | $600,000 | $283 | 57 |
| 1220 Third St | 0.60mi | 2/2.0 (-1) | 1,833 (-6%) | 0mo | $265,758 | $145 | 57 |
| 562 E 4th St E | 0.49mi | 3/1.5 | 1,680 (-14%) | 2mo | $462,425 | $275 | 51 |
| 326 5th Ave | 0.71mi | 4/2.0 (+1) | 1,785 (-8%) | 4mo | $348,000 | $195 | 45 |
| 1005 Parkside Pl | 0.72mi | 4/2.5 (+1) | 1,764 (-9%) | 4mo | $550,000 | $312 | 41 |
Match score weights: distance 35% · size 25% · config 20% · recency 20%. Top-matched comps best support the ARV.
Projected returns pro-forma
-3.0% appreciation · 0.19% rent growth · sell at horizon
- IRR
- -6.8%
- Equity multiple
- 0.76×
- Total profit
- $-18,740
- Equity at exit
- $41,003
- IRR
- -0.8%
- Equity multiple
- 0.95×
- Total profit
- $-3,723
- Equity at exit
- $23,777
Cash invested: $77,000 (down + closing). Projections, not guarantees.
Landlord ↔ Tenant lean methodology
- Overall (STATE)
- 83 Strongly Landlord-Friendly
- State Kentucky
- 83 Strongly Landlord-Friendly · R+16
- County
- — inherits STATE
- City
- — inherits STATE
ZIP-level market 41073
- Rents YoY
- 0.2%
- Active inventory
- 49
- Price-to-rent
- 8.0×
Monthly cashflow live
- Estimated rent
- $2,877 high interval (Pro) →
- Mortgage (P&I)
- −$1,442
- Tax from tax record
- −$186 /mo · $2,229/yr
- Insurance
- −$115
- HOA
- −$0
- Lot rent
- −$0
- Vacancy / Maint / Mgmt
- −$604
- Net cashflow
- $531
Break-even live
Sensitivity live
| Price | -10% $686 | -5% $608 | +0% $531 | +5% $453 | +10% $375 |
|---|---|---|---|---|---|
| Rent | -10% $303 | -5% $417 | +0% $531 | +5% $644 | +10% $758 |
| Rate | -1.0pp $669 | -0.5pp $600 | base $531 | +0.5pp $459 | +1.0pp $387 |
UW: 25.0% down · 7.5% · 30yr · 1.5% tax · 5.0% vac · 8.0% maint · 8.0% mgmt
Financing live
Cash to close
- Down payment
- $68,750
- Closing costs
- $8,250
- Reserves months
- —
- Total cash needed
- —
Loan-product check · same deal, 3 products live
Conventional
25% down · 7.5% · 30yr
- Down + closing
- —
- Monthly P&I
- —
- Monthly cashflow
- —
- DSCR
- —
- Eligible?
- —
Personal DTI + credit; lowest rate.
DSCR
20% down · 8.5% · 30yr
- Down + closing
- —
- Monthly P&I
- —
- Monthly cashflow
- —
- DSCR
- —
- Eligible?
- —
No personal income docs; deal must DSCR.
Hard money
10% down · 12.0% · 12mo
- Down + closing
- —
- Monthly P&I
- —
- Monthly cashflow
- —
- DSCR
- —
- Eligible?
- —
Short-term bridge; refi at stabilization.
Rent comps 35 comps
| Address | Beds | Baths | Sqft | Rent | $/sqft | DOM | Units | Dist |
|---|---|---|---|---|---|---|---|---|
| 236 Ward Ave Bellevue, KY | 3.0 | 2.0 | 1500 | $2,585 | $1.72 | 14d | 1 | 0.33mi |
| 118 Beech St Newport, KY | 3.0 | 2.0 | 1610 | $2,400 | $1.49 | 0d | 1 | 0.41mi |
| 327 Covert Run Pike Unit 1 Bellevue, KY | 2.0 | 2.0 | 1580 | $1,850 | $1.17 | 26d | 1 | 0.47mi |
| 100 Aqua Way Newport, KY | 1.0–3.0 | 1.0–2.0 | 1092 | $3,850 | $3.53 | 0d | 5 | 0.74mi |
| 1055 St Paul Pl Cincinnati, OH | 3.0 | 1.0–2.0 | 975 | $2,995 | $3.07 | 0d | 10 | 0.87mi |
| 814 Washington Ave Unit 2 Newport, KY | 2.0 | 2.0 | 1450 | $1,500 | $1.03 | 26d | 1 | 0.90mi |
| 923 Paradrome St Cincinnati, OH | 3.0 | 2.5 | 2098 | $3,000 | $1.43 | 26d | 1 | 0.91mi |
| 929 Boone St Newport, KY | 2.0 | 2.0 | 1458 | $1,495 | $1.03 | 46d | 1 | 0.91mi |
| 601 E Pete Rose Way Cincinnati, OH | 3.0 | 1.0–2.5 | 1039 | $2,966 | $2.85 | 0d | 30 | 0.92mi |
| 1287 Ida St Cincinnati, OH | 3.0 | 2.5 | 2494 | $4,700 | $1.88 | 19d | 1 | 1.01mi |
| 621 E Mehring Way Cincinnati, OH | 1.0–2.0 | 1.0–2.0 | 1082 | $2,674 | $2.47 | 0d | 19 | 1.03mi |
| 1044 Washington Ave #2 Newport, KY | 2.0 | 2.0 | 1250 | $1,800 | $1.44 | 46d | 1 | 1.09mi |
| 345 E 7th St Cincinnati, OH | 2.0 | 1.0–2.0 | 1184 | $4,300 | $3.63 | 0d | 16 | 1.26mi |
| 203 W 8th St Newport, KY | 2.0 | 1.5 | 1456 | $2,300 | $1.58 | 0d | 1 | 1.27mi |
| 2132 Gilbert Ave Unit A Cincinnati, OH | 2.0 | 2.5 | 1450 | $2,250 | $1.55 | 6d | 1 | 1.28mi |
| 2132 Gilbert Ave Unit A Cincinnati, OH | 2.0 | 2.5 | 1450 | $2,250 | $1.55 | 0d | 1 | 1.28mi |
| 516 E 12th St Unit 1314562P Cincinnati, OH | 4.0 | 2.0 | 2023 | $10,170 | $5.03 | 26d | 1 | 1.28mi |
| 634 Sycamore St Cincinnati, OH | 2.0 | 1.0–1.5 | 1261 | $2,615 | $2.07 | 6d | 9 | 1.32mi |
| 809 Isabella St Newport, KY | 2.0 | 2.0 | 1519 | $2,200 | $1.45 | 46d | 1 | 1.34mi |
| 224 E 8th St Cincinnati, OH | 1.0–3.0 | 1.0–2.0 | 1255 | $2,595 | $2.07 | 0d | 6 | 1.39mi |
| 2331 Park Ave Unit 1 Cincinnati, OH | 3.0 | 2.5 | 2200 | $2,350 | $1.07 | 0d | 1 | 1.41mi |
| 918 Windsor St Cincinnati, OH | 3.0 | 1.0 | 2583 | $1,675 | $0.65 | 26d | 1 | 1.41mi |
| 1304 Broadway Unit 1056129P Cincinnati, OH | 1.0–5.0 | 1.0–4.0 | 2072 | $6,032 | $2.91 | 0d | 3 | 1.41mi |
| 400 E 13th St Unit 1056131P Cincinnati, OH | 1.0–3.0 | 1.0–2.0 | 2018 | $5,377 | $2.66 | 0d | 3 | 1.41mi |
| 1118 Sycamore St Cincinnati, OH | 2.0 | 1.0–2.0 | 891 | $3,194 | $3.58 | 0d | 25 | 1.44mi |
| 721 Main St Cincinnati, OH | 2.0 | 1.0–2.0 | 991 | $3,205 | $3.23 | 0d | 14 | 1.44mi |
| 1326 Broadway Unit 1324946P Cincinnati, OH | 1.0–3.0 | 1.0–3.0 | 1162 | $6,202 | $5.34 | 0d | 3 | 1.44mi |
| 923 Rogers Pl Cincinnati, OH | 3.0 | 1.0 | 2061 | $1,600 | $0.78 | 26d | 1 | 1.45mi |
| 424 Liberty Hl Unit 1056033P Cincinnati, OH | 3.0 | 2.0 | 1453 | $5,747 | $3.96 | 0d | 1 | 1.45mi |
| 121 E Freedom Way Cincinnati, OH | 2.0 | 1.0–2.0 | 988 | $2,999 | $3.03 | 0d | 29 | 1.45mi |
| 580 Walnut St Cincinnati, OH | 2.0 | 1.0–2.5 | 1101 | $4,775 | $4.34 | 0d | 19 | 1.45mi |
| 414 Walnut St Cincinnati, OH | 2.0 | 1.0–2.5 | 990 | $5,395 | $5.45 | 0d | 23 | 1.46mi |
| 1065 Manhattan Blvd Dayton, KY | 1.0–3.0 | 1.0–2.0 | 1038 | $2,749 | $2.65 | 0d | 18 | 1.47mi |
| 1354 Broadway Unit 1056136P Cincinnati, OH | 4.0 | 3.0 | 2529 | $7,365 | $2.91 | 0d | 1 | 1.48mi |
| 2025 Burnet Ave Unit 2 Cincinnati, OH | 3.0 | 2.0 | 1513 | $1,795 | $1.19 | 6d | 1 | 1.49mi |
Listing history 2 events
-
2026-05-28status Pending
-
2026-05-27$275,000 Active
ⓘ Source: listings_history table (triggers on properties + properties_extension) + one-shot
backfill from property_details.listing_events for pre-trigger history.
Tax reassessment forecast KY · Resets to sale price
- Current annual tax
- $2,229 · $186/mo
- Projected year-2 tax
- $2,365 · $197/mo
- Expected delta
- +$136/yr (+$11/mo · 6.1%)
ⓘ Screening estimate from a state-policy table — verify with the county assessor before closing.
Climate risk First Street
- Flood 1/10 Low FEMA zone X (unshaded) · 0% chance over 30 yrs
- Wildfire 1/10 Low
- Heat 5/10 Major 7 d/yr ≥103°F today · 19 d/yr by 30 yrs out
- Wind 2/10 Low 100% chance of damaging wind over 30 yrs
- Air quality 3/10 Moderate 2 unhealthy d/yr today · 3 by 30 yrs out
Nearby sold comps map
Loading sold comps map…
Walkable amenities ~0.75 mi
Loading nearby amenities…
Taxation est. · year 1
- Rental income
- $34,527
- − Mortgage interest
- −$15,404
- − Property taxes
- −$2,229
- − Insurance
- −$1,375
- − Repairs & maintenance
- −$2,762
- − Management
- −$2,762
- − Depreciation
- −$8,000
- Taxable income
- $1,994
- Est. tax owed @ 24.0%
- −$478
- After-tax cash flow
- $5,888/yr
For passive investors: Depreciation is non-cash, so a rental often shows a tax loss while cash-flowing — sheltering income. Rental losses are passive: they offset passive income freely, and up to $25,000/yr can offset ordinary (W-2) income if you actively participate and your MAGI is under $100k (phasing out to $0 by $150k); unused losses carry forward. On sale, claimed depreciation is recaptured at up to 25%, and gains may owe capital-gains tax (a 1031 exchange can defer both). Figures are a year-1 estimate at your 24.0% rate — not tax advice; consult a CPA.
Schools (NCES district)
- District
- Bellevue Independent
- NCES district ID
- 2100420
- Math proficiency
- 17% ▼ -16.00%
- Reading proficiency
- 33% ▼ -12.00%
- Median HH income
- $51,374
- Composite
- 22.13/100
- National rank
- #8173
- State rank
- #136 of 165 in KY
Livability — Bellevue
- Score
- 92/100
- State rank
- #8
- US rank
- #24
Category grades
Schools grade is shown separately in the Schools card above.
Census & demographics
- Census place
- Bellevue, KY
- County
- Campbell County · 84,793 people
- City population
- 5,636
- Metro
- Cincinnati, OH-KY-IN
- Population (ZIP)
- 5,636
- Household income
- $71,166
- Rent vs Own
- Severe rent burden
- 173.0
Population outlook (Campbell County) Hauer SSP2
- Today (2025)
- 95,668 people
- By 2030
- 96,886 · +1.3%
- By 2040
- 97,734 · +2.2%
- By 2050
- 96,413 · +0.8%
- By 2075
- 90,211 · -5.7%
- By 2100
- 79,434 · -17.0%
Race, ethnicity, and origin ACS 2023
- Neighborhood character
- Predominantly White (90%)
- Race & ethnicity
- White 90% Hispanic / Latino 4% Two or more races 2%
- Common ancestry
- Lithuanian 3% Slovak 3% Iranian 2%
- Foreign-born
- 2% · Canada
- Languages at home
- 95% English-only · Spanish 3% German/W. Germanic 2%
Political lean MEDSL · Campbell
- 2024 margin
- R (+19.7) · D 39.2% · R 58.9% · Other 1.9%
- 2008→2024 swing
- +1.2pp toward D · 2008: -20.9pp · 2024: -19.7pp
- All cycles
- 2024: R+19.7 2020: R+18.6 2016: R+24.5 2012: R+22.8 2008: R+20.9
Not yet ingested
- Civics
- —
Market trends
- HPI YoY
- ▼ -186.80%
- Current HPI
- 252.0078
- Rent YoY
- ▲ 0.19%
- Metro
- Cincinnati, OH-KY-IN
- State GDP YoY
- ▲ 1.81%
- F500 in state
- 4
Industry mix (Fortune 500 HQ in KY)
| Industry | F500 HQs | Revenue |
|---|---|---|
| Healthcare | 1 | $118B |
|
||
| Food / Beverage | 1 | $7B |
|
||
Price history
2 events — show timeline
- 2026-05-28 Pending — NKMLS
- 2026-05-27 Listed $275,000 NKMLS
Property tax history
+3.7%/yrLatest (2025): $2,229 · -0.9% YoY. Source: county tax records.
Cash-flow waterfall
monthlySold comps — $/sqft
last 12 mo · ≤1 miLoading sold comps…