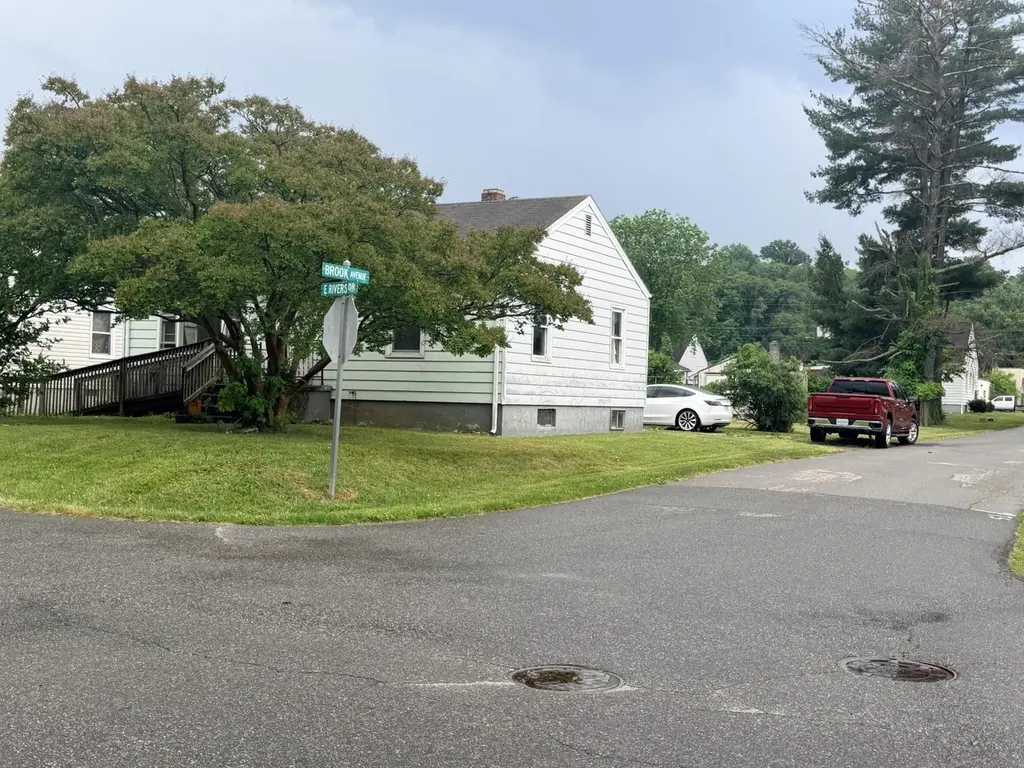
300 E Riverside Dr · Salem, VA
Flood risk 4/10 · Minor
- FEMA flood zone
- AE
- Chance of flooding over 30 yrs
- 0.24%
- Est. flood insurance / yr
- $1,737 – $8,500
Fire risk 2/10 · Minimal
- Est. fire insurance / yr
- $666 – $1,236
Heat risk 5/10 · Moderate
- Hot days now (above 101°F)
- 7 days/yr
- Hot days in 30 yrs
- 21 days/yr
Wind risk 2/10 · Minimal
- Chance of severe wind over 30 yrs
- 1.0%
Air-quality risk 1/10 · Minimal
- Unhealthy air days now
- 0 days/yr
- Unhealthy air days in 30 yrs
- 0 days/yr
Risk factors via First Street. Map © Google.
Why this score? — see what drove the B grade
The composite is a weighted blend of 9 inputs, each scored 0–100. Each bar is that input's sub-score; the figure is the points it added to the 100-point composite (weight × sub-score).
- Cash flow +30.0/30.0
- 1% rule +10.0/10.0
- DSCR +10.0/10.0
- ARV discount +7.5/15.0
- Schools +5.7/10.0
- Rent growth +4.0/5.0
- Livability +3.9/5.0
- Condition / age +2.5/5.0
- Appreciation +0.0/10.0
$75,000
🖨 Deal sheet 📄 Offer letter ✓ Due diligence
Listing remarks
INVESTORS!!! You need to get in there asap. Large, flat, corner lot in Salem steps away from the river and greenway. This one is ready for its next story as soon as you are!
Key facts
- 8,712 sq ft lot
- 2 parking spots
- Built 1950
Tags
Property features AI
Finance
- Other: Lot size approximately 0.2 acres (8,712 sq ft)
- Financial info: Listing price provided but financial details omitted
Exterior
- Parking: 2 open parking spaces
- Utilities: Has heating; Has cooling
- Home design: Residential property; Built in 1950
- Construction: Year built: 1950
- Exterior features: Off-street parking
Interior
- Bedrooms: 3 bedrooms (all on the main level)
- Flooring: Laminate; Wood
- Bathrooms: 1 full bathroom (on the main level)
- Heating & cooling: Forced air oil heating; Central cooling
- Interior features: Laminate and wood flooring
Neighborhood map
What this means for you Summary
Snapshot
- This is a 3-bed/1.0-bath single-family listed at $75k.
Deal economics
- At list price, monthly cash flow is $263 ($3k/yr) — positive.
- The deal already cash-flows at list — no discount required.
- Meets the 1% rule at list price ($2k rent vs $75k).
- Cap rate 17.3% vs local median 2.9% in Salem — top-decile yield for the area; either an underpriced asset or a hidden risk that comps aren't pricing in. Stress-test before assuming the spread holds.
Location & tenants
- Location reads 77/100 on livability (#104 in VA, #3,257 nationally) — a middle-class / working-renter tenant base. Strengths: housing A+, health & safety A+, cost of living A; Watch: amenities F, commute F.
- Salem City Public School District (suburban): math 61% / reading 74% proficiency, ranked #35 of 131 in VA (top 27%) — acceptable for families but not a draw, mixed tenant base, ~2y average lease.
- Zoned schools: East Salem Elementary (math 52% / reading 67%, grade B-, #536 of 1,108 statewide, top 51%, 409 students, 73% FRL); Andrew Lewis Middle (math 57% / reading 72%, grade A-, #123 of 342 statewide, top 37%, 895 students, 44% FRL); Salem High (math 64% / reading 91%, grade A-, #83 of 319 statewide, top 28%, 1,227 students, 39% FRL) — zoned schools average 52% FRL vs 27% district-wide (25 pts higher); higher-poverty schools than district average — tighter screening recommended.
- Market conditions: Rents rising fast (+6.0%/yr); 271 active listings in the ZIP; 14 comparable units currently listed for rent nearby; rentals lingering (median 44d on market — plan ~5-8 weeks vacancy on turnover, expect pricing pressure); 50% of comp listings sitting > 30 days — soft ceiling on asking rent; 268 units permitted in Salem city in 2024 (248 in 5+ unit buildings).
Forward outlook
- Local home prices are declining (-3.0%/yr); year-one equity from $519 of loan paydown is wiped out by about $2k of value loss. Plan a longer hold.
- Salem County population projected at +16% by 2050 — long-run rental-demand tailwind backs the buy-and-hold thesis.
- At projected returns (-3.0% appreciation + 6.0% rent growth), your $21k cash investment doubles in ~6 years — after that, you're playing with house money.
Negotiation context
- Only 1 days on market — expect competitive offers; lowballing is unlikely to land.
Risks & watch-outs
- Watch-outs: flood insurance adds $427/mo; built in 1950 — expect roof / HVAC / electrical / plumbing capex.
- Climate carrying-cost: in FEMA flood zone AE (mandatory federal flood insurance); extreme-heat days projected 7→21/yr by 2055 (HVAC capex compounding) — expect insurance premiums to compound above CPI over the hold.
Questions for the listing agent
- Built in 1950 — when were the roof, HVAC, electrical panel, plumbing, and water heater last replaced?
- What's the actual annual flood-insurance premium (NFIP or private), and is the property in a SFHA with mandatory coverage?
- Is there a deadline driving the sale (1031 exchange, divorce, estate, relocation)? That informs how much negotiation room exists.
- Schools are A-rated — typically a magnet for longer-tenancy family renters. What's the average tenant stay here, and is there a school-zone premium baked into asking?
- What's the average days-on-market for RENTAL listings here right now (not sales)? A rising rental-DOM trend means longer vacancies and softer asking-rent achievability than the comps imply.
- What's the recent tenant-quality profile in this submarket — average credit score on applications, eviction rate, late-payment / NSF rate, and stable-employment percentage? A property-management company in the area should have these aggregated.
- How much new for-sale + rental construction is in the pipeline within 1–3 miles? Heavy new supply typically softens prices + rents 12–24 months out; constrained supply supports both.
Investment metrics
- 1% rule
- 2.05% ✓
- Cap rate
- 17.33%
- Cash-on-cash
- 39.42%
- DSCR
- 2.75
- GRM
- 4.1
CMA / ARV
- ARV (on-the-fly)
- $207,612
- Comps found
- 9
Show comp detail 9 sales within ~0.75 mi
| Address | Dist | Beds/Ba | Sqft | Sold | Price | $/sf | Match |
|---|---|---|---|---|---|---|---|
| 206 Front Ave | 0.22mi | 2/1.0 (-1) | 986 (+4%) | 15mo | $181,000 | $184 | 66 |
| 419 Front Ave | 0.45mi | 2/1.0 (-1) | 1,020 (+8%) | 9mo | $204,950 | $201 | 54 |
| 2421 Franklin St | 0.69mi | 3/1.0 | 928 (-2%) | 13mo | $220,000 | $237 | 54 |
| 2312 Peach St | 0.64mi | 2/1.0 (-1) | 1,000 (+6%) | 13mo | $219,000 | $219 | 45 |
| 1102 Carolina Ave | 0.71mi | 2/1.0 (-1) | 1,006 (+6%) | 12mo | $220,000 | $219 | 42 |
| 1821 Eddy Ave | 0.70mi | 2/2.0 (-1) | 961 (+1%) | 20mo | $220,000 | $229 | 39 |
| 622 Palmer Ave | 0.63mi | 3/2.0 | 1,001 (+6%) | 23mo | $247,000 | $247 | 38 |
| 2315 Peach St | 0.67mi | 2/1.0 (-1) | 868 (-8%) | 15mo | $190,000 | $219 | 37 |
| 502 W Riverside Dr | 0.46mi | 2/1.0 (-1) | 1,069 (+13%) | 24mo | $200,000 | $187 | 32 |
Match score weights: distance 35% · size 25% · config 20% · recency 20%. Top-matched comps best support the ARV.
Projected returns pro-forma
-3.0% appreciation · 5.98% rent growth · sell at horizon
- IRR
- 11.0%
- Equity multiple
- 1.46×
- Total profit
- $9,645
- Equity at exit
- $11,183
- IRR
- 23.5%
- Equity multiple
- 3.47×
- Total profit
- $51,854
- Equity at exit
- $6,485
Cash invested: $21,000 (down + closing). Projections, not guarantees.
Landlord ↔ Tenant lean methodology
- Overall (STATE)
- 55 Moderately Landlord-Leaning
- State Virginia
- 55 Moderately Landlord-Leaning · D+2
- County
- — inherits STATE
- City
- — inherits STATE
ZIP-level market 24153
- Rents YoY
- 6.0%
- Active inventory
- 271
- Price-to-rent
- 4.1×
Monthly cashflow live
- Estimated rent
- $1,536 high interval (Pro) →
- Mortgage (P&I)
- −$393
- Tax from tax record
- −$99 /mo · $1,191/yr
- Insurance
- −$31
- Flood insurance flood zone
- −$427 /mo · $5,118/yr
- HOA
- −$0
- Vacancy / Maint / Mgmt
- −$323
- Net cashflow
- $263
Break-even live
UW: 25.0% down · 7.5% · 30yr · 1.5% tax · 5.0% vac · 8.0% maint · 8.0% mgmt
Financing live
Cash to close
- Down payment
- $18,750
- Closing costs
- $2,250
- Reserves months
- —
- Total cash needed
- —
Loan-product check · same deal, 3 products live
Conventional
25% down · 7.5% · 30yr
- Down + closing
- —
- Monthly P&I
- —
- Monthly cashflow
- —
- DSCR
- —
- Eligible?
- —
Personal DTI + credit; lowest rate.
DSCR
20% down · 8.5% · 30yr
- Down + closing
- —
- Monthly P&I
- —
- Monthly cashflow
- —
- DSCR
- —
- Eligible?
- —
No personal income docs; deal must DSCR.
Hard money
10% down · 12.0% · 12mo
- Down + closing
- —
- Monthly P&I
- —
- Monthly cashflow
- —
- DSCR
- —
- Eligible?
- —
Short-term bridge; refi at stabilization.
Rent comps 14 comps
| Address | Beds | Baths | Sqft | Rent | $/sqft | DOM | Units | Dist |
|---|---|---|---|---|---|---|---|---|
| 510 Yorkshire St Salem, VA | 2.0 | 1.0 | 900 | $1,249 | $1.39 | 13d | 6 | 0.30mi |
| 100 Kimball Ave Salem, VA | 2.0 | 1.0 | 885 | $1,430 | $1.62 | 13d | 24 | 0.31mi |
| 814 Tennessee St Salem, VA | 2.0 | 1.0 | 927 | $1,100 | $1.19 | 43d | 1 | 0.59mi |
| 814 Tennessee St Salem, VA | 2.0 | 1.0 | 927 | $1,000 | $1.08 | 13d | 1 | 0.59mi |
| 821 Apperson Dr Unit Apperson TH F Salem, VA | 2.0 | 1.0 | 728 | $1,222 | $1.68 | 43d | 1 | 0.60mi |
| 719 S Colorado St Unit A Salem, VA | 2.0 | 1.0 | 958 | $1,350 | $1.41 | 21d | 1 | 0.61mi |
| 928 Ohio Ave Salem, VA | 3.0 | 1.0–2.0 | 992 | $2,622 | $2.64 | 13d | 1 | 0.62mi |
| 803 Roanoke Blvd Salem, VA | 2.0 | 1.0 | 900 | $1,295 | $1.44 | 43d | 1 | 0.84mi |
| 927 Piedmont Ave Salem, VA | 3.0 | 1.0 | 1024 | $2,200 | $2.15 | 43d | 1 | 0.86mi |
| 777 Roanoke Blvd Salem, VA | 1.0–3.0 | 1.0 | 779 | $1,505 | $1.93 | 13d | 12 | 0.88mi |
| 415 Union St Unit 5 Salem, VA | 2.0 | 1.0 | 950 | $1,300 | $1.37 | 21d | 1 | 0.89mi |
| 231 Chestnut St Salem, VA | 1.0–2.0 | 1.0 | 585 | $1,175 | $2.01 | 43d | 5 | 1.07mi |
| 2223 Bailey Ave Unit Bailey C Salem, VA | 2.0 | 1.0 | 1000 | $1,400 | $1.40 | 43d | 1 | 1.08mi |
| 2227 Bailey Ave Unit C Salem, VA | 2.0 | 1.0 | 972 | $1,395 | $1.44 | 44d | 1 | 1.10mi |
Listing history 1 events
-
2026-05-25$75,000 Active
ⓘ Source: listings_history table (triggers on properties + properties_extension) + one-shot
backfill from property_details.listing_events for pre-trigger history.
Tax reassessment forecast VA · Resets to sale price
- Current annual tax
- $1,191 · $99/mo
- Projected year-2 tax
- $1,191 · $99/mo
- Expected delta
- $0/yr ($0/mo · 0.0%)
ⓘ Screening estimate from a state-policy table — verify with the county assessor before closing.
Climate risk First Street
- Flood 4/10 Moderate FEMA zone AE · 24% chance over 30 yrs
- Wildfire 2/10 Low
- Heat 5/10 Major 7 d/yr ≥101°F today · 21 d/yr by 30 yrs out
- Wind 2/10 Low 100% chance of damaging wind over 30 yrs
- Air quality 1/10 Low 0 unhealthy d/yr today · 0 by 30 yrs out
Nearby sold comps map
Loading sold comps map…
Walkable amenities ~0.75 mi
Loading nearby amenities…
Taxation est. · year 1
- Rental income
- $18,434
- − Mortgage interest
- −$4,201
- − Property taxes
- −$1,191
- − Insurance
- −$5,494
- − Repairs & maintenance
- −$1,475
- − Management
- −$1,475
- − Depreciation
- −$2,182
- Taxable income
- $2,417
- Est. tax owed @ 24.0%
- −$580
- After-tax cash flow
- $2,579/yr
For passive investors: Depreciation is non-cash, so a rental often shows a tax loss while cash-flowing — sheltering income. Rental losses are passive: they offset passive income freely, and up to $25,000/yr can offset ordinary (W-2) income if you actively participate and your MAGI is under $100k (phasing out to $0 by $150k); unused losses carry forward. On sale, claimed depreciation is recaptured at up to 25%, and gains may owe capital-gains tax (a 1031 exchange can defer both). Figures are a year-1 estimate at your 24.0% rate — not tax advice; consult a CPA.
Schools (NCES district)
- District
- Salem City Public School District
- NCES district ID
- 5103460
- Math proficiency
- 61% ▼ -21.00%
- Reading proficiency
- 74% ▼ -7.00%
- Median HH income
- $49,976
- Composite
- 57.25/100
- National rank
- #1092
- State rank
- #35 of 131 in VA
Livability — Salem
- Score
- 77/100
- State rank
- #104
- US rank
- #3257
Category grades
Schools grade is shown separately in the Schools card above.
Census & demographics
- Census place
- Salem, VA
- County
- Salem City · 38,914 people
- City population
- 38,914
- Metro
- Roanoke, VA
- Population (ZIP)
- 38,914
- Household income
- $74,260
- Rent vs Own
- Severe rent burden
- 1115.0
Population outlook (Salem County) Hauer SSP2
- Today (2025)
- 26,761 people
- By 2030
- 27,543 · +2.9%
- By 2040
- 29,174 · +9.0%
- By 2050
- 30,902 · +15.5%
- By 2075
- 35,530 · +32.8%
- By 2100
- 39,381 · +47.2%
Race, ethnicity, and origin ACS 2023
- Neighborhood character
- Predominantly White (84%)
- Race & ethnicity
- White 84% Black 6% Hispanic / Latino 4% Two or more races 4% Asian 2%
- Common ancestry
- Serbian 2% Slovak 2% Romanian 1%
- Foreign-born
- 4% · Canada, China
- Languages at home
- 96% English-only · Spanish 2% Other Indo-European 1%
Political lean MEDSL · Salem
- 2024 margin
- R (+19.3) · D 39.8% · R 59.1% · Other 1.1%
- 2008→2024 swing
- -3.8pp toward R · 2008: -15.5pp · 2024: -19.3pp
- All cycles
- 2024: R+19.3 2020: R+19.4 2016: R+24.8 2012: R+20.6 2008: R+15.5
Not yet ingested
- Civics
- —
Market trends
- HPI YoY
- ▼ -259.46%
- Current HPI
- 170.8986
- Rent YoY
- ▲ 5.98%
- Metro
- Roanoke, VA
- State GDP YoY
- ▲ 2.40%
- F500 in state
- 50
Industry mix (Fortune 500 HQ in VA)
| Industry | F500 HQs | Revenue |
|---|---|---|
| Aerospace / Defense | 4 | $236B |
|
||
| Technology / Defense | 3 | $32B |
|
||
| Financial Services | 2 | $176B |
|
||
| Utilities | 2 | $27B |
|
||
| Insurance | 2 | $25B |
|
||
| Technology | 2 | $15B |
|
||
Price history
1 event — show timeline
- 2026-05-25 Listed $75,000 MLSRV
Property tax history
+4.3%/yrLatest (2025): $1,191 · +5.1% YoY. Source: county tax records.
Cash-flow waterfall
monthlySold comps — $/sqft
last 12 mo · ≤1 miLoading sold comps…