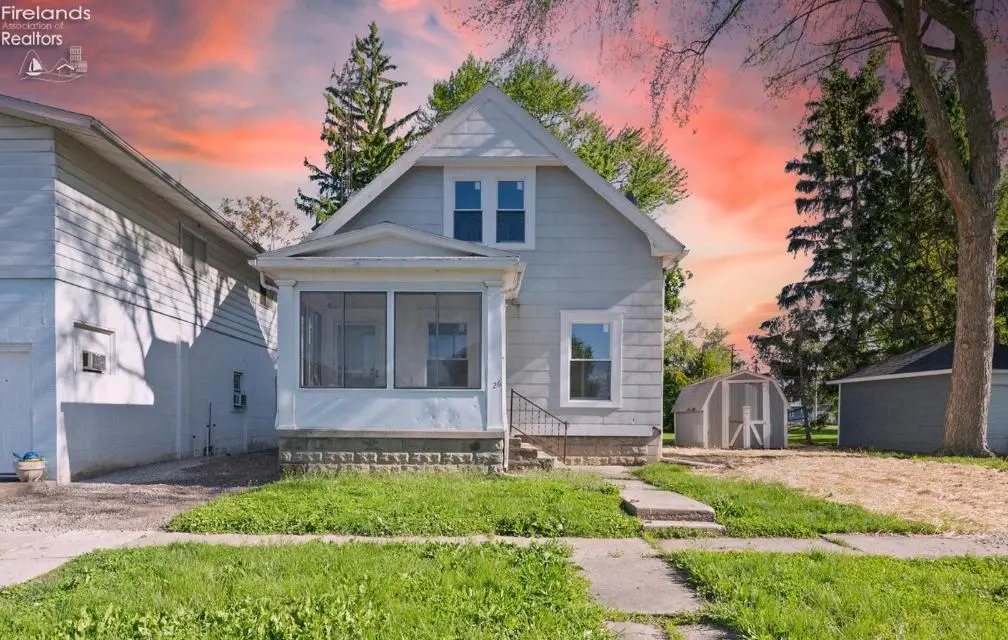
226 W 5th St · Port Clinton, OH
Flood risk 1/10 · Minimal
- FEMA flood zone
- X (unshaded)
- Chance of flooding over 30 yrs
- 0.0%
- Est. flood insurance / yr
- $473 – $860
Fire risk 1/10 · Minimal
- Est. fire insurance / yr
- $713 – $1,323
Heat risk 3/10 · Minor
- Hot days now (above 96°F)
- 7 days/yr
- Hot days in 30 yrs
- 17 days/yr
Wind risk 2/10 · Minimal
- Chance of severe wind over 30 yrs
- —
Air-quality risk 2/10 · Minimal
- Unhealthy air days now
- 1 days/yr
- Unhealthy air days in 30 yrs
- 2 days/yr
Risk factors via First Street. Map © Google.
Why this score? — see what drove the C- grade
The composite is a weighted blend of 9 inputs, each scored 0–100. Each bar is that input's sub-score; the figure is the points it added to the 100-point composite (weight × sub-score).
- Cash flow +25.4/30.0
- DSCR +8.4/10.0
- 1% rule +5.6/10.0
- Schools +4.8/10.0
- Livability +3.6/5.0
- Rent growth +2.5/5.0
- Condition / age +2.5/5.0
- ARV discount +0.0/15.0
- Appreciation +0.0/10.0
$225,000
🖨 Deal sheet 📄 Offer letter ✓ Due diligence
Listing remarks
Welcome to this beautifully renovated 3-bedroom, 2 full bathroom home in the heart of Port Clinton offering 1,167 square feet of updated living space near schools, parks, Lake Erie beaches, and downtown Port Clinton attractions. Perfectly positioned for year-round living, a vacation home, or investment opportunity, this move-in ready property combines modern updates with an unbeatable location in Ohio's sought-after Vacationland region. Recent renovations include a beautifully updated kitchen with newly installed appliances, new flooring, fresh paint, updated carpeting, and the addition of a second full bathroom, creating a clean and modern feel throughout the home. Natural light fills the
Key facts
- 3,001 sq ft lot
- Built 1913
- Listed 27 days
Property features AI
Exterior
- Utilities: Public water; Public sewer
- Home design: Single-family residential property
- Construction: Block construction
- Exterior features: Asphalt roof; Shed(s) on property
Interior
- Kitchen: Range; Refrigerator
- Bedrooms: 6 total rooms (includes living spaces and bedrooms)
- Bathrooms: 2 full bathrooms
- Heating & cooling: Natural gas heating; Forced air heating; Ceiling fan(s)
- Interior features: Range; Refrigerator; Ceiling fan(s)
- Laundry & utility: Sump pump in full basement
Neighborhood map
What this means for you Summary
Snapshot
- This is a 2-bed/2.0-bath single-family listed at $225k.
Deal economics
- At list price, monthly cash flow is $515 ($6k/yr) — positive.
- The deal already cash-flows at list — no discount required.
- Meets the 1% rule at list price ($2k rent vs $225k).
- Recommended offer: $222k (1.5% below list) — sets the bar for market timing.
- Cap rate 9.0% vs local median 2.3% in Port Clinton — top-decile yield for the area; either an underpriced asset or a hidden risk that comps aren't pricing in. Stress-test before assuming the spread holds.
Location & tenants
- Location reads 72/100 on livability (#359 in OH) — a middle-class / working-renter tenant base. Strengths: cost of living A+, housing A+, schools A-; Watch: employment C-, amenities F, commute F.
- Port Clinton City (town): math 55% / reading 59% proficiency, ranked #342 of 656 in OH (top 52%) — acceptable for families but not a draw, mixed tenant base, ~2y average lease.
- Market conditions: 220 active listings in the ZIP; 128 units permitted in Ottawa County in 2024 (0 in 5+ unit buildings).
- This rent runs 45% of the median local income ($64k/yr) — at the standard rent-burdened threshold; future hikes will face affordability resistance.
Forward outlook
- Local home prices are declining (-3.0%/yr); year-one equity from $2k of loan paydown is wiped out by about $7k of value loss. Plan a longer hold.
- Ottawa County population projected at -19% by 2050 — secular population decline; favor cash flow + early exit over multi-decade hold.
Negotiation context
- It's been on market 28 days — a 2% lower offer ($222k) is reasonable based on typical stale-listing flexibility.
- Current owner paid $55k; list at $225k implies a 309% gain — meaningful room to come down on a strong offer.
Risks & watch-outs
- Watch-outs: built in 1913 — expect roof / HVAC / electrical / plumbing capex.
Questions for the listing agent
- Built in 1913 — when were the roof, HVAC, electrical panel, plumbing, and water heater last replaced?
- Is there a deadline driving the sale (1031 exchange, divorce, estate, relocation)? That informs how much negotiation room exists.
- Schools are A-rated — typically a magnet for longer-tenancy family renters. What's the average tenant stay here, and is there a school-zone premium baked into asking?
- What's the average days-on-market for RENTAL listings here right now (not sales)? A rising rental-DOM trend means longer vacancies and softer asking-rent achievability than the comps imply.
- What's the recent tenant-quality profile in this submarket — average credit score on applications, eviction rate, late-payment / NSF rate, and stable-employment percentage? A property-management company in the area should have these aggregated.
- How much new for-sale + rental construction is in the pipeline within 1–3 miles? Heavy new supply typically softens prices + rents 12–24 months out; constrained supply supports both.
Investment metrics
- 1% rule
- 1.06% ✓
- Cap rate
- 9.04%
- Cash-on-cash
- 9.81%
- DSCR
- 1.44
- GRM
- 7.9
CMA / ARV
- ARV (median comp)
- $177,642
- List price
- $225,000
- Delta
- 26.66%
- Verdict
- OVERPRICED
- Comps
- 20 within 1.0 mi
Show comp detail 12 sales within ~0.75 mi
| Address | Dist | Beds/Ba | Sqft | Sold | Price | $/sf | Match |
|---|---|---|---|---|---|---|---|
| 611 Alice St | 0.48mi | 2/1.0 | 1,168 (+0%) | 4mo | $203,000 | $174 | 70 |
| 501 Jackson St | 0.02mi | 2/1.0 | 1,092 (-6%) | 18mo | $129,900 | $119 | 69 |
| 820 Monroe St | 0.35mi | 3/1.0 (+1) | 1,168 (+0%) | 8mo | $165,000 | $141 | 68 |
| 322 E 6th St | 0.43mi | 3/1.0 (+1) | 1,182 (+1%) | 2mo | $175,000 | $148 | 68 |
| 516 Fremont Rd | 0.26mi | 3/2.0 (+1) | 1,232 (+6%) | 9mo | $225,000 | $183 | 66 |
| 424 Short | 0.62mi | 3/2.0 (+1) | 1,152 (-1%) | 11mo | $170,500 | $148 | 54 |
| 200 E 6th St | 0.29mi | 3/1.0 (+1) | 1,048 (-10%) | 7mo | $126,000 | $120 | 54 |
| 516 Adams St | 0.35mi | 2/1.0 | 1,045 (-10%) | 10mo | $185,000 | $177 | 54 |
| 410 Harrison St | 0.14mi | 2/1.0 | 996 (-15%) | 14mo | $193,000 | $194 | 53 |
| 413 Adams St | 0.37mi | 3/1.5 (+1) | 1,278 (+10%) | 8mo | $115,000 | $90 | 53 |
| 414 Short St | 0.62mi | 2/1.0 | 1,056 (-10%) | 8mo | $100,000 | $95 | 45 |
| 420 Lincoln Dr | 0.71mi | 3/2.0 (+1) | 1,240 (+6%) | 18mo | $230,000 | $185 | 36 |
Match score weights: distance 35% · size 25% · config 20% · recency 20%. Top-matched comps best support the ARV.
Projected returns pro-forma
-3.0% appreciation · 3.0% rent growth · sell at horizon
- IRR
- -1.6%
- Equity multiple
- 0.94×
- Total profit
- $-3,724
- Equity at exit
- $33,548
- IRR
- 8.1%
- Equity multiple
- 1.61×
- Total profit
- $38,690
- Equity at exit
- $19,454
Cash invested: $63,000 (down + closing). Projections, not guarantees.
Landlord ↔ Tenant lean methodology
- Overall (STATE)
- 73 Landlord-Friendly
- State Ohio
- 73 Landlord-Friendly · R+6
- County
- — inherits STATE
- City
- — inherits STATE
ZIP-level market 43452
- Active inventory
- 220
- Price-to-rent
- 7.9×
Monthly cashflow live
- Estimated rent
- $2,383 medium interval (Pro) →
- Mortgage (P&I)
- −$1,180
- Tax from tax record
- −$94 /mo · $1,128/yr
- Insurance
- −$94
- HOA
- −$0
- Vacancy / Maint / Mgmt
- −$501
- Net cashflow
- $515
Break-even live
UW: 25.0% down · 7.5% · 30yr · 1.5% tax · 5.0% vac · 8.0% maint · 8.0% mgmt
Financing live
Cash to close
- Down payment
- $56,250
- Closing costs
- $6,750
- Reserves months
- —
- Total cash needed
- —
Loan-product check · same deal, 3 products live
Conventional
25% down · 7.5% · 30yr
- Down + closing
- —
- Monthly P&I
- —
- Monthly cashflow
- —
- DSCR
- —
- Eligible?
- —
Personal DTI + credit; lowest rate.
DSCR
20% down · 8.5% · 30yr
- Down + closing
- —
- Monthly P&I
- —
- Monthly cashflow
- —
- DSCR
- —
- Eligible?
- —
No personal income docs; deal must DSCR.
Hard money
10% down · 12.0% · 12mo
- Down + closing
- —
- Monthly P&I
- —
- Monthly cashflow
- —
- DSCR
- —
- Eligible?
- —
Short-term bridge; refi at stabilization.
Listing history 17 events
-
2026-06-18days on market $225,000 Active 28 DOM
-
2026-06-17days on market $225,000 Active 27 DOM
-
2026-06-16days on market $225,000 Active 26 DOM
-
2026-06-15days on market $225,000 Active 25 DOM
-
2026-06-13days on market $225,000 Active 23 DOM
-
2026-06-12days on market $225,000 Active 22 DOM
-
2026-06-09days on market $225,000 Active 19 DOM
-
2026-06-08days on market $225,000 Active 18 DOM
-
2026-06-08days on market $225,000 Active 17 DOM
-
2026-06-07days on market $225,000 Active 16 DOM
-
2026-06-04days on market $225,000 Active 13 DOM
-
2026-06-02days on market $225,000 Active 12 DOM
-
2026-06-01days on market $225,000 Active 11 DOM
-
2026-05-31days on market $225,000 Active 10 DOM
-
2026-05-15historical $225,000 1479-char remark
-
2005-07-29soldstatus $55,000
-
1994-05-24soldstatus $45,000
ⓘ Source: listings_history table (triggers on properties + properties_extension) + one-shot
backfill from property_details.listing_events for pre-trigger history.
Tax reassessment forecast OH · Partial reset (capped growth)
- Current annual tax
- $1,128 · $94/mo
- Projected year-2 tax
- $2,319 · $193/mo
- Expected delta
- +$1,191/yr (+$99/mo · 105.6%)
ⓘ Screening estimate from a state-policy table — verify with the county assessor before closing.
Climate risk First Street
- Flood 1/10 Low FEMA zone X (unshaded) · 0% chance over 30 yrs
- Wildfire 1/10 Low
- Heat 3/10 Moderate 7 d/yr ≥96°F today · 17 d/yr by 30 yrs out
- Wind 2/10 Low
- Air quality 2/10 Low 1 unhealthy d/yr today · 2 by 30 yrs out
Nearby sold comps map
Loading sold comps map…
Walkable amenities ~0.75 mi
Loading nearby amenities…
Taxation est. · year 1
- Rental income
- $28,600
- − Mortgage interest
- −$12,603
- − Property taxes
- −$1,128
- − Insurance
- −$1,125
- − Repairs & maintenance
- −$2,288
- − Management
- −$2,288
- − Depreciation
- −$6,545
- Taxable income
- $2,623
- Est. tax owed @ 24.0%
- −$629
- After-tax cash flow
- $5,553/yr
For passive investors: Depreciation is non-cash, so a rental often shows a tax loss while cash-flowing — sheltering income. Rental losses are passive: they offset passive income freely, and up to $25,000/yr can offset ordinary (W-2) income if you actively participate and your MAGI is under $100k (phasing out to $0 by $150k); unused losses carry forward. On sale, claimed depreciation is recaptured at up to 25%, and gains may owe capital-gains tax (a 1031 exchange can defer both). Figures are a year-1 estimate at your 24.0% rate — not tax advice; consult a CPA.
Schools (NCES district)
- District
- Port Clinton City
- NCES district ID
- 3904465
- Math proficiency
- 55% ▼ -14.00%
- Reading proficiency
- 59% ▼ -11.00%
- Median HH income
- $47,532
- Composite
- 48.34/100
- National rank
- #2145
- State rank
- #342 of 656 in OH
Livability — Port Clinton
- Score
- 72/100
- State rank
- #359
- US rank
- #5778
Category grades
Schools grade is shown separately in the Schools card above.
Census & demographics
- Census place
- Port Clinton, OH
- County
- Ottawa · 37,113 people
- City population
- 14,052
- Metro
- Sandusky, OH
- Population (ZIP)
- 14,052
- Household income
- $63,815
- Rent vs Own
- Severe rent burden
- 5.6
Population outlook (Ottawa County) Hauer SSP2
- Today (2025)
- 39,548 people
- By 2030
- 38,297 · -3.2%
- By 2040
- 35,070 · -11.3%
- By 2050
- 31,956 · -19.2%
- By 2075
- 27,454 · -30.6%
- By 2100
- 23,596 · -40.3%
Race, ethnicity, and origin ACS 2023
- Neighborhood character
- Predominantly White (90%)
- Race & ethnicity
- White 90% Hispanic / Latino 5% Two or more races 4% Black 2%
- Common ancestry
- Romanian 5% Lithuanian 3% Iranian 2%
- Foreign-born
- 1% · Canada
- Languages at home
- 98% English-only · Spanish 1%
Political lean MEDSL · Ottawa
- 2024 margin
- Strong R (+25.1) · D 37.0% · R 62.1%
- 2008→2024 swing
- -31.3pp toward R · 2008: 6.3pp · 2024: -25.1pp
- All cycles
- 2024: R+25.1 2020: R+23.4 2016: R+19.6 2012: D+4.1 2008: D+6.3
Not yet ingested
- Civics
- —
Market trends
- HPI YoY
- ▼ -145.50%
- Current HPI
- 219.0624
- Rent YoY
- —
- Metro
- —
- State GDP YoY
- ▲ 1.98%
- F500 in state
- 48
Industry mix (Fortune 500 HQ in OH)
| Industry | F500 HQs | Revenue |
|---|---|---|
| Insurance | 3 | $145B |
|
||
| Industrial Machinery | 3 | $49B |
|
||
| Financial Services | 3 | $24B |
|
||
| Consumer Goods | 2 | $93B |
|
||
| Aerospace / Defense | 2 | $47B |
|
||
| Utilities | 2 | $33B |
|
||
Price history
+400.0% since first listed4 events — show timeline
- 2026-05-22 Listed $225,000 FAOR
- 2026-05-15 Coming Soon $225,000 FAOR
- 2005-07-29 Sold (Public Records) $55,000 Public Records
- 1994-05-24 Sold (Public Records) $45,000 Public Records
Property tax history
+3.3%/yrLatest (2025): $1,128 · -2.0% YoY. Source: county tax records.
Cash-flow waterfall
monthlySold comps — $/sqft
last 12 mo · ≤1 miLoading sold comps…