418 Falcon Ave · Edgewater, FL
Flood risk 3/10 · Minor
- FEMA flood zone
- X (unshaded)
- Chance of flooding over 30 yrs
- 0.2%
- Est. flood insurance / yr
- $507 – $1,088
Fire risk 3/10 · Minor
- Est. fire insurance / yr
- $947 – $1,759
Heat risk 10/10 · Severe
- Hot days now (above 105°F)
- 8 days/yr
- Hot days in 30 yrs
- 23 days/yr
Wind risk 10/10 · Severe
- Chance of severe wind over 30 yrs
- 99.0%
Air-quality risk 2/10 · Minimal
- Unhealthy air days now
- 1 days/yr
- Unhealthy air days in 30 yrs
- 1 days/yr
Risk factors via First Street. Map © Google.
Why this score? — see what drove the C- grade
The composite is a weighted blend of 9 inputs, each scored 0–100. Each bar is that input's sub-score; the figure is the points it added to the 100-point composite (weight × sub-score).
- Cash flow +20.5/30.0
- ARV discount +7.5/15.0
- DSCR +6.5/10.0
- 1% rule +4.5/10.0
- Schools +3.9/10.0
- Livability +3.6/5.0
- Rent growth +2.5/5.0
- Condition / age +2.5/5.0
- Appreciation +0.0/10.0
$216,100
🖨 Deal sheet 📄 Offer letter ✓ Due diligence
Listing remarks MLS
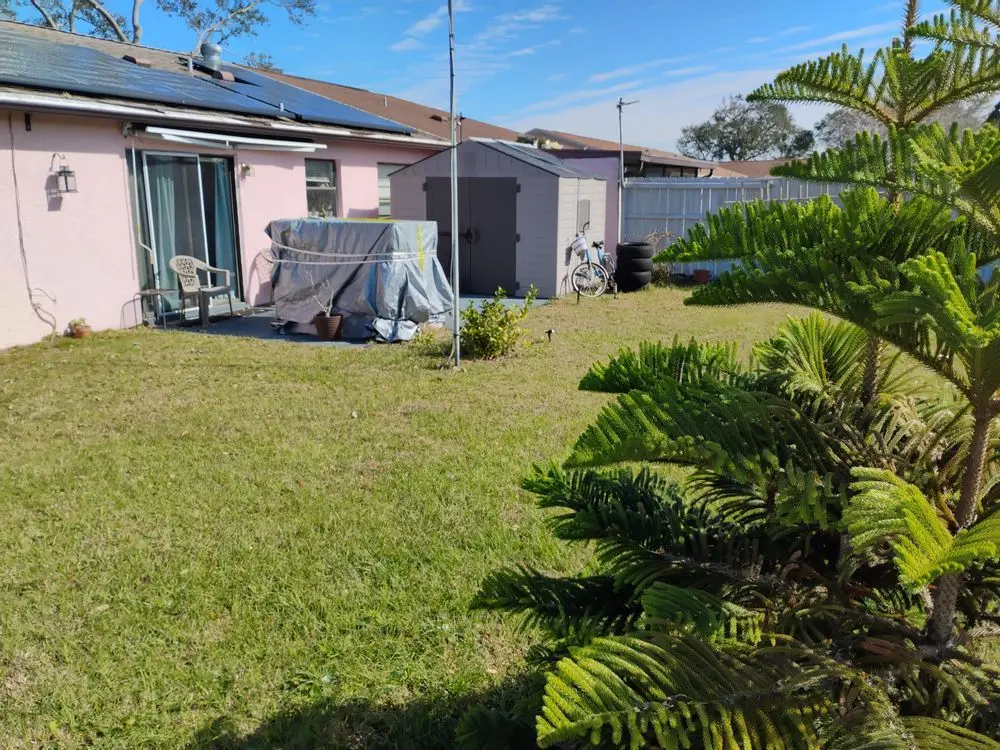
6,400 watt solar panels $29.91 electric bill!! great neighborhood close to river and a few miles to beach flea market winn dixie ! publix grocery . fenced yard in back storage building. no washer dryer !solar system comes wt it available jan 26 buy wt 1% dw wt rocket mortgage they give you an additional 2% , move in ready. may accept reasonable offers
Key facts
- Close to river
- Fenced yard
- Storage building
Tags
Neighborhood map
What this means for you Summary
Snapshot
- This is a 2-bed/2.0-bath single-family listed at $216k.
Deal economics
- At list price, monthly cash flow is $287 ($3k/yr) — positive.
- The deal already cash-flows at list — no discount required.
- To meet the 1% rule (rent ≥ 1% of price), the offer needs to be $205k (5.0% below list).
- Recommended offer: $190k (12.0% below list) — sets the bar for market timing.
Location & tenants
- Location reads 72/100 on livability (#329 in FL) — a middle-class / working-renter tenant base. Strengths: cost of living A+, housing A+, health & safety A+; Watch: amenities D-, commute F.
- Volusia (suburban): math 44% / reading 49% proficiency, ranked #47 of 73 in FL (top 64%) — families likely to look elsewhere, expect single-tenant / working-renter base with shorter leases.
- Market conditions: 304 active listings in the ZIP; 12 comparable units currently listed for rent nearby; rentals at typical pace (median 24d on market — plan ~3-4 weeks tenant-placement turnaround); 3,402 units permitted in Volusia County in 2024 (681 in 5+ unit buildings).
- This rent runs 39% of the median local income ($64k/yr) — at the standard rent-burdened threshold; future hikes will face affordability resistance.
Forward outlook
- Local home prices are declining (-3.0%/yr); year-one equity from $1k of loan paydown is wiped out by about $6k of value loss. Plan a longer hold.
- Volusia County population projected at +19% by 2050 — long-run rental-demand tailwind backs the buy-and-hold thesis.
Negotiation context
- It's been on market 178 days — a 12% lower offer ($190k) is reasonable based on typical stale-listing flexibility.
- Current owner paid $108k; list at $216k implies a 100% gain — meaningful room to come down on a strong offer.
Risks & watch-outs
- Climate carrying-cost: severe wind risk, 99% chance of damaging wind over 30y; extreme-heat days projected 8→23/yr by 2055 (HVAC capex compounding) — expect insurance premiums to compound above CPI over the hold.
Questions for the listing agent
- It's been on market 178 days. Have you received any prior offers? Is the seller open to a 12% concession, seller financing, or rate buy-down credit?
- Why hasn't it sold? Are there any deal-killer items the seller is aware of (foundation, flood, title, zoning, code violations)?
- Is there a deadline driving the sale (1031 exchange, divorce, estate, relocation)? That informs how much negotiation room exists.
- What's the average days-on-market for RENTAL listings here right now (not sales)? A rising rental-DOM trend means longer vacancies and softer asking-rent achievability than the comps imply.
- What's the recent tenant-quality profile in this submarket — average credit score on applications, eviction rate, late-payment / NSF rate, and stable-employment percentage? A property-management company in the area should have these aggregated.
- How much new for-sale + rental construction is in the pipeline within 1–3 miles? Heavy new supply typically softens prices + rents 12–24 months out; constrained supply supports both.
Investment metrics
- 1% rule
- 0.95% ✗
- Cap rate
- 7.88%
- Cash-on-cash
- 5.68%
- DSCR
- 1.25
- GRM
- 8.8
CMA / ARV
No comps found within radius.
Projected returns pro-forma
-3.0% appreciation · 3.0% rent growth · sell at horizon
- IRR
- -7.5%
- Equity multiple
- 0.72×
- Total profit
- $-16,835
- Equity at exit
- $32,221
- IRR
- 2.0%
- Equity multiple
- 1.14×
- Total profit
- $8,569
- Equity at exit
- $18,684
Cash invested: $60,508 (down + closing). Projections, not guarantees.
Landlord ↔ Tenant lean methodology
- Overall (STATE)
- 87 Strongly Landlord-Friendly
- State Florida
- 87 Strongly Landlord-Friendly · R+3
- County
- — inherits STATE
- City
- — inherits STATE
ZIP-level market 32141
- Home prices YoY
- -19.2%
- Active inventory
- 304
- Price-to-rent
- 8.8×
Monthly cashflow live
- Estimated rent
- $2,052 high interval (Pro) →
- Mortgage (P&I)
- −$1,133
- Tax from tax record
- −$112 /mo · $1,339/yr
- Insurance
- −$90
- HOA
- −$0
- Vacancy / Maint / Mgmt
- −$431
- Net cashflow
- $287
Break-even live
UW: 25.0% down · 7.5% · 30yr · 1.5% tax · 5.0% vac · 8.0% maint · 8.0% mgmt
Financing live
Cash to close
- Down payment
- $54,025
- Closing costs
- $6,483
- Reserves months
- —
- Total cash needed
- —
Loan-product check · same deal, 3 products live
Conventional
25% down · 7.5% · 30yr
- Down + closing
- —
- Monthly P&I
- —
- Monthly cashflow
- —
- DSCR
- —
- Eligible?
- —
Personal DTI + credit; lowest rate.
DSCR
20% down · 8.5% · 30yr
- Down + closing
- —
- Monthly P&I
- —
- Monthly cashflow
- —
- DSCR
- —
- Eligible?
- —
No personal income docs; deal must DSCR.
Hard money
10% down · 12.0% · 12mo
- Down + closing
- —
- Monthly P&I
- —
- Monthly cashflow
- —
- DSCR
- —
- Eligible?
- —
Short-term bridge; refi at stabilization.
Rent comps 12 comps
| Address | Beds | Baths | Sqft | Rent | $/sqft | DOM | Units | Dist |
|---|---|---|---|---|---|---|---|---|
| 1000 Egret Ct Edgewater, FL | 2.0 | 2.0 | 1051 | $2,400 | $2.28 | 23d | 1 | 0.17mi |
| 2314 Fern Palm Dr Unit 2314 Edgewater, FL | 2.0 | 2.0 | 1200 | $1,700 | $1.42 | 19d | 1 | 0.24mi |
| 2330 India Palm Dr Edgewater, FL | 2.0 | 2.0 | 1025 | $1,499 | $1.46 | 14d | 1 | 0.38mi |
| 2421 India Palm Dr Edgewater, FL | 3.0 | 2.0 | 1358 | $2,150 | $1.58 | 19d | 1 | 0.45mi |
| 2515 Fern Palm Dr Edgewater, FL | 3.0 | 2.0 | 1400 | $2,200 | $1.57 | 11d | 1 | 0.49mi |
| 2621 India Palm Dr Edgewater, FL | 3.0 | 2.0 | 1269 | $2,400 | $1.89 | 23d | 1 | 0.68mi |
| 120 Hardin Pl Edgewater, FL | 3.0 | 2.0 | 1455 | $2,075 | $1.43 | 14d | 1 | 0.80mi |
| 2219 Umbrella Tree Dr Edgewater, FL | 3.0 | 2.0 | 1446 | $2,300 | $1.59 | 23d | 1 | 0.92mi |
| 1822 Royal Palm Dr Edgewater, FL | 3.0 | 2.0 | 1400 | $1,620 | $1.16 | 14d | 1 | 0.94mi |
| 121 W Marion Ave Edgewater, FL | 2.0 | 2.0 | 1020 | $1,250 | $1.23 | 23d | 1 | 0.96mi |
| 2827 Royal Palm Dr Edgewater, FL | 3.0 | 2.0 | 1212 | $1,900 | $1.57 | 23d | 1 | 1.19mi |
| 3120 Juniper Dr Edgewater, FL | 3.0 | 2.0 | 1440 | $2,150 | $1.49 | 23d | 1 | 1.46mi |
Listing history 22 events
-
2026-06-18days on market $216,100 Active 178 DOM
-
2026-06-17days on market $216,100 Active 177 DOM
-
2026-06-16days on market $216,100 Active 176 DOM
-
2026-06-15days on market $216,100 Active 175 DOM
-
2026-06-14days on market $216,100 Active 173 DOM
-
2026-06-10days on market $216,100 Active 170 DOM
-
2026-06-09days on market $216,100 Active 169 DOM
-
2026-06-08days on market $216,100 Active 168 DOM
-
2026-06-07days on market $216,100 Active 167 DOM
-
2026-06-05pricedays on market $216,100 Active 164 DOM
-
2026-06-03days on market $219,100 Active 163 DOM
-
2026-06-03days on market $219,100 Active 162 DOM
-
2026-06-01days on market $219,100 Active 161 DOM
-
2026-05-31days on market $219,100 Active 160 DOM
-
2026-05-31days on market $219,100 Active 159 DOM
-
2026-03-05price $219,100 356-char remark
Show marketing remark (356 chars)
6,400 watt solar panels $29.91 electric bill!! great neighborhood close to river and a few miles to beach flea market winn dixie ! publix grocery . fenced yard in back storage building. no washer dryer !solar system comes wt it available jan 26 buy wt 1% dw wt rocket mortgage they give you an additional 2% , move in ready. may accept reasonable offers
-
2026-02-15price $221,100 356-char remark
Show marketing remark (356 chars)
6,400 watt solar panels $29.91 electric bill!! great neighborhood close to river and a few miles to beach flea market winn dixie ! publix grocery . fenced yard in back storage building. no washer dryer !solar system comes wt it available jan 26 buy wt 1% dw wt rocket mortgage they give you an additional 2% , move in ready. may accept reasonable offers
-
2026-01-27price $222,222 356-char remark
Show marketing remark (356 chars)
6,400 watt solar panels $29.91 electric bill!! great neighborhood close to river and a few miles to beach flea market winn dixie ! publix grocery . fenced yard in back storage building. no washer dryer !solar system comes wt it available jan 26 buy wt 1% dw wt rocket mortgage they give you an additional 2% , move in ready. may accept reasonable offers
-
2026-01-11price $224,000 356-char remark
Show marketing remark (356 chars)
6,400 watt solar panels $29.91 electric bill!! great neighborhood close to river and a few miles to beach flea market winn dixie ! publix grocery . fenced yard in back storage building. no washer dryer !solar system comes wt it available jan 26 buy wt 1% dw wt rocket mortgage they give you an additional 2% , move in ready. may accept reasonable offers
-
2025-12-22$225,000 Active 356-char remark
Show marketing remark (356 chars)
6,400 watt solar panels $29.91 electric bill!! great neighborhood close to river and a few miles to beach flea market winn dixie ! publix grocery . fenced yard in back storage building. no washer dryer !solar system comes wt it available jan 26 buy wt 1% dw wt rocket mortgage they give you an additional 2% , move in ready. may accept reasonable offers
-
2018-10-29soldstatus $108,000
-
2008-07-16soldstatus $85,000
ⓘ Source: listings_history table (triggers on properties + properties_extension) + one-shot
backfill from property_details.listing_events for pre-trigger history.
Tax reassessment forecast FL · Resets to sale price
- Current annual tax
- $1,339 · $112/mo
- Projected year-2 tax
- $1,794 · $149/mo
- Expected delta
- +$455/yr (+$38/mo · 34.0%)
ⓘ Screening estimate from a state-policy table — verify with the county assessor before closing.
Climate risk First Street
- Flood 3/10 Moderate FEMA zone X (unshaded) · 20% chance over 30 yrs
- Wildfire 3/10 Moderate
- Heat 10/10 Extreme 8 d/yr ≥105°F today · 23 d/yr by 30 yrs out
- Wind 10/10 Extreme 99% chance of damaging wind over 30 yrs
- Air quality 2/10 Low 1 unhealthy d/yr today · 1 by 30 yrs out
Nearby sold comps map
Loading sold comps map…
Walkable amenities ~0.75 mi
Loading nearby amenities…
Taxation est. · year 1
- Rental income
- $24,628
- − Mortgage interest
- −$12,105
- − Property taxes
- −$1,339
- − Insurance
- −$1,080
- − Repairs & maintenance
- −$1,970
- − Management
- −$1,970
- − Depreciation
- −$6,287
- Taxable loss
- −$123
- Est. tax savings @ 24.0%
- +$29
- After-tax cash flow
- $3,468/yr
For passive investors: Depreciation is non-cash, so a rental often shows a tax loss while cash-flowing — sheltering income. Rental losses are passive: they offset passive income freely, and up to $25,000/yr can offset ordinary (W-2) income if you actively participate and your MAGI is under $100k (phasing out to $0 by $150k); unused losses carry forward. On sale, claimed depreciation is recaptured at up to 25%, and gains may owe capital-gains tax (a 1031 exchange can defer both). Figures are a year-1 estimate at your 24.0% rate — not tax advice; consult a CPA.
Schools (NCES district)
- District
- Volusia
- NCES district ID
- 1201920
- Math proficiency
- 44% ▼ -9.00%
- Reading proficiency
- 49% ▼ -3.00%
- Median HH income
- $42,946
- Composite
- 39.2/100
- National rank
- #4019
- State rank
- #47 of 73 in FL
Livability — Edgewater
- Score
- 72/100
- State rank
- #329
- US rank
- #5753
Category grades
Schools grade is shown separately in the Schools card above.
Census & demographics
- Census place
- Edgewater, FL
- County
- Volusia County · 556,871 people
- City population
- 18,726
- Metro
- Deltona-Daytona Beach-Ormond Beach, FL
- Population (ZIP)
- 18,726
- Household income
- $63,936
- Rent vs Own
- Severe rent burden
- 161.0
Population outlook (Volusia County) Hauer SSP2
- Today (2025)
- 572,749 people
- By 2030
- 598,695 · +4.5%
- By 2040
- 644,880 · +12.6%
- By 2050
- 681,451 · +19.0%
- By 2075
- 759,957 · +32.7%
- By 2100
- 778,902 · +36.0%
Race, ethnicity, and origin ACS 2023
- Neighborhood character
- Predominantly White (90%)
- Race & ethnicity
- White 90% Hispanic / Latino 4% Two or more races 3% Black 2%
- Common ancestry
- Romanian 6% Lithuanian 2% Slovak 1%
- Foreign-born
- 4% · Canada
- Languages at home
- 94% English-only · Spanish 2% Other Indo-European 2% German/W. Germanic 1%
Political lean MEDSL · Volusia
- 2024 margin
- Strong R (+21.8) · D 38.7% · R 60.5%
- 2008→2024 swing
- -27.4pp toward R · 2008: 5.7pp · 2024: -21.8pp
- All cycles
- 2024: R+21.8 2020: R+14.1 2016: R+13.1 2012: R+1.2 2008: D+5.7
Not yet ingested
- Civics
- —
Market trends
- HPI YoY
- ▼ -80.12%
- Current HPI
- 337.8301
- Rent YoY
- —
- Metro
- Deltona-Daytona Beach-Ormond Beach, FL
- State GDP YoY
- ▲ 3.28%
- F500 in state
- 36
Industry mix (Fortune 500 HQ in FL)
| Industry | F500 HQs | Revenue |
|---|---|---|
| Industrial Technology | 2 | $29B |
|
||
| Insurance | 2 | $17B |
|
||
| Retail | 1 | $60B |
|
||
| Technology Distribution | 1 | $58B |
|
||
| Homebuilding | 1 | $35B |
|
||
| Technology Manufacturing | 1 | $35B |
|
||
Price history
+157.8% since first listed7 events — show timeline
- 2026-03-05 Price Changed $219,100 ForSaleByOwner.com
- 2026-02-15 Price Changed $221,100 ForSaleByOwner.com
- 2026-01-27 Price Changed $222,222 ForSaleByOwner.com
- 2026-01-11 Price Changed $224,000 ForSaleByOwner.com
- 2025-12-22 Listed $225,000 ForSaleByOwner.com
- 2018-10-29 Sold (Public Records) $108,000 Public Records
- 2008-07-16 Sold (Public Records) $85,000 Public Records
Property tax history
-0.6%/yrLatest (2025): $1,339 · +1.4% YoY. Source: county tax records.
Cash-flow waterfall
monthlySold comps — $/sqft
last 12 mo · ≤1 miLoading sold comps…