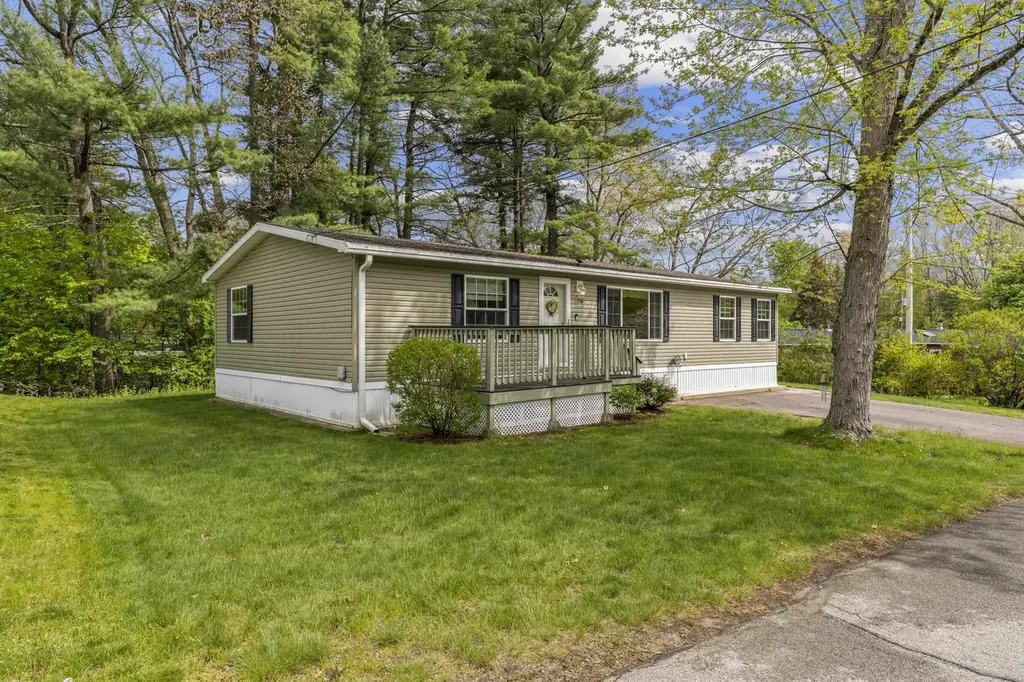
16 Eric Ave · Nashua, NH
Flood risk 1/10 · Minimal
- FEMA flood zone
- X (unshaded)
- Chance of flooding over 30 yrs
- 0.0%
- Est. flood insurance / yr
- $507 – $1,088
Fire risk 2/10 · Minimal
- Est. fire insurance / yr
- $507 – $941
Heat risk 4/10 · Minor
- Hot days now (above 97°F)
- 7 days/yr
- Hot days in 30 yrs
- 15 days/yr
Wind risk 6/10 · Moderate
- Chance of severe wind over 30 yrs
- 27.0%
Air-quality risk 2/10 · Minimal
- Unhealthy air days now
- 0 days/yr
- Unhealthy air days in 30 yrs
- 2 days/yr
Risk factors via First Street. Map © Google.
Why this score? — see what drove the D- grade
The composite is a weighted blend of 9 inputs, each scored 0–100. Each bar is that input's sub-score; the figure is the points it added to the 100-point composite (weight × sub-score).
- Cash flow +10.5/30.0
- ARV discount +7.5/15.0
- 1% rule +5.3/10.0
- Livability +4.2/5.0
- Rent growth +3.1/5.0
- Schools +3.1/10.0
- DSCR +3.0/10.0
- Condition / age +2.5/5.0
- Appreciation +0.0/10.0
$299,999
🖨 Deal sheet (PDF) 📄 Offer letter ✓ Due diligence
Listing remarks MLS
Brand new 2 Brm home with den. Lot's of upgrades incl. residential drywall interior, upgraded cabinets, carpet, windows and insulations. Fully applianced (black)kitchen, with cherry cabs. Non-age restricted park with easy commuter access to Exit 5. We have the ability to do a semi-custom 3 brm home on the lot across the street too. listing broker, is an officer and employee of Rodgers Mobile Home Park, Inc. , and thus has an interest in this property.
Key facts
- Dedicated pantry
- Whole home generator
- Gas stove
Tags
Property features AI
Finance
- HOA & community: Monthly park/association fee of $530; Fee includes plowing, sewer, trash, water, park fees, and park rent
Exterior
- Parking: Paved driveway
- Utilities: Public water; Community or private sewer; 110V electric with generator; High-speed internet available; Cable available
- Home design: Manufactured home (Manuf/Mobile); Existing structure; Shingle (asphalt) roof; Built in 2013
- Construction: Wood frame construction; Vinyl siding
- Exterior features: Paved driveway; Mobile home park lot (leased); Located in Rodgers Mobile Home Park (park approved)
Interior
- Kitchen: Dishwasher; Microwave; Gas range / stove; Refrigerator
- Bathrooms: Two full bathrooms
- Heating & cooling: Central air conditioning; Propane forced-air heating
- Interior features: Five total rooms; Two full bathrooms
- Laundry & utility: Water heater
Neighborhood map
What this means for you Summary
Snapshot
- This is a 3-bed/2.5-bath manufactured listed at $300k.
Deal economics
- At list price, monthly cash flow is $-154 ($-2k/yr) — negative.
- To cash-flow at today's rent, offer at most $273k (9.1% below list).
- Meets the 1% rule at list price ($3k rent vs $300k).
- Recommended offer: $273k (9.1% below list) — sets the bar for cash-flow.
- Cap rate 5.7% vs local median 2.9% in Nashua — top-decile yield for the area; either an underpriced asset or a hidden risk that comps aren't pricing in. Stress-test before assuming the spread holds.
Location & tenants
- Location reads 83/100 on livability (#11 in NH, #983 nationally) — a professional / high-income tenant draw. Strengths: commute A+, housing A+, health & safety A+; Watch: amenities D+.
- Nashua School District (urban): math 27% / reading 40% proficiency, ranked #77 of 98 in NH (top 79%) — families likely to look elsewhere, expect single-tenant / working-renter base with shorter leases.
- Zoned schools: New Searles School (math 54% / reading 54%, grade C, #62 of 263 statewide, top 30%, 307 students, 23% FRL); Elm Street Middle School (math 19% / reading 34%, grade F, #79 of 96 statewide, top 82%, 874 students, 42% FRL); Nashua High School South (math 47% / reading 65%, grade C, #26 of 90 statewide, top 28%, 1,743 students, 30% FRL) — zoned schools at 32% FRL track the district average.
- Zoned-school proficiency averages 46% at this address vs 34% district-wide (+12 pts) — the actual schools serving this property are materially stronger than the Nashua School District average implies; a family-tenant draw the district grade alone would hide.
- Market conditions: Rents rising (+2.5%/yr); 103 active listings in the ZIP; solid renter incomes; 981 units permitted in Hillsborough County in 2024 (381 in 5+ unit buildings).
- This rent runs 34% of the median local income ($108k/yr) — at the standard rent-burdened threshold; future hikes will face affordability resistance.
Forward outlook
- Local home prices are declining (-3.0%/yr); year-one equity from $2k of loan paydown is wiped out by about $9k of value loss. Plan a longer hold.
- Hillsborough County population projected to shrink 8% by 2050 — rents likely to lag national; underwrite the cash flow, not the appreciation.
Negotiation context
- It's been on market 33 days — a 3% lower offer ($291k) is reasonable based on typical stale-listing flexibility.
- 2 sale attempts since 13y ago with the ask held roughly flat each time — persistent listings suggest the price (not the market) is what's stuck; bring a comps-based counter.
- Current owner paid $106k; list at $300k implies a 182% gain — meaningful room to come down on a strong offer.
Risks & watch-outs
- Climate carrying-cost: major wind risk, 27% chance of damaging wind over 30y — expect insurance premiums to compound above CPI over the hold.
Questions for the listing agent
- What do current leases actually rent for vs. the listed asking? Can we see a recent rent roll and the last 12 months of T-12 income?
- It's been on market 33 days. Have you received any prior offers? Is the seller open to a 9% concession, seller financing, or rate buy-down credit?
- What does the HOA fee cover, when was the last increase, and are there any pending special assessments or reserve-fund shortfalls?
- Is there a deadline driving the sale (1031 exchange, divorce, estate, relocation)? That informs how much negotiation room exists.
- Schools are B-rated — typically a magnet for longer-tenancy family renters. What's the average tenant stay here, and is there a school-zone premium baked into asking?
- The area grade is low — what's the realistic commute time and amenity access for the typical tenant pool here? Any planned neighborhood developments (good or bad) we should know about?
- What's the average days-on-market for RENTAL listings here right now (not sales)? A rising rental-DOM trend means longer vacancies and softer asking-rent achievability than the comps imply.
- What's the recent tenant-quality profile in this submarket — average credit score on applications, eviction rate, late-payment / NSF rate, and stable-employment percentage? A property-management company in the area should have these aggregated.
- How much new for-sale + rental construction is in the pipeline within 1–3 miles? Heavy new supply typically softens prices + rents 12–24 months out; constrained supply supports both.
Investment metrics
- 1% rule
- 1.03% ✓
- Cap rate
- 5.68%
- Cash-on-cash
- -2.20%
- DSCR
- 0.90
- GRM
- 8.1
CMA / ARV
- ARV (on-the-fly)
- $300,144
- Comps found
- 5
Show comp detail 5 sales within ~0.75 mi
| Address | Dist | Beds/Ba | Sqft | Sold | Price | $/sf | Match |
|---|---|---|---|---|---|---|---|
| 21 Shawn Ave | 0.11mi | 3/2.0 | 1,319 (-2%) | 3mo | $318,000 | $241 | 86 |
| 17 Eric Ave #1517 | 0.07mi | 3/2.0 | 1,352 (0%) | 12mo | $300,000 | $222 | 85 |
| 4 Ponderosa Ave | 0.04mi | 3/2.0 | 1,390 (+3%) | 11mo | $274,900 | $198 | 82 |
| 14 Eric Ave | 0.01mi | 3/2.0 | 1,296 (-4%) | 12mo | $305,000 | $235 | 81 |
| 13 Satin Ave | 0.10mi | 3/1.5 | 1,248 (-8%) | 11mo | $128,500 | $103 | 70 |
Match score weights: distance 35% · size 25% · config 20% · recency 20%. Top-matched comps best support the ARV.
Projected returns pro-forma
-3.0% appreciation · 2.53% rent growth · sell at horizon
- IRR
- -20.5%
- Equity multiple
- 0.29×
- Total profit
- $-59,513
- Equity at exit
- $44,731
- IRR
- -14.6%
- Equity multiple
- 0.18×
- Total profit
- $-68,879
- Equity at exit
- $25,938
Cash invested: $84,000 (down + closing). Projections, not guarantees.
Landlord ↔ Tenant lean methodology
- Overall (STATE)
- 56 Moderately Landlord-Leaning
- State New Hampshire
- 56 Moderately Landlord-Leaning · D+1
- County
- — inherits STATE
- City
- — inherits STATE
ZIP-level market 03062
- Rents YoY
- 2.5%
- Active inventory
- 103
- Price-to-rent
- 8.1×
Monthly cashflow live
- Estimated rent
- $3,091 medium interval (Pro) →
- Mortgage (P&I)
- −$1,573
- Tax from tax record
- −$368 /mo · $4,413/yr
- Insurance
- −$125
- HOA
- −$530
- Vacancy / Maint / Mgmt
- −$649
- Net cashflow
- $-154
Break-even live
Sensitivity live
| Price | -10% $16 | -5% $-69 | +0% $-154 | +5% $-239 | +10% $-324 |
|---|---|---|---|---|---|
| Rent | -10% $-398 | -5% $-276 | +0% $-154 | +5% $-32 | +10% $90 |
| Rate | -1.0pp $-3 | -0.5pp $-78 | base $-154 | +0.5pp $-232 | +1.0pp $-311 |
UW: 25.0% down · 7.5% · 30yr · 1.5% tax · 5.0% vac · 8.0% maint · 8.0% mgmt
Financing live
Cash to close
- Down payment
- $75,000
- Closing costs
- $9,000
- Reserves months
- —
- Total cash needed
- —
Loan-product check · same deal, 3 products live
Conventional
25% down · 7.5% · 30yr
- Down + closing
- —
- Monthly P&I
- —
- Monthly cashflow
- —
- DSCR
- —
- Eligible?
- —
Personal DTI + credit; lowest rate.
DSCR
20% down · 8.5% · 30yr
- Down + closing
- —
- Monthly P&I
- —
- Monthly cashflow
- —
- DSCR
- —
- Eligible?
- —
No personal income docs; deal must DSCR.
Hard money
10% down · 12.0% · 12mo
- Down + closing
- —
- Monthly P&I
- —
- Monthly cashflow
- —
- DSCR
- —
- Eligible?
- —
Short-term bridge; refi at stabilization.
HOA detail
- Monthly dues
- $530 · $6,360/yr
Listing history 18 events
-
2026-06-21days on market $299,999 Active 33 DOM
-
2026-06-18days on market $299,999 Active 30 DOM
-
2026-06-17days on market $299,999 Active 29 DOM
-
2026-06-16days on market $299,999 Active 28 DOM
-
2026-06-15days on market $299,999 Active 27 DOM
-
2026-06-14days on market $299,999 Active 25 DOM
-
2026-06-10days on market $299,999 Active 22 DOM
-
2026-06-09days on market $299,999 Active 21 DOM
-
2026-06-08days on market $299,999 Active 20 DOM
-
2026-06-07days on market $299,999 Active 19 DOM
-
2026-06-03days on market $299,999 Active 15 DOM
-
2026-06-02days on market $299,999 Active 14 DOM
-
2026-06-01days on market $299,999 Active 13 DOM
-
2026-05-31days on market $299,999 Active 12 DOM
-
2026-05-30days on market $299,999 Active 11 DOM
-
2026-05-19$299,999 Active
-
2013-09-09soldstatus $106,500 455-char remark
Show marketing remark (455 chars)
Brand new 2 Brm home with den. Lot's of upgrades incl. residential drywall interior, upgraded cabinets, carpet, windows and insulations. Fully applianced (black)kitchen, with cherry cabs. Non-age restricted park with easy commuter access to Exit 5. We have the ability to do a semi-custom 3 brm home on the lot across the street too. listing broker, is an officer and employee of Rodgers Mobile Home Park, Inc. , and thus has an interest in this property.
-
2013-06-21$106,900 455-char remark
Show marketing remark (455 chars)
Brand new 2 Brm home with den. Lot's of upgrades incl. residential drywall interior, upgraded cabinets, carpet, windows and insulations. Fully applianced (black)kitchen, with cherry cabs. Non-age restricted park with easy commuter access to Exit 5. We have the ability to do a semi-custom 3 brm home on the lot across the street too. listing broker, is an officer and employee of Rodgers Mobile Home Park, Inc. , and thus has an interest in this property.
ⓘ Source: listings_history table (triggers on properties + properties_extension) + one-shot
backfill from property_details.listing_events for pre-trigger history.
Tax reassessment forecast NH · Partial reset (capped growth)
- Current annual tax
- $4,413 · $368/mo
- Projected year-2 tax
- $5,476 · $456/mo
- Expected delta
- +$1,063/yr (+$89/mo · 24.1%)
ⓘ Screening estimate from a state-policy table — verify with the county assessor before closing.
Climate risk First Street
- Flood 1/10 Low FEMA zone X (unshaded) · 0% chance over 30 yrs
- Wildfire 2/10 Low
- Heat 4/10 Moderate 7 d/yr ≥97°F today · 15 d/yr by 30 yrs out
- Wind 6/10 Major 27% chance of damaging wind over 30 yrs
- Air quality 2/10 Low 0 unhealthy d/yr today · 2 by 30 yrs out
Nearby sold comps map
Loading sold comps map…
Walkable amenities ~0.75 mi
Loading nearby amenities…
Taxation est. · year 1
- Rental income
- $37,092
- − Mortgage interest
- −$16,805
- − Property taxes
- −$4,413
- − Insurance
- −$1,500
- − Repairs & maintenance
- −$2,967
- − Management
- −$2,967
- − HOA
- −$6,360
- − Depreciation
- −$8,727
- Taxable loss
- −$6,647
- Est. tax savings @ 24.0%
- +$1,595
- After-tax cash flow
- $-254/yr
For passive investors: Depreciation is non-cash, so a rental often shows a tax loss while cash-flowing — sheltering income. Rental losses are passive: they offset passive income freely, and up to $25,000/yr can offset ordinary (W-2) income if you actively participate and your MAGI is under $100k (phasing out to $0 by $150k); unused losses carry forward. On sale, claimed depreciation is recaptured at up to 25%, and gains may owe capital-gains tax (a 1031 exchange can defer both). Figures are a year-1 estimate at your 24.0% rate — not tax advice; consult a CPA.
Schools (NCES district)
- District
- Nashua School District
- NCES district ID
- 3304980
- Math proficiency
- 27% ▼ -12.00%
- Reading proficiency
- 40% ▼ -6.00%
- Median HH income
- $66,393
- Composite
- 30.62/100
- National rank
- #6189
- State rank
- #77 of 98 in NH
Livability — Nashua
- Score
- 83/100
- State rank
- #11
- US rank
- #983
Category grades
Schools grade is shown separately in the Schools card above.
Census & demographics
- Census place
- Nashua, NH
- County
- Hillsborough County · 309,362 people
- City population
- 91,294
- Metro
- Manchester-Nashua, NH
- Population (ZIP)
- 29,441
- Household income
- $107,540
- Rent vs Own
- Severe rent burden
- 658.0
Population outlook (Hillsborough County) Hauer SSP2
- Today (2025)
- 412,771 people
- By 2030
- 410,974 · -0.4%
- By 2040
- 399,959 · -3.1%
- By 2050
- 381,542 · -7.6%
- By 2075
- 339,855 · -17.7%
- By 2100
- 289,270 · -29.9%
Race, ethnicity, and origin ACS 2023
- Neighborhood character
- Predominantly White (74%)
- Race & ethnicity
- White 74% Asian 15% Two or more races 5% Hispanic / Latino 5% Black 2%
- Hispanic origin (detail)
- Puerto Rican 2% Dominican 2%
- Common ancestry
- Lithuanian 9% Slovak 4% Romanian 3%
- Foreign-born
- 19% · Canada, China, Vietnam
- Languages at home
- 79% English-only · Other Asian/Pacific 6% Other Indo-European 5% Spanish 3%
Political lean MEDSL · Hillsborough
- 2024 margin
- Toss-up / Even · D 50.9% · R 48.0% · Other 1.0%
- 2008→2024 swing
- -0.9pp no change · 2008: 3.8pp · 2024: 2.9pp
- All cycles
- 2024: D+2.9 2020: D+7.7 2016: R+0.2 2012: D+1.7 2008: D+3.8
Not yet ingested
- Civics
- —
Market trends
- HPI YoY
- ▼ -432.67%
- Current HPI
- 309.5007
- Rent YoY
- ▲ 2.53%
- Metro
- Manchester-Nashua, NH
- State GDP YoY
- —
- F500 in state
- 0
Price history
+180.6% since first listed3 events — show timeline
- 2026-05-19 Listed $299,999 PrimeMLS
- 2013-09-09 Sold (MLS) $106,500 PrimeMLS
- 2013-06-21 Listed $106,900 PrimeMLS
Property tax history
+5.2%/yrLatest (2025): $4,413 · +5.9% YoY. Source: county tax records.
Cash-flow waterfall
monthlySold comps — $/sqft
last 12 mo · ≤1 miLoading sold comps…