18208 Manera Way · Oklahoma City, OK
Flood risk 1/10 · Minimal
- FEMA flood zone
- X (unshaded)
- Chance of flooding over 30 yrs
- 0.0%
- Est. flood insurance / yr
- $507 – $1,088
Fire risk 3/10 · Minor
- Est. fire insurance / yr
- $2,463 – $4,575
Heat risk 6/10 · Moderate
- Hot days now (above 108°F)
- 7 days/yr
- Hot days in 30 yrs
- 20 days/yr
Wind risk 2/10 · Minimal
- Chance of severe wind over 30 yrs
- 4.0%
Air-quality risk 2/10 · Minimal
- Unhealthy air days now
- 1 days/yr
- Unhealthy air days in 30 yrs
- 1 days/yr
Risk factors via First Street. Map © Google.
Why this score? — see what drove the D- grade
The composite is a weighted blend of 9 inputs, each scored 0–100. Each bar is that input's sub-score; the figure is the points it added to the 100-point composite (weight × sub-score).
- Cash flow +10.6/30.0
- ARV discount +7.5/15.0
- Schools +4.1/10.0
- Livability +4.0/5.0
- 1% rule +3.5/10.0
- DSCR +3.0/10.0
- Rent growth +2.8/5.0
- Condition / age +2.5/5.0
- Appreciation +0.0/10.0
$224,900
🖨 Deal sheet (PDF) 📄 Offer letter ✓ Due diligence
Listing remarks
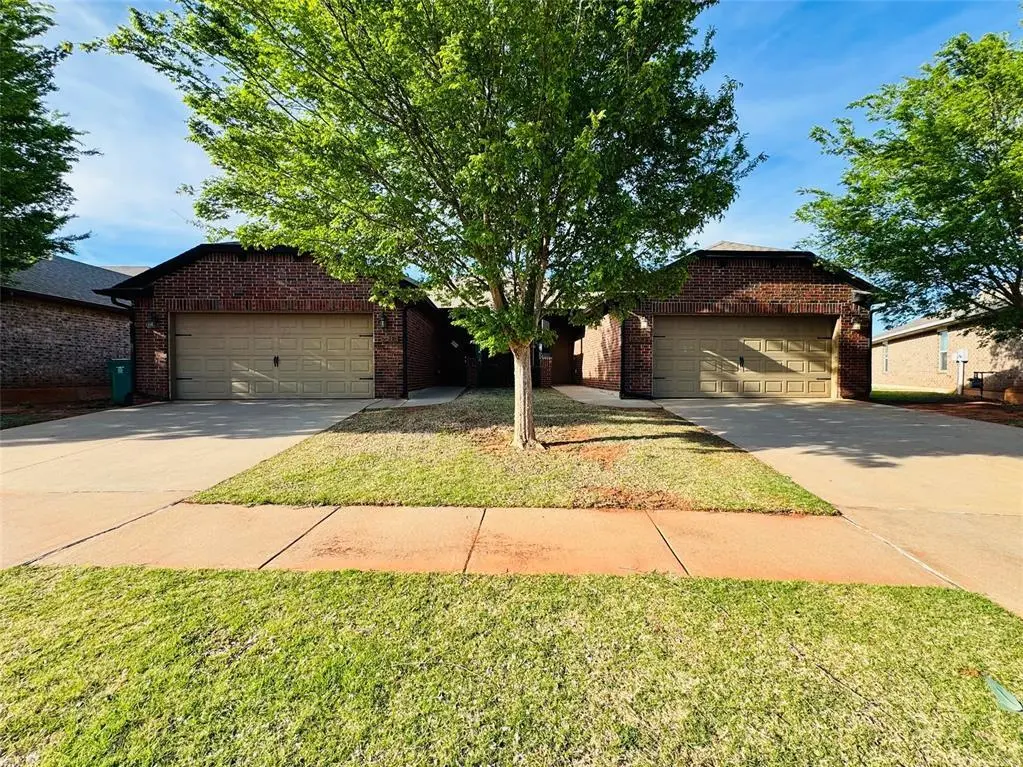
Well-maintained 3 bed, 2 bath duplex in the highly desirable Deer Creek area! Built just 4 years ago, this home features tall ceilings, an open layout, and a split bedroom design with the primary suite tucked away for added privacy. Large windows bring in great natural light, creating a bright and inviting feel throughout. Spacious closets and ample cabinet storage make the home both functional and comfortable. HOA covers yard maintenance and includes access to neighborhood parks and a splash pad for easy, low-maintenance living. Located in a fast-growing area close to shopping, dining, and everyday conveniences—move-in ready and a great place to call home!
Key facts
- Split bedroom design
- Primary suite
- Splash pad
Tags
Property features AI
Finance
- Other: Homestead exemption: yes
- Financial info: Loan qualification available; Not assumable
- HOA & community: Mandatory association dues; Association fee: $795 (includes greenbelt and common area maintenance)
Exterior
- Parking: 2-car garage
- Utilities: No storm shelter; Flood insurance not required
- Home design: Residential half duplex; One-level entry
- Construction: Brick and frame construction; Composition roof; Slab foundation; Built as existing property
- Exterior features: Covered patio; Covered porch; Interior lot
Interior
- Kitchen: Dishwasher; Disposal; Microwave; Gas range/oven
- Bedrooms: 3 bedrooms
- Bathrooms: 2 full bathrooms
- Interior features: Dishwasher; Disposal; Microwave; Kitchen external exhaust; Smoke alarm; Garage door lift
- Laundry & utility: Garage door lift (mechanical feature)
Neighborhood map
What this means for you Summary
Snapshot
- This is a 3-bed/2.0-bath townhouse listed at $225k.
Deal economics
- At list price, monthly cash flow is $-112 ($-1k/yr) — negative.
- To cash-flow at today's rent, offer at most $205k (8.8% below list).
- To meet the 1% rule (rent ≥ 1% of price), the offer needs to be $192k (14.7% below list).
- Recommended offer: $192k (14.7% below list) — sets the bar for 1% rule.
- Cap rate 5.7% vs local median 3.7% in Oklahoma City — top-decile yield for the area; either an underpriced asset or a hidden risk that comps aren't pricing in. Stress-test before assuming the spread holds.
Location & tenants
- Location reads 80/100 on livability (#3 in OK, #1,635 nationally) — a professional / high-income tenant draw. Strengths: amenities A+, commute A+, cost of living A+; Watch: crime F.
- Deer Creek (rural): math 41% / reading 44% proficiency, ranked #4 of 270 in OK (top 2%) — families likely to look elsewhere, expect single-tenant / working-renter base with shorter leases; only 7% free/reduced lunch — higher-income household profile.
- Zoned schools: Grove Valley Es (math 42% / reading 32%, grade F, #132 of 845 statewide, top 19%, 554 students, 0% FRL); Deer Creek Hs (math 39% / reading 51%, grade D-, #13 of 447 statewide, top 3%, 2,036 students, 0% FRL).
- Market conditions: Rents rising (+1.2%/yr); 626 active listings in the ZIP; 40 comparable units currently listed for rent nearby; rentals leasing fast (median 5d on market — plan ~1-2 weeks tenant-placement turnaround); high-income renter base; 5,365 units permitted in Oklahoma County in 2024 (569 in 5+ unit buildings).
Forward outlook
- Local home prices are declining (-3.0%/yr); year-one equity from $2k of loan paydown is wiped out by about $7k of value loss. Plan a longer hold.
- Oklahoma County population projected at +41% by 2050 — long-run rental-demand tailwind backs the buy-and-hold thesis.
Negotiation context
- It's been on market 58 days — a 3% lower offer ($218k) is reasonable based on typical stale-listing flexibility.
Risks & watch-outs
- Climate carrying-cost: extreme-heat days projected 7→20/yr by 2055 (HVAC capex compounding) — expect insurance premiums to compound above CPI over the hold.
Questions for the listing agent
- What do current leases actually rent for vs. the listed asking? Can we see a recent rent roll and the last 12 months of T-12 income?
- It's been on market 58 days. Have you received any prior offers? Is the seller open to a 15% concession, seller financing, or rate buy-down credit?
- What does the HOA fee cover, when was the last increase, and are there any pending special assessments or reserve-fund shortfalls?
- Is there a deadline driving the sale (1031 exchange, divorce, estate, relocation)? That informs how much negotiation room exists.
- Schools are F-rated, which usually means shorter tenancies and higher turnover. Who's the typical renter profile here, and what's been the actual vacancy rate?
- Crime grade is F in this area — have there been break-ins, vandalism, or insurance claims at this property in the last 3 years? What carrier currently insures it and at what premium?
- The area grade is low — what's the realistic commute time and amenity access for the typical tenant pool here? Any planned neighborhood developments (good or bad) we should know about?
- What's the average days-on-market for RENTAL listings here right now (not sales)? A rising rental-DOM trend means longer vacancies and softer asking-rent achievability than the comps imply.
- What's the recent tenant-quality profile in this submarket — average credit score on applications, eviction rate, late-payment / NSF rate, and stable-employment percentage? A property-management company in the area should have these aggregated.
- How much new for-sale + rental construction is in the pipeline within 1–3 miles? Heavy new supply typically softens prices + rents 12–24 months out; constrained supply supports both.
Investment metrics
- 1% rule
- 0.85% ✗
- Cap rate
- 5.69%
- Cash-on-cash
- -2.14%
- DSCR
- 0.90
- GRM
- 9.8
CMA / ARV
No comps found within radius.
Projected returns pro-forma
-3.0% appreciation · 1.21% rent growth · sell at horizon
- IRR
- -21.9%
- Equity multiple
- 0.26×
- Total profit
- $-46,903
- Equity at exit
- $33,533
- IRR
- -21.0%
- Equity multiple
- -0.00×
- Total profit
- $-63,173
- Equity at exit
- $19,445
Cash invested: $62,972 (down + closing). Projections, not guarantees.
Landlord ↔ Tenant lean methodology
- Overall (STATE)
- 83 Strongly Landlord-Friendly
- State Oklahoma
- 83 Strongly Landlord-Friendly · R+20
- County
- — inherits STATE
- City
- — inherits STATE
ZIP-level market 73012
- Home prices YoY
- -17.9%
- Rents YoY
- 1.2%
- Active inventory
- 626
- Price-to-rent
- 9.8×
Monthly cashflow live
- Estimated rent
- $1,918 high interval (Pro) →
- Mortgage (P&I)
- −$1,179
- Tax from tax record
- −$288 /mo · $3,462/yr
- Insurance
- −$94
- HOA
- −$66
- Vacancy / Maint / Mgmt
- −$403
- Net cashflow
- $-112
Break-even live
Sensitivity live
| Price | -10% $15 | -5% $-48 | +0% $-112 | +5% $-176 | +10% $-239 |
|---|---|---|---|---|---|
| Rent | -10% $-264 | -5% $-188 | +0% $-112 | +5% $-36 | +10% $39 |
| Rate | -1.0pp $1 | -0.5pp $-55 | base $-112 | +0.5pp $-170 | +1.0pp $-230 |
UW: 25.0% down · 7.5% · 30yr · 1.5% tax · 5.0% vac · 8.0% maint · 8.0% mgmt
Financing live
Cash to close
- Down payment
- $56,225
- Closing costs
- $6,747
- Reserves months
- —
- Total cash needed
- —
Loan-product check · same deal, 3 products live
Conventional
25% down · 7.5% · 30yr
- Down + closing
- —
- Monthly P&I
- —
- Monthly cashflow
- —
- DSCR
- —
- Eligible?
- —
Personal DTI + credit; lowest rate.
DSCR
20% down · 8.5% · 30yr
- Down + closing
- —
- Monthly P&I
- —
- Monthly cashflow
- —
- DSCR
- —
- Eligible?
- —
No personal income docs; deal must DSCR.
Hard money
10% down · 12.0% · 12mo
- Down + closing
- —
- Monthly P&I
- —
- Monthly cashflow
- —
- DSCR
- —
- Eligible?
- —
Short-term bridge; refi at stabilization.
Rent comps 40 comps
| Address | Beds | Baths | Sqft | Rent | $/sqft | DOM | Units | Dist |
|---|---|---|---|---|---|---|---|---|
| 2924 NW 181st St Edmond, OK | 3.0 | 2.0 | 1558 | $1,775 | $1.14 | 24d | 1 | 0.20mi |
| 2717 NW 178th St Edmond, OK | 1.0–3.0 | 1.0–2.0 | 943 | $1,749 | $1.85 | 2d | 15 | 0.20mi |
| 18301 Montoro Way Edmond, OK | 3.0 | 2.0 | 1556 | $1,695 | $1.09 | 2d | 1 | 0.32mi |
| 3005 NW 183rd St Edmond, OK | 3.0 | 2.0 | 1320 | $1,650 | $1.25 | 3d | 1 | 0.39mi |
| 18209 Bridlington Dr Edmond, OK | 3.0 | 2.0 | 1568 | $1,700 | $1.08 | 24d | 1 | 0.42mi |
| 18509 Agua Dr Edmond, OK | 3.0 | 2.0 | 1595 | $1,800 | $1.13 | 2d | 1 | 0.42mi |
| 18321 Groveton Blvd Edmond, OK | 3.0 | 2.0 | 1739 | $2,200 | $1.27 | 17d | 1 | 0.44mi |
| 18401 Haslemere Ln Edmond, OK | 3.0 | 2.0 | 1794 | $1,945 | $1.08 | 5d | 1 | 0.53mi |
| 18613 Vivo Dr Edmond, OK | 3.0 | 2.0 | 1682 | $1,995 | $1.19 | 20d | 1 | 0.59mi |
| 2344 Roca Dr Edmond, OK | 3.0 | 2.0 | 1213 | $1,650 | $1.36 | 12d | 1 | 0.63mi |
| 18217 Autumn Grove Dr Edmond, OK | 3.0 | 2.0 | 1543 | $1,800 | $1.17 | 20d | 1 | 0.66mi |
| 2800 NW 192nd St Edmond, OK | 1.0–2.0 | 1.0–2.0 | 1118 | $2,270 | $2.03 | 2d | 11 | 0.72mi |
| 18216 Austin Ct Edmond, OK | 3.0 | 2.0 | 1542 | $1,995 | $1.29 | 2d | 1 | 0.78mi |
| 18212 Austin Ct Edmond, OK | 4.0 | 2.0 | 1520 | $2,095 | $1.38 | 2d | 1 | 0.79mi |
| 18200 Austin Ct Edmond, OK | 4.0 | 2.0 | 1701 | $2,195 | $1.29 | 2d | 1 | 0.79mi |
| 19217 Garden Creek Ln Edmond, OK | 4.0 | 2.0 | 1828 | $2,045 | $1.12 | 11d | 1 | 0.79mi |
| 18112 Austin Ct Edmond, OK | 3.0 | 2.0 | 1542 | $1,995 | $1.29 | 2d | 1 | 0.79mi |
| 17029 Woodvine Dr Edmond, OK | 3.0 | 2.0 | 1838 | $1,970 | $1.07 | 17d | 1 | 0.81mi |
| 17516 Black Hawk Dr Edmond, OK | 3.0 | 2.0 | 1846 | $2,095 | $1.13 | 2d | 1 | 0.84mi |
| 2921 NW 195th St Edmond, OK | 3.0 | 2.0 | 1342 | $1,695 | $1.26 | 11d | 1 | 0.96mi |
| 2925 NW 195th St Edmond, OK | 3.0 | 2.0 | 1342 | $1,695 | $1.26 | 24d | 1 | 0.96mi |
| 19501 Conway Dr Edmond, OK | 3.0 | 2.0 | 1253 | $1,650 | $1.32 | 5d | 1 | 0.97mi |
| 19505 Conway Dr Edmond, OK | 3.0 | 2.0 | 1342 | $1,695 | $1.26 | 24d | 1 | 0.97mi |
| 19513 Conway Dr Edmond, OK | 3.0 | 2.0 | 1253 | $1,650 | $1.32 | 24d | 1 | 0.97mi |
| 19509 Conway Dr Edmond, OK | 3.0 | 2.0 | 1342 | $1,695 | $1.26 | 5d | 1 | 0.97mi |
| 19521 Conway Dr Edmond, OK | 3.0 | 2.0 | 1253 | $1,650 | $1.32 | 24d | 1 | 0.97mi |
| 2945 NW 195th St Edmond, OK | 3.0 | 2.0 | 1253 | $1,650 | $1.32 | 5d | 1 | 0.98mi |
| 2941 NW 195th St Edmond, OK | 3.0 | 2.0 | 1342 | $1,695 | $1.26 | 5d | 1 | 0.99mi |
| 19613 Bolton Rd Edmond, OK | 3.0 | 2.0 | 1340 | $1,795 | $1.34 | 2d | 1 | 1.01mi |
| 19629 Ferris Dr Edmond, OK | 3.0 | 2.0 | 1347 | $1,850 | $1.37 | 24d | 1 | 1.06mi |
| 19717 Whitley Rd Edmond, OK | 4.0 | 2.0 | 1701 | $1,995 | $1.17 | 17d | 1 | 1.10mi |
| 19708 Barrister Cir Edmond, OK | 3.0 | 2.0 | 1257 | $1,595 | $1.27 | 2d | 1 | 1.14mi |
| 19704 Taggert Dr Edmond, OK | 3.0 | 2.0 | 1330 | $1,645 | $1.24 | 5d | 1 | 1.15mi |
| 17609 Gold Dr Edmond, OK | 4.0 | 2.0 | 1640 | $1,995 | $1.22 | 24d | 1 | 1.17mi |
| 19704 Vivace Dr Edmond, OK | 3.0 | 2.0 | 1450 | $1,699 | $1.17 | 2d | 1 | 1.18mi |
| 19804 Canning Ct Edmond, OK | 3.0 | 2.0 | 1875 | $2,595 | $1.38 | 17d | 1 | 1.20mi |
| 17405 Bronze Ln Edmond, OK | 4.0 | 2.0 | 1787 | $2,050 | $1.15 | 2d | 1 | 1.20mi |
| 2364 NW 197th St Edmond, OK | 3.0 | 2.0 | 1250 | $1,595 | $1.28 | 2d | 1 | 1.24mi |
| 19501 N Pennsylvania Ave Edmond, OK | 2.0–3.0 | 1.0–2.0 | 1122 | $1,750 | $1.56 | 2d | 11 | 1.26mi |
| 19601 N Pennsylvania Ave Edmond, OK | 3.0 | 2.5 | 1441 | $1,745 | $1.21 | 2d | 1 | 1.34mi |
HOA detail
- Monthly dues
- $66 · $792/yr
Listing history 17 events
-
2026-06-18days on market $224,900 Active 58 DOM
-
2026-06-17days on market $224,900 Active 57 DOM
-
2026-06-16days on market $224,900 Active 56 DOM
-
2026-06-15days on market $224,900 Active 55 DOM
-
2026-06-13days on market $224,900 Active 53 DOM
-
2026-06-09days on market $224,900 Active 49 DOM
-
2026-06-08days on market $224,900 Active 48 DOM
-
2026-06-07days on market $224,900 Active 47 DOM
-
2026-06-05days on market $224,900 Active 44 DOM
-
2026-06-03days on market $224,900 Active 43 DOM
-
2026-06-02days on market $224,900 Active 42 DOM
-
2026-06-01days on market $224,900 Active 41 DOM
-
2026-05-31days on market $224,900 Active 40 DOM
-
2026-05-22price $224,900
-
2026-05-07price $239,900
-
2026-04-21$250,000 Active
-
2022-01-18soldstatus $7,945,500
ⓘ Source: listings_history table (triggers on properties + properties_extension) + one-shot
backfill from property_details.listing_events for pre-trigger history.
Tax reassessment forecast OK · Resets to sale price
- Current annual tax
- $3,462 · $288/mo
- Projected year-2 tax
- $3,462 · $288/mo
- Expected delta
- $0/yr ($0/mo · 0.0%)
ⓘ Screening estimate from a state-policy table — verify with the county assessor before closing.
Climate risk First Street
- Flood 1/10 Low FEMA zone X (unshaded) · 0% chance over 30 yrs
- Wildfire 3/10 Moderate
- Heat 6/10 Major 7 d/yr ≥108°F today · 20 d/yr by 30 yrs out
- Wind 2/10 Low 4% chance of damaging wind over 30 yrs
- Air quality 2/10 Low 1 unhealthy d/yr today · 1 by 30 yrs out
Nearby sold comps map
Loading sold comps map…
Walkable amenities ~0.75 mi
Loading nearby amenities…
Taxation est. · year 1
- Rental income
- $23,020
- − Mortgage interest
- −$12,598
- − Property taxes
- −$3,462
- − Insurance
- −$1,124
- − Repairs & maintenance
- −$1,842
- − Management
- −$1,842
- − HOA
- −$792
- − Depreciation
- −$6,543
- Taxable loss
- −$5,182
- Est. tax savings @ 24.0%
- +$1,244
- After-tax cash flow
- $-102/yr
For passive investors: Depreciation is non-cash, so a rental often shows a tax loss while cash-flowing — sheltering income. Rental losses are passive: they offset passive income freely, and up to $25,000/yr can offset ordinary (W-2) income if you actively participate and your MAGI is under $100k (phasing out to $0 by $150k); unused losses carry forward. On sale, claimed depreciation is recaptured at up to 25%, and gains may owe capital-gains tax (a 1031 exchange can defer both). Figures are a year-1 estimate at your 24.0% rate — not tax advice; consult a CPA.
Schools (NCES district)
- District
- Deer Creek
- NCES district ID
- 4009570
- Math proficiency
- 41% ▼ -16.00%
- Reading proficiency
- 44% ▼ -14.00%
- Median HH income
- $101,218
- Composite
- 41.46/100
- National rank
- #3465
- State rank
- #4 of 270 in OK
Livability — Oklahoma City
- Score
- 80/100
- State rank
- #3
- US rank
- #1635
Category grades
Schools grade is shown separately in the Schools card above.
Census & demographics
- Census place
- Oklahoma City, OK
- County
- Oklahoma County · 771,644 people
- City population
- 498,656
- Metro
- Oklahoma City, OK
- Population (ZIP)
- 46,993
- Household income
- $126,659
- Rent vs Own
- Severe rent burden
- 898.0
Population outlook (Oklahoma County) Hauer SSP2
- Today (2025)
- 911,875 people
- By 2030
- 982,413 · +7.7%
- By 2040
- 1,130,468 · +24.0%
- By 2050
- 1,288,422 · +41.3%
- By 2075
- 1,711,482 · +87.7%
- By 2100
- 2,088,448 · +129.0%
Race, ethnicity, and origin ACS 2023
- Neighborhood character
- Predominantly White (67%)
- Race & ethnicity
- White 67% Two or more races 10% Black 8% Asian 8% Hispanic / Latino 8% Native American 2%
- Hispanic origin (detail)
- Mexican 5%
- Common ancestry
- Italian 3% Slovak 2% Romanian 2%
- Foreign-born
- 11% · Canada, China, Vietnam
- Languages at home
- 86% English-only · Spanish 4% Other Indo-European 2% Chinese 2%
Political lean MEDSL · Oklahoma
- 2024 margin
- Toss-up / Even · D 48.0% · R 49.7% · Other 2.3%
- 2008→2024 swing
- +15.1pp toward D · 2008: -16.8pp · 2024: -1.7pp
- All cycles
- 2024: R+1.7 2020: R+1.1 2016: R+10.5 2012: R+16.7 2008: R+16.8
Not yet ingested
- Civics
- —
Market trends
- HPI YoY
- ▼ -44.41%
- Current HPI
- 203.1105
- Rent YoY
- ▲ 1.21%
- Metro
- Oklahoma City, OK
- State GDP YoY
- ▲ 1.55%
- F500 in state
- 6
Industry mix (Fortune 500 HQ in OK)
| Industry | F500 HQs | Revenue |
|---|---|---|
| Energy | 3 | $48B |
|
||
Price history
-97.2% since first listed4 events — show timeline
- 2026-05-22 Price Changed $224,900 MLSOK
- 2026-05-07 Price Changed $239,900 MLSOK
- 2026-04-21 Listed $250,000 MLSOK
- 2022-01-18 Sold (Public Records) $7,945,500 Public Records
Property tax history
+49.6%/yrLatest (2025): $3,462 · -1.3% YoY. Source: county tax records.
Cash-flow waterfall
monthlySold comps — $/sqft
last 12 mo · ≤1 miLoading sold comps…