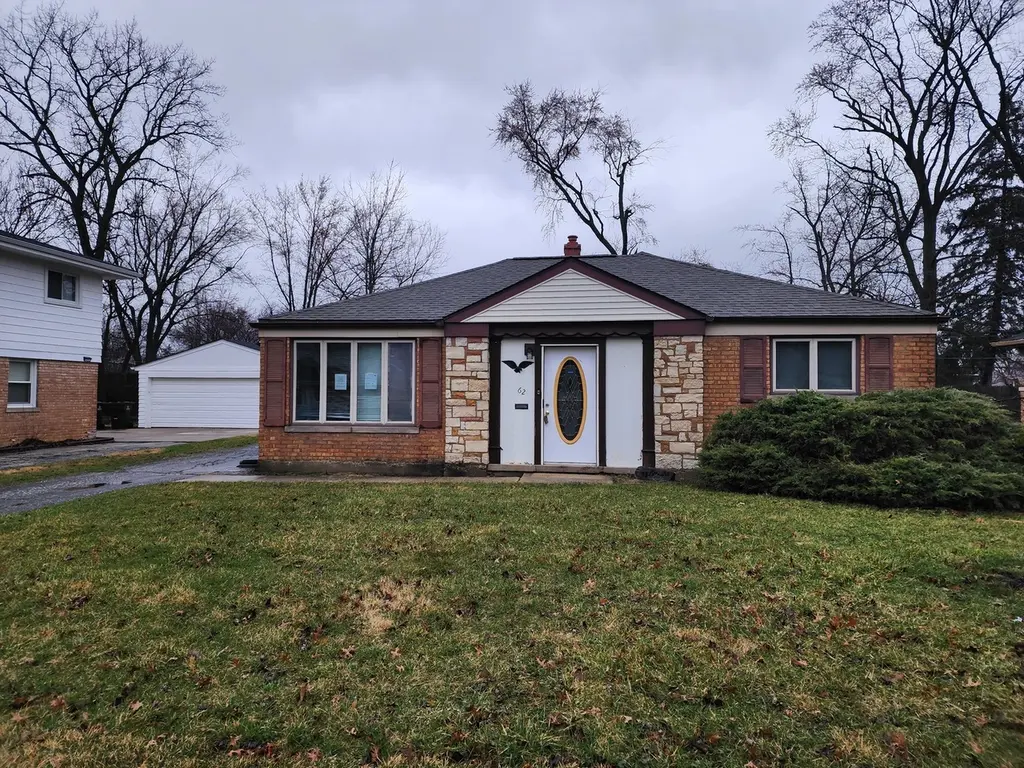
62 Marquette St · Park Forest, IL
Flood risk 1/10 · Minimal
- FEMA flood zone
- X (unshaded)
- Chance of flooding over 30 yrs
- 0.0%
- Est. flood insurance / yr
- $473 – $860
Fire risk 1/10 · Minimal
- Est. fire insurance / yr
- $804 – $1,492
Heat risk 3/10 · Minor
- Hot days now (above 101°F)
- 7 days/yr
- Hot days in 30 yrs
- 16 days/yr
Wind risk 2/10 · Minimal
- Chance of severe wind over 30 yrs
- —
Air-quality risk 2/10 · Minimal
- Unhealthy air days now
- 1 days/yr
- Unhealthy air days in 30 yrs
- 1 days/yr
Risk factors via First Street. Map © Google.
Why this score? — see what drove the B grade
The composite is a weighted blend of 9 inputs, each scored 0–100. Each bar is that input's sub-score; the figure is the points it added to the 100-point composite (weight × sub-score).
- Cash flow +30.0/30.0
- ARV discount +15.0/15.0
- 1% rule +10.0/10.0
- DSCR +10.0/10.0
- Livability +3.9/5.0
- Rent growth +2.5/5.0
- Condition / age +2.5/5.0
- Schools +0.9/10.0
- Appreciation +0.0/10.0
$108,500
🖨 Deal sheet (PDF) 📄 Offer letter ✓ Due diligence
Listing remarks
See the potential ranch style single family home in Park Forest. This home offers 4 bedrooms and 2 bathrooms. It has a nicely sized kitchen and a large family room with a fireplace. Plenty of off street parking. There is a deck that looks out on to a nicely sized back yard. HUD Case #138-159694. FHA Insurability Code:IE, subject to appraisal. This home is owned by the US Dept. of HUD. This home is being sold "AS IS". Seller makes no representations or warranties as to property condition nor room sizes. Equal Housing Opportunity.
Key facts
- Nicely sized kitchen
- Large family room
- Off street parking
Tags
Property features AI
Finance
- HOA & community: No master association fee required
Exterior
- Utilities: Public water; Public sewer
- Home design: Detached single-family home; Single-story
- Construction: Brick construction; Built 71-80 years ago; Built before 1978
- Exterior features: Lot smaller than 0.25 acre; Lot dimensions: 7,488 sq ft
Interior
- Kitchen: Kitchen on the main level
- Bedrooms: 4 bedrooms (all on the main level); Master bedroom on the main level
- Bathrooms: 2 full bathrooms
- Heating & cooling: Natural gas heating
- Interior features: 8 total rooms; School bus service available
- Laundry & utility: Main-level laundry room
Neighborhood map
What this means for you Summary
Snapshot
- This is a 4-bed/1.5-bath single-family listed at $108k.
Deal economics
- At list price, monthly cash flow is $1k ($15k/yr) — positive.
- The deal already cash-flows at list — no discount required.
- Meets the 1% rule at list price ($3k rent vs $108k).
- Recommended offer: $102k (6.0% below list) — sets the bar for market timing.
- Cap rate 20.4% vs local median 9.5% in Park Forest — top-decile yield for the area; either an underpriced asset or a hidden risk that comps aren't pricing in. Stress-test before assuming the spread holds.
Location & tenants
- Location reads 78/100 on livability (#148 in IL, #2,726 nationally) — a middle-class / working-renter tenant base. Strengths: commute A+, cost of living A+, housing A+; Watch: amenities F.
- Rich Twp Hsd 227 (suburban): math 5% / reading 12% proficiency, ranked #577 of 620 in IL (top 93%) — low school quality limits family demand, transient renter base, plan for 1-2y turnover.
- Zoned schools: Michelle Obama Sch of Technology (484 students, 0% FRL).
- Market conditions: 106 active listings in the ZIP; 7 comparable units currently listed for rent nearby; rentals leasing fast (median 12d on market — plan ~1-2 weeks tenant-placement turnaround); 6,272 units permitted in Cook County in 2024 (4,658 in 5+ unit buildings).
- At $2,563/mo this rent would consume 50% of the median local household income ($62k/yr) (locally 900% of renters already pay >50% of income on rent) — very limited rent-growth headroom before tenants either downsize or default.
Forward outlook
- Local home prices are declining (-3.0%/yr); year-one equity from $750 of loan paydown is wiped out by about $3k of value loss. Plan a longer hold.
- At projected returns (-3.0% appreciation + 3.0% rent growth), your $30k cash investment doubles in ~3 years — after that, you're playing with house money.
Negotiation context
- It's been on market 89 days — a 6% lower offer ($102k) is reasonable based on typical stale-listing flexibility.
- 10 sale attempts since 5y ago; this cycle's ask has dropped $34k (24%) from the opening price — seller is motivated, your offer sets the floor, not the list.
Risks & watch-outs
- Watch-outs: built in 1951 — expect roof / HVAC / electrical / plumbing capex.
Questions for the listing agent
- It's been on market 89 days. Have you received any prior offers? Is the seller open to a 6% concession, seller financing, or rate buy-down credit?
- Built in 1951 — when were the roof, HVAC, electrical panel, plumbing, and water heater last replaced?
- Why hasn't it sold? Are there any deal-killer items the seller is aware of (foundation, flood, title, zoning, code violations)?
- Is there a deadline driving the sale (1031 exchange, divorce, estate, relocation)? That informs how much negotiation room exists.
- Schools are D-rated, which usually means shorter tenancies and higher turnover. Who's the typical renter profile here, and what's been the actual vacancy rate?
- What's the average days-on-market for RENTAL listings here right now (not sales)? A rising rental-DOM trend means longer vacancies and softer asking-rent achievability than the comps imply.
- What's the recent tenant-quality profile in this submarket — average credit score on applications, eviction rate, late-payment / NSF rate, and stable-employment percentage? A property-management company in the area should have these aggregated.
- How much new for-sale + rental construction is in the pipeline within 1–3 miles? Heavy new supply typically softens prices + rents 12–24 months out; constrained supply supports both.
Investment metrics
- 1% rule
- 2.36% ✓
- Cap rate
- 20.39%
- Cash-on-cash
- 50.36%
- DSCR
- 3.24
- GRM
- 3.5
CMA / ARV
- ARV (on-the-fly)
- $182,966
- Comps found
- 12
Show comp detail 12 sales within ~0.75 mi
| Address | Dist | Beds/Ba | Sqft | Sold | Price | $/sf | Match |
|---|---|---|---|---|---|---|---|
| 356 Osage St | 0.26mi | 4/2.0 | 1,875 (+0%) | 6mo | $70,000 | $37 | 80 |
| 320 Oakwood St | 0.13mi | 5/2.5 (+1) | 1,932 (+4%) | 4mo | $190,000 | $98 | 76 |
| 339 Onarga St | 0.14mi | 5/2.0 (+1) | 1,898 (+2%) | 12mo | $55,000 | $29 | 74 |
| 9 Apple Ln | 0.24mi | 4/2.5 | 1,937 (+4%) | 8mo | $189,900 | $98 | 72 |
| 64 Marquette St | 0.01mi | 4/2.0 | 1,689 (-10%) | 15mo | $232,000 | $137 | 69 |
| 356 S Orchard Dr | 0.32mi | 3/2.5 (-1) | 1,811 (-3%) | 3mo | $185,000 | $102 | 68 |
| 7 Nassau Ct | 0.42mi | 4/2.0 | 1,968 (+5%) | 2mo | $235,000 | $119 | 68 |
| 105 Marquette St | 0.18mi | 3/2.0 (-1) | 1,769 (-5%) | 10mo | $208,000 | $118 | 67 |
| 123 Peach St | 0.38mi | 4/2.5 | 1,778 (-5%) | 8mo | $150,000 | $84 | 64 |
| 28 W Rocket Cir | 0.66mi | 4/2.0 | 1,905 (+2%) | 2mo | $140,000 | $73 | 62 |
| 336 Indianwood Blvd | 0.46mi | 3/1.5 (-1) | 1,784 (-4%) | 6mo | $190,000 | $107 | 61 |
| 336 Oakwood St | 0.18mi | 4/2.0 | 2,083 (+12%) | 14mo | $90,000 | $43 | 59 |
Match score weights: distance 35% · size 25% · config 20% · recency 20%. Top-matched comps best support the ARV.
Projected returns pro-forma
-3.0% appreciation · 3.0% rent growth · sell at horizon
- IRR
- 48.1%
- Equity multiple
- 3.10×
- Total profit
- $63,666
- Equity at exit
- $16,178
- IRR
- 53.7%
- Equity multiple
- 6.27×
- Total profit
- $160,166
- Equity at exit
- $9,381
Cash invested: $30,380 (down + closing). Projections, not guarantees.
Landlord ↔ Tenant lean methodology
- Overall (STATE)
- 43 Moderately Tenant-Leaning
- State Illinois
- 43 Moderately Tenant-Leaning · D+7
- County
- — inherits STATE
- City
- — inherits STATE
ZIP-level market 60466
- Home prices YoY
- -21.1%
- Active inventory
- 106
- Price-to-rent
- 3.5×
Monthly cashflow live
- Estimated rent
- $2,563 high interval (Pro) →
- Mortgage (P&I)
- −$569
- Tax est. 1.5%
- −$136 /mo · $1,628/yr
- Insurance
- −$45
- HOA
- −$0
- Vacancy / Maint / Mgmt
- −$538
- Net cashflow
- $1,275
Break-even live
Sensitivity live
| Price | -10% $1,350 | -5% $1,313 | +0% $1,275 | +5% $1,238 | +10% $1,200 |
|---|---|---|---|---|---|
| Rent | -10% $1,073 | -5% $1,174 | +0% $1,275 | +5% $1,376 | +10% $1,478 |
| Rate | -1.0pp $1,330 | -0.5pp $1,303 | base $1,275 | +0.5pp $1,247 | +1.0pp $1,218 |
UW: 25.0% down · 7.5% · 30yr · 1.5% tax · 5.0% vac · 8.0% maint · 8.0% mgmt
Financing live
Cash to close
- Down payment
- $27,125
- Closing costs
- $3,255
- Reserves months
- —
- Total cash needed
- —
Loan-product check · same deal, 3 products live
Conventional
25% down · 7.5% · 30yr
- Down + closing
- —
- Monthly P&I
- —
- Monthly cashflow
- —
- DSCR
- —
- Eligible?
- —
Personal DTI + credit; lowest rate.
DSCR
20% down · 8.5% · 30yr
- Down + closing
- —
- Monthly P&I
- —
- Monthly cashflow
- —
- DSCR
- —
- Eligible?
- —
No personal income docs; deal must DSCR.
Hard money
10% down · 12.0% · 12mo
- Down + closing
- —
- Monthly P&I
- —
- Monthly cashflow
- —
- DSCR
- —
- Eligible?
- —
Short-term bridge; refi at stabilization.
Rent comps 7 comps
| Address | Beds | Baths | Sqft | Rent | $/sqft | DOM | Units | Dist |
|---|---|---|---|---|---|---|---|---|
| 336 Oakwood St Park Forest, IL | 3.0 | 2.0 | 2083 | $2,800 | $1.34 | 12d | 1 | 0.15mi |
| 19 Apple Ln Park Forest, IL | 3.0 | 1.0 | 1541 | $2,300 | $1.49 | 14d | 1 | 0.19mi |
| 111 Nashua St Park Forest, IL | 4.0 | 1.5 | 1500 | $2,500 | $1.67 | 26d | 1 | 0.45mi |
| 3324 Western Ave Park Forest, IL | 1.0–3.0 | 1.0 | 1026 | $1,995 | $1.94 | 0d | 11 | 0.64mi |
| 11 Fir St Park Forest, IL | 1.0–3.0 | 1.0 | 1026 | $2,069 | $2.02 | 0d | 1 | 0.82mi |
| 441 Talala St Park Forest, IL | 4.0 | 2.0 | 1740 | $2,500 | $1.44 | 26d | 1 | 0.90mi |
| 490 Shabbona Dr Park Forest, IL | 3.0 | 1.0 | 1300 | $1,895 | $1.46 | 5d | 1 | 1.06mi |
Listing history 44 events
-
2026-06-21days on market $108,500 Active 89 DOM
-
2026-06-18days on market $108,500 Active 86 DOM
-
2026-06-17days on market $108,500 Active 85 DOM
-
2026-06-16days on market $108,500 Active 84 DOM
-
2026-06-15days on market $108,500 Active 83 DOM
-
2026-06-13days on market $108,500 Active 81 DOM
-
2026-06-10price $108,500 Active 77 DOM
-
2026-06-09days on market $120,500 Active 77 DOM
-
2026-06-08days on market $120,500 Active 76 DOM
-
2026-06-07days on market $120,500 Active 75 DOM
-
2026-06-04days on market $120,500 Active 72 DOM
-
2026-06-03days on market $120,500 Active 71 DOM
-
2026-06-02days on market $120,500 Active 70 DOM
-
2026-06-01days on market $120,500 Active 69 DOM
-
2026-05-31days on market $120,500 Active 68 DOM
-
2026-05-05price $120,500
-
2026-03-23$142,000 Active
-
2026-02-26historical
-
2025-10-21price
-
2025-10-10Active
-
2024-07-23historical
-
2024-05-04status Active
-
2024-04-30historical
-
2024-03-04price
-
2024-01-22status Active
-
2024-01-18historical
-
2024-01-08price
-
2023-09-20price
-
2023-09-20status Temporarily No Showings
-
2023-09-20historical
-
2023-09-19status Temporarily No Showings
-
2023-09-10historical
-
2023-09-10status Temporarily No Showings
-
2023-09-07historical
-
2023-08-22price
-
2023-06-21Active
-
2022-04-15soldstatus $160,000
-
2022-04-12soldstatus $160,000 Closed
-
2022-02-15historical Contingent - No Showings
-
2022-02-11status Active Under Contract (Do Not Show)
-
2022-02-10status Active Under Contract
-
2022-02-05status Active
-
2021-12-12status Active Under Contract
-
2021-12-09$144,900 Active
ⓘ Source: listings_history table (triggers on properties + properties_extension) + one-shot
backfill from property_details.listing_events for pre-trigger history.
Climate risk First Street
- Flood 1/10 Low FEMA zone X (unshaded) · 0% chance over 30 yrs
- Wildfire 1/10 Low
- Heat 3/10 Moderate 7 d/yr ≥101°F today · 16 d/yr by 30 yrs out
- Wind 2/10 Low
- Air quality 2/10 Low 1 unhealthy d/yr today · 1 by 30 yrs out
Nearby sold comps map
Loading sold comps map…
Walkable amenities ~0.75 mi
Loading nearby amenities…
Taxation est. · year 1
- Rental income
- $30,758
- − Mortgage interest
- −$6,078
- − Property taxes
- −$1,628
- − Insurance
- −$542
- − Repairs & maintenance
- −$2,461
- − Management
- −$2,461
- − Depreciation
- −$3,156
- Taxable income
- $14,432
- Est. tax owed @ 24.0%
- −$3,464
- After-tax cash flow
- $11,837/yr
For passive investors: Depreciation is non-cash, so a rental often shows a tax loss while cash-flowing — sheltering income. Rental losses are passive: they offset passive income freely, and up to $25,000/yr can offset ordinary (W-2) income if you actively participate and your MAGI is under $100k (phasing out to $0 by $150k); unused losses carry forward. On sale, claimed depreciation is recaptured at up to 25%, and gains may owe capital-gains tax (a 1031 exchange can defer both). Figures are a year-1 estimate at your 24.0% rate — not tax advice; consult a CPA.
Schools (NCES district)
- District
- Rich Twp Hsd 227
- NCES district ID
- 1733420
- Math proficiency
- 5% ▼ -3.00%
- Reading proficiency
- 12% ▬ 0.00%
- Median HH income
- $56,056
- Composite
- 8.93/100
- National rank
- #9885
- State rank
- #577 of 620 in IL
Livability — Park Forest
- Score
- 78/100
- State rank
- #148
- US rank
- #2726
Category grades
Schools grade is shown separately in the Schools card above.
Census & demographics
- Census place
- Park Forest, IL
- County
- Cook County · 4,486,803 people
- City population
- 21,461
- Metro
- Chicago-Naperville-Elgin, IL-IN-WI
- Population (ZIP)
- 21,461
- Household income
- $61,654
- Rent vs Own
- Severe rent burden
- 900.0
Population outlook (Cook County) Hauer SSP2
- Today (2025)
- 5,347,519 people
- By 2030
- 5,357,703 · +0.2%
- By 2040
- 5,324,924 · -0.4%
- By 2050
- 5,230,762 · -2.2%
- By 2075
- 4,785,735 · -10.5%
- By 2100
- 4,188,836 · -21.7%
Race, ethnicity, and origin ACS 2023
- Neighborhood character
- Predominantly Black (69%)
- Race & ethnicity
- Black 69% White 19% Hispanic / Latino 9% Two or more races 3% Native American 1%
- Hispanic origin (detail)
- Mexican 8%
- Common ancestry
- Romanian 2% Iranian 1% Italian 1%
- Foreign-born
- 6% · Canada
- Languages at home
- 90% English-only · Spanish 7% French/Haitian/Cajun 1% Russian/Polish/Slavic 1%
Political lean MEDSL · Cook
- 2024 margin
- Solid D (+42.0) · D 70.4% · R 28.4% · Other 1.2%
- 2008→2024 swing
- -11.4pp toward R · 2008: 53.4pp · 2024: 42.0pp
- All cycles
- 2024: D+42.0 2020: D+50.3 2016: D+53.0 2012: D+49.4 2008: D+53.4
Not yet ingested
- Civics
- —
Market trends
- HPI YoY
- ▼ -58.87%
- Current HPI
- 219.9692
- Rent YoY
- —
- Metro
- Chicago-Naperville-Elgin, IL-IN-WI
- State GDP YoY
- ▲ 1.59%
- F500 in state
- 60
Industry mix (Fortune 500 HQ in IL)
| Industry | F500 HQs | Revenue |
|---|---|---|
| Insurance | 4 | $201B |
|
||
| Consumer Goods | 4 | $87B |
|
||
| Industrial Machinery | 3 | $64B |
|
||
| Healthcare | 2 | $55B |
|
||
| Retail / Pharmacy | 1 | $148B |
|
||
| Agriculture / Food | 1 | $86B |
|
||
Price history
-16.8% since first listed29 events — show timeline
- 2026-05-05 Price Changed $120,500 MRED as Distributed by MLS Grid
- 2026-03-23 Listed $142,000 MRED as Distributed by MLS Grid
- 2026-02-26 Listing Removed — MRED as Distributed by MLS Grid
- 2025-10-21 Price Changed — MRED as Distributed by MLS Grid
- 2025-10-10 Listed — MRED as Distributed by MLS Grid
- 2024-07-23 Listing Removed — MRED as Distributed by MLS Grid
- 2024-05-04 Relisted — MRED as Distributed by MLS Grid
- 2024-04-30 Listing Removed — MRED as Distributed by MLS Grid
- 2024-03-04 Price Changed — MRED as Distributed by MLS Grid
- 2024-01-22 Relisted — MRED as Distributed by MLS Grid
- 2024-01-18 Listing Removed — MRED as Distributed by MLS Grid
- 2024-01-08 Price Changed — MRED as Distributed by MLS Grid
- 2023-09-20 Price Changed — MRED as Distributed by MLS Grid
- 2023-09-20 Relisted — MRED as Distributed by MLS Grid
- 2023-09-20 Listing Removed — MRED as Distributed by MLS Grid
- 2023-09-19 Relisted — MRED as Distributed by MLS Grid
- 2023-09-10 Listing Removed — MRED as Distributed by MLS Grid
- 2023-09-10 Relisted — MRED as Distributed by MLS Grid
- 2023-09-07 Listing Removed — MRED as Distributed by MLS Grid
- 2023-08-22 Price Changed — MRED as Distributed by MLS Grid
- 2023-06-21 Listed — MRED as Distributed by MLS Grid
- 2022-04-15 Sold (Public Records) $160,000 Public Records
- 2022-04-12 Sold (MLS) $160,000 MRED as Distributed by MLS Grid
- 2022-02-15 Contingent — MRED as Distributed by MLS Grid
- 2022-02-11 Pending — MRED as Distributed by MLS Grid
- 2022-02-10 Pending — MRED as Distributed by MLS Grid
- 2022-02-05 Relisted — MRED as Distributed by MLS Grid
- 2021-12-12 Pending — MRED as Distributed by MLS Grid
- 2021-12-09 Listed $144,900 MRED as Distributed by MLS Grid
Property tax history
+11.0%/yrLatest (2023): $11,712 · +0.7% YoY. Source: county tax records.
Cash-flow waterfall
monthlySold comps — $/sqft
last 12 mo · ≤1 miLoading sold comps…