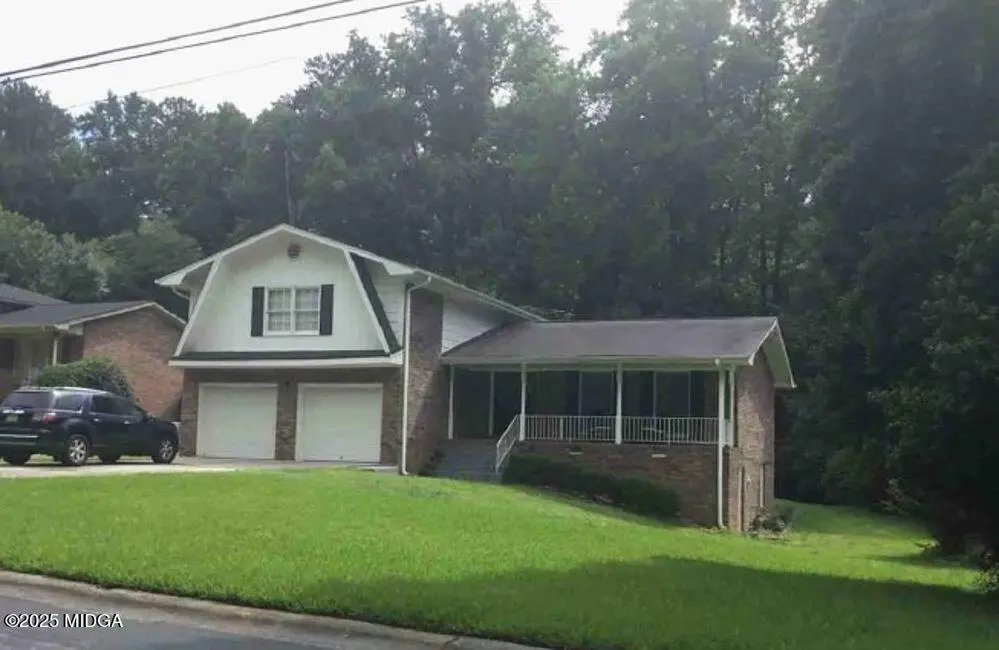
2969 Stratford Mill Rd · Stonecrest, GA
Flood risk 1/10 · Minimal
- FEMA flood zone
- X (unshaded)
- Chance of flooding over 30 yrs
- 0.0%
- Est. flood insurance / yr
- $507 – $1,088
Fire risk 1/10 · Minimal
- Est. fire insurance / yr
- $963 – $1,789
Heat risk 6/10 · Moderate
- Hot days now (above 105°F)
- 7 days/yr
- Hot days in 30 yrs
- 18 days/yr
Wind risk 5/10 · Moderate
- Chance of severe wind over 30 yrs
- 26.0%
Air-quality risk 5/10 · Moderate
- Unhealthy air days now
- 7 days/yr
- Unhealthy air days in 30 yrs
- 10 days/yr
Risk factors via First Street. Map © Google.
Why this score? — see what drove the D- grade
The composite is a weighted blend of 9 inputs, each scored 0–100. Each bar is that input's sub-score; the figure is the points it added to the 100-point composite (weight × sub-score).
- Cash flow +10.4/30.0
- ARV discount +10.0/15.0
- 1% rule +3.9/10.0
- Rent growth +3.7/5.0
- DSCR +3.0/10.0
- Livability +2.5/5.0
- Condition / age +2.5/5.0
- Schools +2.1/10.0
- Appreciation +0.0/10.0
$263,000
🖨 Deal sheet (PDF) 📄 Offer letter ✓ Due diligence
Listing remarks MLS
Welcome to 2969 Stratford Mill in Lithonia, GA 30038. This 4-bedroom, 2.5-bath home offers a solid layout with over 2,100 sq. ft. of living space and sits on a nice lot with good potential. Main level features include a spacious family room with a fireplace, a separate dining area, and an eat-in kitchen with ample cabinet space. Upstairs offers well-sized bedrooms, including a primary suite with a private bath. Home includes a 2-car garage and a backyard with space for future improvements, outdoor living, or landscaping ideas. Property needs updates and is being sold strictly as-is, making it a good opportunity for investors or buyers looking to renovate and add value. Conveniently located near shopping, schools, parks, and major highways for easy access around metro Atlanta. Bring your vision and take advantage of the potential this property has to offer.
Key facts
- Backyard with space
- Private bath
- Eat-in kitchen
Tags
Property features AI
Finance
- Other: Road surface: asphalt and other; Road frontage: county road and other; Directions: use GPS; County: Dekalb, GA
Exterior
- Parking: Attached parking for 2 vehicles
- Utilities: Public water; Public sewer; Other electric/utilities
- Home design: Multi/split levels; Fee simple ownership; Resale condition
- Construction: Aluminum siding and brick exterior; Other roof; Foundation details: see remarks
- Exterior features: Deck; Back yard fencing; Other exterior features
Interior
- Kitchen: Stained cabinets; Pantry; Other kitchen features
- Bedrooms: Two main-level bedrooms; Three upper-level bedrooms; Two lower-level bedrooms; Bedroom features: Other
- Flooring: Carpet; Hardwood; Other flooring
- Bathrooms: Two full bathrooms; One half bathroom (main level); Master bath with tub/shower combination and other features
- Heating & cooling: Other heating; Other cooling
- Interior features: One fireplace in the family room; No common walls (detached); Basement with both interior and exterior entry; Other interior features
- Laundry & utility: Laundry located in the basement; Other laundry features
Neighborhood map
What this means for you Summary
Snapshot
- This is a 4-bed/2.5-bath single-family listed at $263k.
Deal economics
- At list price, monthly cash flow is $-140 ($-2k/yr) — negative.
- To cash-flow at today's rent, offer at most $238k (9.4% below list).
- To meet the 1% rule (rent ≥ 1% of price), the offer needs to be $233k (11.3% below list).
- Recommended offer: $233k (11.3% below list) — sets the bar for 1% rule.
Location & tenants
- Location reads: area grade D — affects rentability + tenant quality, not the cash-flow math above.
- Dekalb County (suburban): math 19% / reading 28% proficiency, ranked #125 of 174 in GA (top 72%) — low school quality limits family demand, transient renter base, plan for 1-2y turnover; 68% free/reduced lunch — lower-income household profile, screen leases tightly.
- Zoned schools: Browns Mill Elementary School (math 5% / reading 24%, grade F, #988 of 1,228 statewide, top 81%, 383 students, 100% FRL); Salem Middle School (math 5% / reading 16%, grade F, #429 of 470 statewide, top 91%, 988 students, 100% FRL); Martin Luther King- Jr. High School (math 8% / reading 22%, grade F, #297 of 424 statewide, top 74%, 1,440 students, 100% FRL) — zoned schools average 100% FRL vs 68% district-wide (32 pts higher); higher-poverty schools than district average — tighter screening recommended.
- Market conditions: Rents rising fast (+4.6%/yr); 321 active listings in the ZIP; 30 comparable units currently listed for rent nearby; rentals at typical pace (median 27d on market — plan ~3-4 weeks tenant-placement turnaround); 47% of comp listings sitting > 30 days — soft ceiling on asking rent; 1,240 units permitted in DeKalb County in 2024 (385 in 5+ unit buildings).
- This rent runs 38% of the median local income ($74k/yr) — at the standard rent-burdened threshold; future hikes will face affordability resistance.
Forward outlook
- Local home prices are declining (-3.0%/yr); year-one equity from $2k of loan paydown is wiped out by about $8k of value loss. Plan a longer hold.
- DeKalb County population projected at +28% by 2050 — long-run rental-demand tailwind backs the buy-and-hold thesis.
Negotiation context
- Only 5 days on market — expect competitive offers; lowballing is unlikely to land.
- 9 sale attempts since 14y ago with the ask held roughly flat each time — persistent listings suggest the price (not the market) is what's stuck; bring a comps-based counter.
Risks & watch-outs
- Climate carrying-cost: moderate wind risk, 26% chance of damaging wind over 30y; extreme-heat days projected 7→18/yr by 2055 (HVAC capex compounding) — expect insurance premiums to compound above CPI over the hold.
Questions for the listing agent
- What do current leases actually rent for vs. the listed asking? Can we see a recent rent roll and the last 12 months of T-12 income?
- Built in 1972 — when were the roof, HVAC, electrical panel, plumbing, and water heater last replaced?
- Is there a deadline driving the sale (1031 exchange, divorce, estate, relocation)? That informs how much negotiation room exists.
- The area grade is low — what's the realistic commute time and amenity access for the typical tenant pool here? Any planned neighborhood developments (good or bad) we should know about?
- What's the average days-on-market for RENTAL listings here right now (not sales)? A rising rental-DOM trend means longer vacancies and softer asking-rent achievability than the comps imply.
- What's the recent tenant-quality profile in this submarket — average credit score on applications, eviction rate, late-payment / NSF rate, and stable-employment percentage? A property-management company in the area should have these aggregated.
- How much new for-sale + rental construction is in the pipeline within 1–3 miles? Heavy new supply typically softens prices + rents 12–24 months out; constrained supply supports both.
Investment metrics
- 1% rule
- 0.89% ✗
- Cap rate
- 5.65%
- Cash-on-cash
- -2.29%
- DSCR
- 0.90
- GRM
- 9.4
CMA / ARV
- ARV (median comp)
- $278,565
- List price
- $263,000
- Delta
- -39.46%
- Verdict
- UNDERPRICED
- Comps
- 20 within 1.0 mi
Show comp detail 12 sales within ~0.75 mi
| Address | Dist | Beds/Ba | Sqft | Sold | Price | $/sf | Match |
|---|---|---|---|---|---|---|---|
| 3094 Oxbridge Way | 0.31mi | 4/2.5 | 2,254 (+6%) | 6mo | $261,000 | $116 | 70 |
| 4804 Thompson Mill Rd | 0.23mi | 5/3.0 (+1) | 2,331 (+10%) | 2mo | $195,000 | $84 | 64 |
| 3000 Stratford Mill Rd | 0.10mi | 5/4.0 (+1) | 2,366 (+12%) | 7mo | $150,000 | $63 | 60 |
| 4995 Panola Mill Dr | 0.62mi | 3/2.5 (-1) | 2,198 (+4%) | 6mo | $188,000 | $86 | 55 |
| 5004 Jack Dr | 0.61mi | 4/2.5 | 2,256 (+6%) | 7mo | $325,000 | $144 | 55 |
| 3202 Wintercreeper Dr | 0.65mi | 3/2.0 (-1) | 1,999 (-6%) | 1mo | $145,700 | $73 | 52 |
| 5123 Jack Dr | 0.72mi | 3/2.5 (-1) | 2,228 (+5%) | 8mo | $293,500 | $132 | 46 |
| 4860 Longview Run | 0.57mi | 3/2.5 (-1) | 2,257 (+6%) | 15mo | $318,500 | $141 | 45 |
| 5015 Jack Dr | 0.58mi | 5/3.0 (+1) | 2,300 (+8%) | 10mo | $333,000 | $145 | 44 |
| 3240 Corktree Trl | 0.71mi | 4/2.5 | 1,895 (-11%) | 8mo | $255,000 | $135 | 43 |
| 4715 Wildginger Run | 0.64mi | 4/3.0 | 1,827 (-14%) | 3mo | $180,000 | $99 | 42 |
| 3019 Havenwood Way | 0.59mi | 4/2.5 | 2,407 (+13%) | 12mo | $346,000 | $144 | 40 |
Match score weights: distance 35% · size 25% · config 20% · recency 20%. Top-matched comps best support the ARV.
Projected returns pro-forma
-3.0% appreciation · 4.6% rent growth · sell at horizon
- IRR
- -18.1%
- Equity multiple
- 0.35×
- Total profit
- $-47,613
- Equity at exit
- $39,214
- IRR
- -7.2%
- Equity multiple
- 0.51×
- Total profit
- $-36,256
- Equity at exit
- $22,739
Cash invested: $73,640 (down + closing). Projections, not guarantees.
Landlord ↔ Tenant lean methodology
- Overall (STATE)
- 90 Strongly Landlord-Friendly
- State Georgia
- 90 Strongly Landlord-Friendly · R+3
- County
- — inherits STATE
- City
- — inherits STATE
ZIP-level market 30038
- Home prices YoY
- -28.0%
- Rents YoY
- 4.6%
- Active inventory
- 321
- Price-to-rent
- 9.4×
Monthly cashflow live
- Estimated rent
- $2,332 high interval (Pro) →
- Mortgage (P&I)
- −$1,379
- Tax from tax record
- −$494 /mo · $5,926/yr
- Insurance
- −$110
- HOA
- −$0
- Vacancy / Maint / Mgmt
- −$490
- Net cashflow
- $-140
Break-even live
Sensitivity live
| Price | -10% $8 | -5% $-66 | +0% $-140 | +5% $-215 | +10% $-289 |
|---|---|---|---|---|---|
| Rent | -10% $-325 | -5% $-233 | +0% $-140 | +5% $-48 | +10% $44 |
| Rate | -1.0pp $-8 | -0.5pp $-74 | base $-140 | +0.5pp $-209 | +1.0pp $-278 |
UW: 25.0% down · 7.5% · 30yr · 1.5% tax · 5.0% vac · 8.0% maint · 8.0% mgmt
Financing live
Cash to close
- Down payment
- $65,750
- Closing costs
- $7,890
- Reserves months
- —
- Total cash needed
- —
Loan-product check · same deal, 3 products live
Conventional
25% down · 7.5% · 30yr
- Down + closing
- —
- Monthly P&I
- —
- Monthly cashflow
- —
- DSCR
- —
- Eligible?
- —
Personal DTI + credit; lowest rate.
DSCR
20% down · 8.5% · 30yr
- Down + closing
- —
- Monthly P&I
- —
- Monthly cashflow
- —
- DSCR
- —
- Eligible?
- —
No personal income docs; deal must DSCR.
Hard money
10% down · 12.0% · 12mo
- Down + closing
- —
- Monthly P&I
- —
- Monthly cashflow
- —
- DSCR
- —
- Eligible?
- —
Short-term bridge; refi at stabilization.
Rent comps 30 comps
| Address | Beds | Baths | Sqft | Rent | $/sqft | DOM | Units | Dist |
|---|---|---|---|---|---|---|---|---|
| 2878 Snapfinger Mnr Decatur, GA | 3.0 | 2.5 | 1670 | $1,780 | $1.07 | 5d | 1 | 0.48mi |
| 2993 Havenwood Way Lithonia, GA | 4.0 | 2.0 | 2655 | $2,300 | $0.87 | 45d | 1 | 0.54mi |
| 4936 Longview Run Decatur, GA | 4.0 | 2.5 | 2238 | $2,900 | $1.30 | 45d | 1 | 0.67mi |
| 4948 Longview Run Decatur, GA | 3.0 | 2.0 | 1892 | $2,135 | $1.13 | 7d | 1 | 0.67mi |
| 5108 Jack Dr Decatur, GA | 3.0 | 2.5 | 1872 | $2,185 | $1.17 | 26d | 1 | 0.68mi |
| 3095 Riders Trl Decatur, GA | 3.0 | 2.0 | 1800 | $4,500 | $2.50 | 1d | 1 | 0.69mi |
| 5388 Winding Glen Dr Lithonia, GA | 4.0 | 2.5 | 2251 | $2,230 | $0.99 | 45d | 1 | 0.70mi |
| 2559 Walden Lake Dr Unit 1 Decatur, GA | 3.0 | 2.5 | 1464 | $2,000 | $1.37 | 45d | 1 | 0.72mi |
| 2937 Thompson Cir Decatur, GA | 3.0 | 2.0 | 1480 | $1,860 | $1.26 | 4d | 1 | 0.73mi |
| 2545 Walden Lake Dr Unit 1 Decatur, GA | 3.0 | 2.5 | 1464 | $2,000 | $1.37 | 45d | 1 | 0.73mi |
| 5038 Longview Walk Decatur, GA | 3.0 | 2.5 | 1577 | $1,995 | $1.27 | 45d | 1 | 0.74mi |
| 2564 Treadway Dr Decatur, GA | 3.0 | 2.0 | 1927 | $2,950 | $1.53 | 45d | 1 | 0.81mi |
| 4917 Longview Walk Decatur, GA | 3.0 | 2.5 | 1486 | $2,000 | $1.35 | 23d | 1 | 0.83mi |
| 2658 Avanti Way Decatur, GA | 3.0 | 2.5 | 1616 | $2,000 | $1.24 | 45d | 1 | 0.83mi |
| 2884 Thompson Cir Decatur, GA | 4.0 | 3.5 | 2868 | $6,400 | $2.23 | 26d | 1 | 0.85mi |
| 4908 Longview Walk Decatur, GA | 3.0 | 2.5 | 1480 | $2,000 | $1.35 | 45d | 1 | 0.85mi |
| 100 Cavalier Xing Stonecrest, GA | 3.0 | 2.0 | 1558 | $1,990 | $1.28 | 26d | 1 | 0.93mi |
| 2569 Terrace Trl Decatur, GA | 3.0 | 3.0 | 1752 | $1,800 | $1.03 | 45d | 1 | 0.96mi |
| 2563 Terrace Trl Decatur, GA | 3.0 | 3.0 | 1752 | $1,950 | $1.11 | 15d | 1 | 0.97mi |
| 2553 Terrace Trl Unit 2553 Decatur, GA | 3.0 | 2.0 | 1865 | $1,950 | $1.05 | 15d | 1 | 0.98mi |
| 2525 Terrace Trl Unit 2525 Decatur, GA | 3.0 | 3.0 | 1593 | $1,850 | $1.16 | 15d | 1 | 1.02mi |
| 2481 Terrace Trl Decatur, GA | 3.0 | 3.0 | 1752 | $2,050 | $1.17 | 45d | 1 | 1.12mi |
| 3468 Deer Trce Lithonia, GA | 3.0 | 1.0 | 1886 | $2,800 | $1.48 | 26d | 1 | 1.21mi |
| 5089 Galleon Xing Decatur, GA | 4.0 | 2.5 | 2488 | $2,460 | $0.99 | 46d | 1 | 1.22mi |
| 4955 Windsor Downs Ln Decatur, GA | 4.0 | 2.0 | 1888 | $2,050 | $1.09 | 7d | 1 | 1.25mi |
| 2450 Northmill Ln Decatur, GA | 4.0 | 2.5 | 2046 | $2,135 | $1.04 | 45d | 1 | 1.31mi |
| 4926 Windsor Downs Ln Decatur, GA | 4.0 | 3.5 | 1675 | $1,000 | $0.60 | 1d | 1 | 1.31mi |
| 4433 Golf Vista Cir Decatur, GA | 3.0 | 2.5 | 1495 | $1,350 | $0.90 | 26d | 1 | 1.37mi |
| 4909 Truitt Ln Decatur, GA | 3.0 | 2.0 | 1697 | $2,500 | $1.47 | 45d | 1 | 1.38mi |
| 4919 Wilkins Station Dr Decatur, GA | 3.0 | 2.0 | 1770 | $2,161 | $1.22 | 23d | 1 | 1.44mi |
Listing history 40 events
-
2026-06-21days on market $263,000 Active 5 DOM
-
2026-06-18days on market $263,000 Active 2 DOM
-
2026-06-17remarks 699-char remark
-
2026-06-17pricedays on market $263,000 Active 1 DOM
-
2026-06-04days on market $168,640 Active 252 DOM
-
2026-06-03days on market $168,640 Active 251 DOM
-
2026-06-02days on market $168,640 Active 250 DOM
-
2026-06-01days on market $168,640 Active 249 DOM
-
2026-05-31days on market $168,640 Active 248 DOM
-
2026-04-08price $168,640 244-char remark
-
2025-12-31historical
-
2025-12-31historical
-
2025-10-29price $195,840 244-char remark
-
2025-09-25$214,880 Active 244-char remark
-
2025-07-30$315,000 New
-
2025-07-30$315,000 Active
-
2023-08-14soldstatus $315,000
-
2023-08-07soldstatus $315,000 Sold
-
2023-08-07soldstatus $315,000 Closed
-
2023-06-15status Pending
-
2023-06-15status Under Contract
-
2023-06-08status Price Change
-
2023-06-08status Active
-
2023-06-08price $314,900
-
2023-06-08price $314,900
-
2023-05-01status Under Contract
-
2023-05-01status Pending
-
2023-04-27$289,900 New
-
2023-04-27$289,900 Active
-
2022-05-12price $1,895
-
2014-10-30price $23,900
-
2012-07-20historical
-
2012-07-20soldstatus $26,267 Sold
-
2012-06-05historical Pending Approval
-
2012-06-05price $26,267
-
2012-05-29price $23,900
-
2012-05-26price $45,900
-
2012-05-08$55,000 New
-
2004-02-24soldstatus $145,000
-
1986-12-09soldstatus $72,500
ⓘ Source: listings_history table (triggers on properties + properties_extension) + one-shot
backfill from property_details.listing_events for pre-trigger history.
Tax reassessment forecast GA · Resets to sale price
- Current annual tax
- $5,926 · $494/mo
- Projected year-2 tax
- $5,926 · $494/mo
- Expected delta
- $0/yr ($0/mo · 0.0%)
ⓘ Screening estimate from a state-policy table — verify with the county assessor before closing.
Climate risk First Street
- Flood 1/10 Low FEMA zone X (unshaded) · 0% chance over 30 yrs
- Wildfire 1/10 Low
- Heat 6/10 Major 7 d/yr ≥105°F today · 18 d/yr by 30 yrs out
- Wind 5/10 Major 26% chance of damaging wind over 30 yrs
- Air quality 5/10 Major 7 unhealthy d/yr today · 10 by 30 yrs out
Nearby sold comps map
Loading sold comps map…
Walkable amenities ~0.75 mi
Loading nearby amenities…
Taxation est. · year 1
- Rental income
- $27,982
- − Mortgage interest
- −$14,732
- − Property taxes
- −$5,926
- − Insurance
- −$1,315
- − Repairs & maintenance
- −$2,239
- − Management
- −$2,239
- − Depreciation
- −$7,651
- Taxable loss
- −$6,119
- Est. tax savings @ 24.0%
- +$1,469
- After-tax cash flow
- $-217/yr
For passive investors: Depreciation is non-cash, so a rental often shows a tax loss while cash-flowing — sheltering income. Rental losses are passive: they offset passive income freely, and up to $25,000/yr can offset ordinary (W-2) income if you actively participate and your MAGI is under $100k (phasing out to $0 by $150k); unused losses carry forward. On sale, claimed depreciation is recaptured at up to 25%, and gains may owe capital-gains tax (a 1031 exchange can defer both). Figures are a year-1 estimate at your 24.0% rate — not tax advice; consult a CPA.
Schools (NCES district)
- District
- Dekalb County
- NCES district ID
- 1301740
- Math proficiency
- 19% ▼ -12.00%
- Reading proficiency
- 28% ▼ -7.00%
- Median HH income
- $51,448
- Composite
- 20.92/100
- National rank
- #8482
- State rank
- #125 of 174 in GA
Livability — Stonecrest
No livability data for this city. (Only ~50 U.S. cities are tracked.)
Census & demographics
- Census place
- Stonecrest, GA
- County
- Dekalb County · 782,738 people
- City population
- 106,165
- Metro
- Atlanta-Sandy Springs-Alpharetta, GA
- Population (ZIP)
- 43,776
- Household income
- $73,694
- Rent vs Own
- Severe rent burden
- 1168.0
Population outlook (DeKalb County) Hauer SSP2
- Today (2025)
- 839,977 people
- By 2030
- 891,768 · +6.2%
- By 2040
- 988,894 · +17.7%
- By 2050
- 1,074,583 · +27.9%
- By 2075
- 1,245,026 · +48.2%
- By 2100
- 1,303,135 · +55.1%
Race, ethnicity, and origin ACS 2023
- Neighborhood character
- Predominantly Black (84%)
- Race & ethnicity
- Black 84% Two or more races 10% Hispanic / Latino 5% White 4% Asian 1%
- Foreign-born
- 12% · Canada, China
- Languages at home
- 90% English-only · Spanish 5% French/Haitian/Cajun 1% Other Indo-European 0%
Political lean MEDSL · DeKalb
- 2024 margin
- Solid D (+64.8) · D 81.9% · R 17.1% · Other 1.0%
- 2008→2024 swing
- +6.1pp toward D · 2008: 58.6pp · 2024: 64.8pp
- All cycles
- 2024: D+64.8 2020: D+67.4 2016: D+64.8 2012: D+56.8 2008: D+58.6
Not yet ingested
- Civics
- —
Market trends
- HPI YoY
- ▼ -74.98%
- Current HPI
- 192.8328
- Rent YoY
- ▲ 4.60%
- Metro
- Atlanta-Sandy Springs-Alpharetta, GA
- State GDP YoY
- ▲ 2.66%
- F500 in state
- 28
Industry mix (Fortune 500 HQ in GA)
| Industry | F500 HQs | Revenue |
|---|---|---|
| Paper / Packaging | 2 | $29B |
|
||
| Retail | 1 | $160B |
|
||
| Transportation / Logistics | 1 | $91B |
|
||
| Airlines | 1 | $62B |
|
||
| Consumer Goods | 1 | $47B |
|
||
| Utilities | 1 | $25B |
|
||
Price history
+262.8% since first listed32 events — show timeline
- 2026-06-16 Listed $263,000 GAMLS
- 2026-06-16 Listed $263,000 FMLS
- 2026-04-08 Price Changed $168,640 MGMLS
- 2025-12-31 Listing Removed — GAMLS
- 2025-12-31 Listing Removed — FMLS
- 2025-10-29 Price Changed $195,840 MGMLS
- 2025-07-30 Listed $315,000 GAMLS
- 2025-07-30 Listed $315,000 FMLS
- 2023-08-14 Sold (Public Records) $315,000 Public Records
- 2023-08-07 Sold (MLS) $315,000 FMLS
- 2023-08-07 Sold (MLS) $315,000 GAMLS
- 2023-06-15 Pending — FMLS
- 2023-06-15 Pending — GAMLS
- 2023-06-08 Relisted — GAMLS
- 2023-06-08 Relisted — FMLS
- 2023-06-08 Price Changed $314,900 GAMLS
- 2023-06-08 Price Changed $314,900 FMLS
- 2023-05-01 Pending — GAMLS
- 2023-05-01 Pending — FMLS
- 2023-04-27 Listed $289,900 FMLS
- 2023-04-27 Listed $289,900 GAMLS
- 2022-05-12 Price Changed $1,895 RENT.
- 2014-10-30 Price Changed $23,900 GAMLS
- 2012-07-20 Listing Removed — GAMLS
- 2012-07-20 Sold (MLS) $26,267 GAMLS
- 2012-06-05 Contingent — GAMLS
- 2012-06-05 Price Changed $26,267 GAMLS
- 2012-05-29 Price Changed $23,900 GAMLS
- 2012-05-26 Price Changed $45,900 GAMLS
- 2012-05-08 Listed $55,000 GAMLS
- 2004-02-24 Sold (Public Records) $145,000 Public Records
- 1986-12-09 Sold (Public Records) $72,500 Public Records
Property tax history
+4.9%/yrLatest (2025): $5,926 · +14.5% YoY. Source: county tax records.
Cash-flow waterfall
monthlySold comps — $/sqft
last 12 mo · ≤1 miLoading sold comps…