655 Crabtree Ct · Lehigh Acres, FL
Flood risk 5/10 · Moderate
- FEMA flood zone
- X (unshaded)
- Chance of flooding over 30 yrs
- 0.66%
- Est. flood insurance / yr
- $507 – $1,088
Fire risk 3/10 · Minor
- Est. fire insurance / yr
- $947 – $1,759
Heat risk 9/10 · Severe
- Hot days now (above 108°F)
- 7 days/yr
- Hot days in 30 yrs
- 27 days/yr
Wind risk 10/10 · Severe
- Chance of severe wind over 30 yrs
- 99.0%
Air-quality risk 2/10 · Minimal
- Unhealthy air days now
- 1 days/yr
- Unhealthy air days in 30 yrs
- 2 days/yr
Risk factors via First Street. Map © Google.
Why this score? — see what drove the F grade
The composite is a weighted blend of 9 inputs, each scored 0–100. Each bar is that input's sub-score; the figure is the points it added to the 100-point composite (weight × sub-score).
- ARV discount +7.5/15.0
- Cash flow +6.3/30.0
- Schools +4.1/10.0
- Rent growth +3.8/5.0
- Livability +3.0/5.0
- Condition / age +2.5/5.0
- 1% rule +1.5/10.0
- DSCR +0.7/10.0
- Appreciation +0.0/10.0
$337,515
🖨 Deal sheet (PDF) 📄 Offer letter ✓ Due diligence
Listing remarks
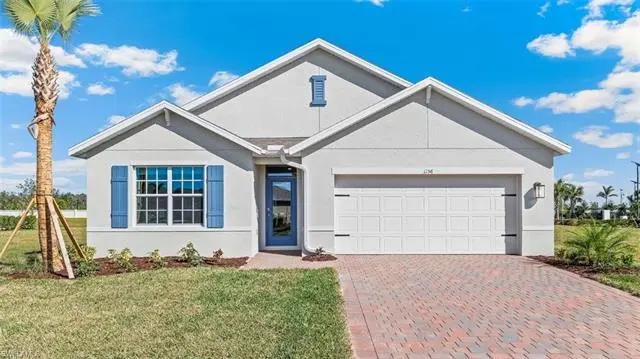
This luxurious reinforced concrete block NEW construction, 4-Bedroom, 2-Bathroom, 2-Car Garage, Cali Model, delivers all the modern amenities for comfortable living. All this, on an oversize 1/3 Acre Lot at the end of a cul-de-sac. The open and spacious kitchen boasts solid surface Quartz countertops and large island, perfect for entertaining, stainless-steel appliances and light shaker style white cabinets. The primary ensuite includes solid surface quartz countertops, dual vanity and a walk-in shower, additional linen closet, expansive walk-in closet and private water closet. Other features include a laundry room, with washer and dryer hook up, Ceramic tile 6”x 24” plank floor
Key facts
- Dual vanity
- Primary ensuite
- Large island
Tags
Neighborhood map
What this means for you Summary
Snapshot
- This is a 4-bed/2.0-bath land listed at $338k.
Deal economics
- At list price, monthly cash flow is $-592 ($-7k/yr) — negative.
- To cash-flow at today's rent, offer at most $252k (25.4% below list).
- To meet the 1% rule (rent ≥ 1% of price), the offer needs to be $220k (34.7% below list).
- Recommended offer: $220k (34.7% below list) — sets the bar for 1% rule.
Location & tenants
- Location reads 59/100 on livability (#826 in FL) — a working-class tenant base; expect higher turnover. Strengths: cost of living A+, housing A+; Watch: crime C-, employment D+, schools D-.
- Lee (suburban): math 47% / reading 50% proficiency, ranked #42 of 73 in FL (top 58%) — families likely to look elsewhere, expect single-tenant / working-renter base with shorter leases.
- Market conditions: Rents rising fast (+5.3%/yr); 1611 active listings in the ZIP; 35 comparable units currently listed for rent nearby; rentals at typical pace (median 22d on market — plan ~3-4 weeks tenant-placement turnaround); 15,411 units permitted in Lee County in 2024 (4,686 in 5+ unit buildings).
- This rent runs 36% of the median local income ($74k/yr) — at the standard rent-burdened threshold; future hikes will face affordability resistance.
Forward outlook
- Local home prices are declining (-3.0%/yr); year-one equity from $2k of loan paydown is wiped out by about $10k of value loss. Plan a longer hold.
- Lee County population projected at +44% by 2050 — long-run rental-demand tailwind backs the buy-and-hold thesis.
Negotiation context
- Only 10 days on market — expect competitive offers; lowballing is unlikely to land.
Risks & watch-outs
- Climate carrying-cost: moderate flood risk; severe wind risk, 99% chance of damaging wind over 30y; extreme-heat days projected 7→27/yr by 2055 (HVAC capex compounding) — expect insurance premiums to compound above CPI over the hold.
Questions for the listing agent
- What do current leases actually rent for vs. the listed asking? Can we see a recent rent roll and the last 12 months of T-12 income?
- Is there a deadline driving the sale (1031 exchange, divorce, estate, relocation)? That informs how much negotiation room exists.
- Schools are D-rated, which usually means shorter tenancies and higher turnover. Who's the typical renter profile here, and what's been the actual vacancy rate?
- The area grade is low — what's the realistic commute time and amenity access for the typical tenant pool here? Any planned neighborhood developments (good or bad) we should know about?
- What's the average days-on-market for RENTAL listings here right now (not sales)? A rising rental-DOM trend means longer vacancies and softer asking-rent achievability than the comps imply.
- What's the recent tenant-quality profile in this submarket — average credit score on applications, eviction rate, late-payment / NSF rate, and stable-employment percentage? A property-management company in the area should have these aggregated.
- How much new for-sale + rental construction is in the pipeline within 1–3 miles? Heavy new supply typically softens prices + rents 12–24 months out; constrained supply supports both.
Investment metrics
- 1% rule
- 0.65% ✗
- Cap rate
- 4.19%
- Cash-on-cash
- -7.52%
- DSCR
- 0.67
- GRM
- 12.8
CMA / ARV
No comps found within radius.
Projected returns pro-forma
-3.0% appreciation · 5.33% rent growth · sell at horizon
- IRR
- -26.9%
- Equity multiple
- 0.08×
- Total profit
- $-87,109
- Equity at exit
- $50,325
- IRR
- -18.0%
- Equity multiple
- -0.07×
- Total profit
- $-101,566
- Equity at exit
- $29,182
Cash invested: $94,504 (down + closing). Projections, not guarantees.
Landlord ↔ Tenant lean methodology
- Overall (STATE)
- 87 Strongly Landlord-Friendly
- State Florida
- 87 Strongly Landlord-Friendly · R+3
- County
- — inherits STATE
- City
- — inherits STATE
ZIP-level market 33972
- Home prices YoY
- -13.6%
- Rents YoY
- 5.3%
- Active inventory
- 1611
- Price-to-rent
- 12.8×
Monthly cashflow live
- Estimated rent
- $2,203 high interval (Pro) →
- Mortgage (P&I)
- −$1,770
- Tax est. 1.5%
- −$422 /mo · $5,063/yr
- Insurance
- −$141
- HOA
- −$0
- Vacancy / Maint / Mgmt
- −$463
- Net cashflow
- $-592
Break-even live
Sensitivity live
| Price | -10% $-359 | -5% $-476 | +0% $-592 | +5% $-709 | +10% $-826 |
|---|---|---|---|---|---|
| Rent | -10% $-766 | -5% $-679 | +0% $-592 | +5% $-505 | +10% $-418 |
| Rate | -1.0pp $-422 | -0.5pp $-507 | base $-592 | +0.5pp $-680 | +1.0pp $-769 |
UW: 25.0% down · 7.5% · 30yr · 1.5% tax · 5.0% vac · 8.0% maint · 8.0% mgmt
Financing live
Cash to close
- Down payment
- $84,379
- Closing costs
- $10,125
- Reserves months
- —
- Total cash needed
- —
Loan-product check · same deal, 3 products live
Conventional
25% down · 7.5% · 30yr
- Down + closing
- —
- Monthly P&I
- —
- Monthly cashflow
- —
- DSCR
- —
- Eligible?
- —
Personal DTI + credit; lowest rate.
DSCR
20% down · 8.5% · 30yr
- Down + closing
- —
- Monthly P&I
- —
- Monthly cashflow
- —
- DSCR
- —
- Eligible?
- —
No personal income docs; deal must DSCR.
Hard money
10% down · 12.0% · 12mo
- Down + closing
- —
- Monthly P&I
- —
- Monthly cashflow
- —
- DSCR
- —
- Eligible?
- —
Short-term bridge; refi at stabilization.
Rent comps 35 comps
| Address | Beds | Baths | Sqft | Rent | $/sqft | DOM | Units | Dist |
|---|---|---|---|---|---|---|---|---|
| 652 Keller St E Lehigh Acres, FL | 3.0 | 2.0 | 1417 | $1,861 | $1.31 | 22d | 1 | 0.23mi |
| 771 Gaylord Ave S Lehigh Acres, FL | 3.0 | 2.0 | 1523 | $2,000 | $1.31 | 24d | 1 | 0.24mi |
| 804 Gaylord Ave S Lehigh Acres, FL | 4.0 | 2.0 | 1833 | $1,875 | $1.02 | 24d | 1 | 0.29mi |
| 758 Worth Ave Lehigh Acres, FL | 3.0 | 2.0 | 1360 | $2,000 | $1.47 | 16d | 1 | 0.31mi |
| 719 Fullerton Ave S Lehigh Acres, FL | 3.0 | 2.0 | 1650 | $2,000 | $1.21 | 20d | 1 | 0.34mi |
| 715 Bering Ave S Lehigh Acres, FL | 3.0 | 2.0 | 1835 | $1,895 | $1.03 | 22d | 1 | 0.45mi |
| 728 Crestline Ave S Lehigh Acres, FL | 4.0 | 3.0 | 1904 | $2,000 | $1.05 | 22d | 1 | 0.49mi |
| 814 Crystal Ave S Lehigh Acres, FL | 3.0 | 2.0 | 1865 | $1,815 | $0.97 | 24d | 1 | 0.53mi |
| 744 Oakridge Ave S Lehigh Acres, FL | 3.0 | 2.0 | 1493 | $2,000 | $1.34 | 20d | 1 | 0.63mi |
| 528 Raintree St E Lehigh Acres, FL | 4.0 | 3.0 | 1400 | $1,700 | $1.21 | 24d | 1 | 0.67mi |
| 826 Dawhert Ave S Lehigh Acres, FL | 4.0 | 2.0 | 1365 | $1,750 | $1.28 | 3d | 1 | 0.70mi |
| 760 Festival Ave S Lehigh Acres, FL | 3.0 | 2.0 | 1650 | $2,000 | $1.21 | 24d | 1 | 0.76mi |
| 696 Homestead Rd S Lehigh Acres, FL | 4.0 | 2.0 | 1777 | $2,200 | $1.24 | 24d | 1 | 0.77mi |
| 736 Barcia St E Lehigh Acres, FL | 4.0 | 2.0 | 1833 | $1,775 | $0.97 | 24d | 1 | 0.78mi |
| 711 Nimitz Blvd Lehigh Acres, FL | 4.0 | 2.0 | 1571 | $2,191 | $1.39 | 3d | 1 | 0.82mi |
| 710 Godwid Ave S Lehigh Acres, FL | 3.0 | 2.0 | 1758 | $2,150 | $1.22 | 3d | 1 | 1.01mi |
| 710 Godwid Ave S Lehigh Acres, FL | 3.0 | 2.0 | 1758 | $2,150 | $1.22 | 3d | 1 | 1.01mi |
| 710 Godwid Ave S Lehigh Acres, FL | 3.0 | 2.0 | 1758 | $2,150 | $1.22 | 22d | 1 | 1.01mi |
| 708 Godwid Ave S Lehigh Acres, FL | 3.0 | 2.0 | 1758 | $2,150 | $1.22 | 22d | 1 | 1.02mi |
| 737 Almelia St E Lehigh Acres, FL | 3.0 | 2.0 | 1404 | $1,745 | $1.24 | 22d | 1 | 1.04mi |
| 684 Thomas Sherwin Ave S Lehigh Acres, FL | 3.0 | 2.0 | 1288 | $1,695 | $1.32 | 3d | 1 | 1.06mi |
| 598 Aston Lake Ct Lehigh Acres, FL | 3.0 | 2.0 | 1703 | $2,395 | $1.41 | 22d | 1 | 1.09mi |
| 546 Whispering Wind Bnd Lehigh Acres, FL | 3.0 | 2.0 | 1437 | $1,950 | $1.36 | 2d | 1 | 1.10mi |
| 606 Morningmist Ln Lehigh Acres, FL | 4.0 | 2.5 | 1817 | $2,295 | $1.26 | 3d | 1 | 1.12mi |
| 567 Charwood Ave S Lehigh Acres, FL | 3.0 | 2.0 | 1564 | $1,900 | $1.21 | 15d | 1 | 1.15mi |
| 862 Charles Sise St E Lehigh Acres, FL | 3.0 | 2.0 | 1582 | $2,664 | $1.68 | 24d | 1 | 1.20mi |
| 604 Thomas Sherwin Ave S Lehigh Acres, FL | 4.0 | 2.0 | 1493 | $2,200 | $1.47 | 3d | 1 | 1.22mi |
| 541 Chalet Ave S Lehigh Acres, FL | 4.0 | 3.0 | 1650 | $2,400 | $1.45 | 24d | 1 | 1.28mi |
| 936 Joponica Ave S Lehigh Acres, FL | 4.0 | 2.0 | 2101 | $2,500 | $1.19 | 24d | 1 | 1.33mi |
| 1076 Gunby Ave S Lehigh Acres, FL | 3.0 | 2.0 | 1258 | $2,100 | $1.67 | 24d | 1 | 1.38mi |
| 515 Croydon Ave S Lehigh Acres, FL | 3.0 | 3.0 | 1253 | $2,200 | $1.76 | 3d | 1 | 1.39mi |
| 12441 Dakota Ridge Pl Lehigh Acres, FL | 4.0 | 2.5 | 1885 | $2,150 | $1.14 | 24d | 1 | 1.44mi |
| 908 Winters St E Lehigh Acres, FL | 3.0 | 2.0 | 1639 | $2,200 | $1.34 | 11d | 1 | 1.44mi |
| 530 Kilgour Ave Lehigh Acres, FL | 3.0 | 2.0 | 2214 | $1,795 | $0.81 | 3d | 1 | 1.44mi |
| 510 Caywood Ave S Lehigh Acres, FL | 3.0 | 2.0 | 1582 | $2,664 | $1.68 | 24d | 1 | 1.46mi |
Listing history 5 events
-
2026-04-24status Pending
-
2026-04-14price $337,515
-
2026-04-14$362,515 Active
-
2026-01-16soldstatus $343,000
-
2022-02-10soldstatus $18,000
ⓘ Source: listings_history table (triggers on properties + properties_extension) + one-shot
backfill from property_details.listing_events for pre-trigger history.
Climate risk First Street
- Flood 5/10 Major FEMA zone X (unshaded) · 66% chance over 30 yrs
- Wildfire 3/10 Moderate
- Heat 9/10 Extreme 7 d/yr ≥108°F today · 27 d/yr by 30 yrs out
- Wind 10/10 Extreme 99% chance of damaging wind over 30 yrs
- Air quality 2/10 Low 1 unhealthy d/yr today · 2 by 30 yrs out
Nearby sold comps map
Loading sold comps map…
Walkable amenities ~0.75 mi
Loading nearby amenities…
Taxation est. · year 1
- Rental income
- $26,431
- − Mortgage interest
- −$18,906
- − Property taxes
- −$5,063
- − Insurance
- −$1,688
- − Repairs & maintenance
- −$2,114
- − Management
- −$2,114
- − Depreciation
- −$9,819
- Taxable loss
- −$13,273
- Est. tax savings @ 24.0%
- +$3,186
- After-tax cash flow
- $-3,924/yr
For passive investors: Depreciation is non-cash, so a rental often shows a tax loss while cash-flowing — sheltering income. Rental losses are passive: they offset passive income freely, and up to $25,000/yr can offset ordinary (W-2) income if you actively participate and your MAGI is under $100k (phasing out to $0 by $150k); unused losses carry forward. On sale, claimed depreciation is recaptured at up to 25%, and gains may owe capital-gains tax (a 1031 exchange can defer both). Figures are a year-1 estimate at your 24.0% rate — not tax advice; consult a CPA.
Schools (NCES district)
- District
- Lee
- NCES district ID
- 1201080
- Math proficiency
- 47% ▼ -11.00%
- Reading proficiency
- 50% ▼ -4.00%
- Median HH income
- $49,518
- Composite
- 41.49/100
- National rank
- #3458
- State rank
- #42 of 73 in FL
Livability — Lehigh Acres
- Score
- 59/100
- State rank
- #826
- US rank
- #20055
Category grades
Schools grade is shown separately in the Schools card above.
Census & demographics
- Census place
- Lehigh Acres, FL
- County
- Lee County · 788,662 people
- City population
- 130,638
- Metro
- Cape Coral-Fort Myers, FL
- Population (ZIP)
- 17,285
- Household income
- $73,819
- Rent vs Own
- Severe rent burden
- 190.0
Population outlook (Lee County) Hauer SSP2
- Today (2025)
- 871,946 people
- By 2030
- 955,468 · +9.6%
- By 2040
- 1,113,587 · +27.7%
- By 2050
- 1,256,891 · +44.1%
- By 2075
- 1,560,270 · +78.9%
- By 2100
- 1,726,848 · +98.0%
Race, ethnicity, and origin ACS 2023
- Neighborhood character
- Diverse neighborhood (Simpson 0.65)
- Race & ethnicity
- White 44% Hispanic / Latino 38% Two or more races 21% Black 13%
- Hispanic origin (detail)
- Mexican 8% Puerto Rican 7% Cuban 18%
- Common ancestry
- Hispanic 6% Italian 2% Romanian 2%
- Foreign-born
- 27% · Canada, Guatemala
- Languages at home
- 61% English-only · Spanish 32% French/Haitian/Cajun 4% Other Indo-European 1%
Political lean MEDSL · Lee
- 2024 margin
- Strong R (+28.4) · D 35.5% · R 63.9%
- 2008→2024 swing
- -18.0pp toward R · 2008: -10.4pp · 2024: -28.4pp
- All cycles
- 2024: R+28.4 2020: R+19.2 2016: R+20.4 2012: R+16.6 2008: R+10.4
Not yet ingested
- Civics
- —
Market trends
- HPI YoY
- ▼ -53.97%
- Current HPI
- 343.484
- Rent YoY
- ▲ 5.33%
- Metro
- Cape Coral-Fort Myers, FL
- State GDP YoY
- ▲ 3.28%
- F500 in state
- 36
Industry mix (Fortune 500 HQ in FL)
| Industry | F500 HQs | Revenue |
|---|---|---|
| Industrial Technology | 2 | $29B |
|
||
| Insurance | 2 | $17B |
|
||
| Retail | 1 | $60B |
|
||
| Technology Distribution | 1 | $58B |
|
||
| Homebuilding | 1 | $35B |
|
||
| Technology Manufacturing | 1 | $35B |
|
||
Price history
+1775.1% since first listed5 events — show timeline
- 2026-04-24 Pending — NAPLESMLS
- 2026-04-14 Price Changed $337,515 NAPLESMLS
- 2026-04-14 Listed $362,515 NAPLESMLS
- 2026-01-16 Sold (Public Records) $343,000 Public Records
- 2022-02-10 Sold (Public Records) $18,000 Public Records
Property tax history
+17.1%/yrLatest (2025): $455 · +9.7% YoY. Source: county tax records.
Cash-flow waterfall
monthlySold comps — $/sqft
last 12 mo · ≤1 miLoading sold comps…