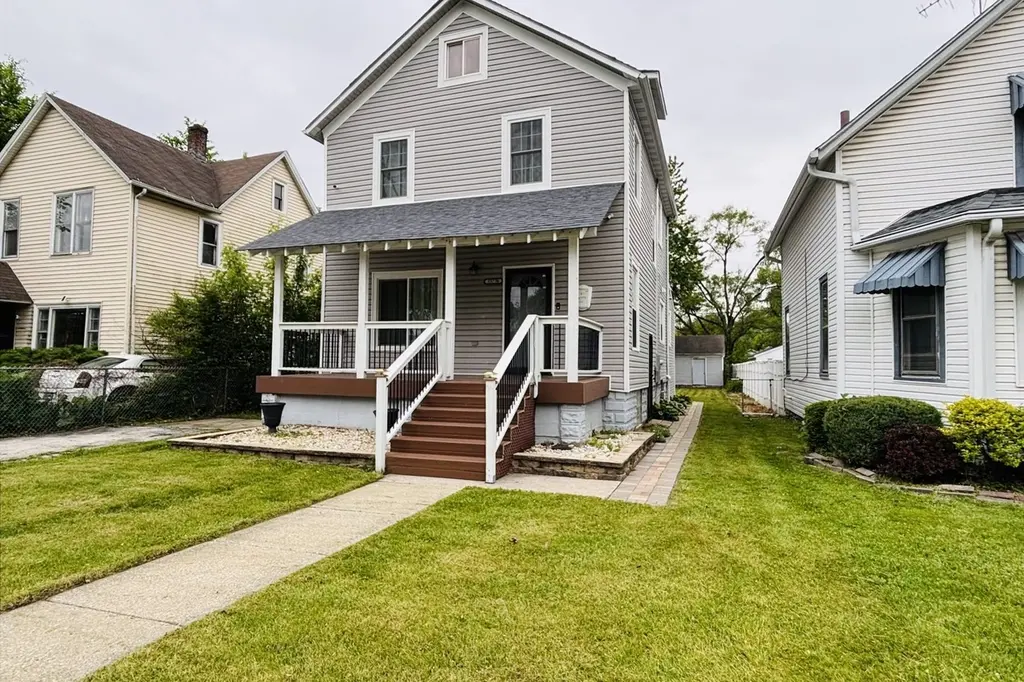
15736 Turlington Ave · Harvey, IL
Flood risk 4/10 · Minor
- FEMA flood zone
- X (unshaded)
- Chance of flooding over 30 yrs
- 0.22%
- Est. flood insurance / yr
- $473 – $860
Fire risk 1/10 · Minimal
- Est. fire insurance / yr
- $804 – $1,492
Heat risk 3/10 · Minor
- Hot days now (above 102°F)
- 7 days/yr
- Hot days in 30 yrs
- 15 days/yr
Wind risk 2/10 · Minimal
- Chance of severe wind over 30 yrs
- —
Air-quality risk 4/10 · Minor
- Unhealthy air days now
- 4 days/yr
- Unhealthy air days in 30 yrs
- 5 days/yr
Risk factors via First Street. Map © Google.
Why this score? — see what drove the F grade
The composite is a weighted blend of 9 inputs, each scored 0–100. Each bar is that input's sub-score; the figure is the points it added to the 100-point composite (weight × sub-score).
- Appreciation +10.0/10.0
- Cash flow +9.4/30.0
- 1% rule +3.4/10.0
- Livability +3.4/5.0
- DSCR +2.6/10.0
- Rent growth +2.5/5.0
- Condition / age +2.5/5.0
- Schools +0.7/10.0
- ARV discount +0.0/15.0
$218,900
🖨 Deal sheet (PDF) 📄 Offer letter ✓ Due diligence
Listing remarks
Welcome to this beautifully rehabbed 2 story home plus fininshed attic in the heart of Harvey. Home offers an incredible amount of living space with modern updates. Home has been redesigned with today's lifestyle in mind with complete new plumbing, electric etc. Step in to find a fresh contemporary interior which features updated floors, great lighting, and an inviting layout. The 2+1 levels of living space provides room for all whether you need additional bedrooms, a home office or guest accomodation. Home is move-in ready and ideal for buyers looking for space, style and value. Don't miss this opportunity to own this beautiful gem and make memories. Don't wait, come see it today and brin
Key facts
- 0.25 acre lot
- 2 garage spots
- Built 1913
Property features AI
Finance
- Other: Ownership: Fee simple; Not currently leased; School bus service and commuter transit access nearby
- HOA & community: No master association fee required
Exterior
- Parking: Detached garage (garage owned) with 2 garage spaces; Total parking for 2 vehicles
- Utilities: Water source: Lake Michigan; Public sewer and storm sewer
- Home design: Detached single-family home; 2-story structure; Rebuilt/rehab completed in 2022; Property faces within the City of Harvey, Thornton Township
- Construction: Vinyl siding exterior; Asphalt roof; Concrete perimeter foundation; Original construction over 100 years old (rebuilt in 2022)
- Exterior features: Fenced yard; Lot dimensions approximately 44 x 179; Lot under 0.25 acre; Curbs, sidewalks, street lights, and paved streets in the neighborhood
Interior
- Kitchen: Kitchen on main level
- Bedrooms: 5 bedrooms (including master bedroom on second level; other bedrooms on main and second levels)
- Bathrooms: 2 full bathrooms; 1 half bathroom
- Heating & cooling: Electric heating; Central air conditioning
- Interior features: 9 total rooms; Full attic; Full, unfinished basement
- Laundry & utility: Laundry room
Neighborhood map
What this means for you Summary
Snapshot
- This is a 4-bed/3.0-bath single-family listed at $219k.
Deal economics
- At list price, monthly cash flow is $-157 ($-2k/yr) — negative.
- To cash-flow at today's rent, offer at most $191k (12.7% below list).
- To meet the 1% rule (rent ≥ 1% of price), the offer needs to be $185k (15.7% below list).
- Recommended offer: $185k (15.7% below list) — sets the bar for 1% rule.
- Cap rate 5.4% vs local median 9.3% in Harvey — below-typical yield; the buyer is paying a premium for something (appreciation thesis, condition, location) that the cap rate doesn't capture.
Location & tenants
- Location reads 67/100 on livability (#539 in IL) — a middle-class / working-renter tenant base. Strengths: commute A+, cost of living A+, housing A-; Watch: health & safety D+, crime F, amenities F.
- Thornton Twp Hsd 205 (suburban): math 7% / reading 8% proficiency, ranked #594 of 620 in IL (top 96%) — low school quality limits family demand, transient renter base, plan for 1-2y turnover.
- Zoned schools: Brooks Middle School (math 3% / reading 14%, grade F, #605 of 665 statewide, top 91%, 487 students, 0% FRL); Thornton Township High School (math 7% / reading 7%, grade F, #605 of 693 statewide, top 87%, 1,628 students, 0% FRL).
- Market conditions: 133 active listings in the ZIP; 6,272 units permitted in Cook County in 2024 (4,658 in 5+ unit buildings).
Forward outlook
- In year one you build about $23k of equity ($2k loan paydown + $22k appreciation (10.0% local appreciation)).
- By year 2, paydown + projected appreciation supports a ~$38k cash-out refi (75% LTV) — recoverable capital for the next deal without selling this one.
Negotiation context
- It's been on market 28 days — a 2% lower offer ($216k) is reasonable based on typical stale-listing flexibility.
- 10 sale attempts since 20y ago; this cycle's ask is 2819% above the opening price — seller raised mid-cycle; expect resistance to lowballs.
- Current owner paid $7k; list at $219k implies a 3119% gain — meaningful room to come down on a strong offer.
Risks & watch-outs
- Watch-outs: built in 1913 — expect roof / HVAC / electrical / plumbing capex.
Questions for the listing agent
- What do current leases actually rent for vs. the listed asking? Can we see a recent rent roll and the last 12 months of T-12 income?
- Built in 1913 — when were the roof, HVAC, electrical panel, plumbing, and water heater last replaced?
- Is there a deadline driving the sale (1031 exchange, divorce, estate, relocation)? That informs how much negotiation room exists.
- Schools are F-rated, which usually means shorter tenancies and higher turnover. Who's the typical renter profile here, and what's been the actual vacancy rate?
- Crime grade is F in this area — have there been break-ins, vandalism, or insurance claims at this property in the last 3 years? What carrier currently insures it and at what premium?
- The area grade is low — what's the realistic commute time and amenity access for the typical tenant pool here? Any planned neighborhood developments (good or bad) we should know about?
- What's the average days-on-market for RENTAL listings here right now (not sales)? A rising rental-DOM trend means longer vacancies and softer asking-rent achievability than the comps imply.
- What's the recent tenant-quality profile in this submarket — average credit score on applications, eviction rate, late-payment / NSF rate, and stable-employment percentage? A property-management company in the area should have these aggregated.
- How much new for-sale + rental construction is in the pipeline within 1–3 miles? Heavy new supply typically softens prices + rents 12–24 months out; constrained supply supports both.
Investment metrics
- 1% rule
- 0.84% ✗
- Cap rate
- 5.43%
- Cash-on-cash
- -3.07%
- DSCR
- 0.86
- GRM
- 9.9
CMA / ARV
- ARV (on-the-fly)
- $163,768
- Comps found
- 12
Show comp detail 12 sales within ~0.75 mi
| Address | Dist | Beds/Ba | Sqft | Sold | Price | $/sf | Match |
|---|---|---|---|---|---|---|---|
| 15521 Turlington Ave | 0.29mi | 4/2.5 | 1,678 (-10%) | 14mo | $44,000 | $26 | 57 |
| 15641 Marshfield Ave | 0.47mi | 5/2.0 (+1) | 2,000 (+8%) | 1mo | $224,900 | $112 | 56 |
| 15739 Myrtle Ave | 0.22mi | 3/1.5 (-1) | 1,704 (-8%) | 12mo | $150,000 | $88 | 54 |
| 16019 Vine Ave | 0.47mi | 3/2.5 (-1) | 1,800 (-3%) | 15mo | $215,000 | $119 | 53 |
| 15730 Paulina St | 0.55mi | 4/2.0 | 1,702 (-8%) | 4mo | $115,000 | $68 | 53 |
| 15944 Paulina St | 0.61mi | 4/2.0 | 1,980 (+6%) | 6mo | $72,500 | $37 | 52 |
| 15917 Page Ave | 0.61mi | 3/2.0 (-1) | 1,900 (+2%) | 8mo | $150,000 | $79 | 52 |
| 15529 Ashland Ave | 0.47mi | 3/2.5 (-1) | 2,100 (+13%) | 8mo | $80,000 | $38 | 42 |
| 46 E 155th St | 0.43mi | 3/2.0 (-1) | 1,600 (-14%) | 8mo | $139,900 | $87 | 41 |
| 16052 Halsted St Unit 2 | 0.71mi | 4/2.0 | 1,660 (-11%) | 15mo | $165,000 | $99 | 32 |
| 536-538 E Sibley BLVD | 0.68mi | 3/2.0 (-1) | 1,710 (-8%) | 20mo | $285,000 | $167 | 29 |
| 110 W 157th Pl | 0.74mi | 5/2.5 (+1) | 1,693 (-9%) | 19mo | $220,000 | $130 | 28 |
Match score weights: distance 35% · size 25% · config 20% · recency 20%. Top-matched comps best support the ARV.
Projected returns pro-forma
10.0% appreciation · 3.0% rent growth · sell at horizon
- IRR
- 22.1%
- Equity multiple
- 2.78×
- Total profit
- $109,306
- Equity at exit
- $197,202
- IRR
- 19.9%
- Equity multiple
- 6.38×
- Total profit
- $329,936
- Equity at exit
- $425,275
Cash invested: $61,292 (down + closing). Projections, not guarantees.
Landlord ↔ Tenant lean methodology
- Overall (STATE)
- 43 Moderately Tenant-Leaning
- State Illinois
- 43 Moderately Tenant-Leaning · D+7
- County
- — inherits STATE
- City
- — inherits STATE
ZIP-level market 60426
- Home prices YoY
- 6.9%
- Active inventory
- 133
- Price-to-rent
- 9.9×
Monthly cashflow live
- Estimated rent
- $1,845 medium interval (Pro) →
- Mortgage (P&I)
- −$1,148
- Tax from tax record
- −$376 /mo · $4,510/yr
- Insurance
- −$91
- HOA
- −$0
- Vacancy / Maint / Mgmt
- −$388
- Net cashflow
- $-157
Break-even live
Sensitivity live
| Price | -10% $-33 | -5% $-95 | +0% $-157 | +5% $-219 | +10% $-281 |
|---|---|---|---|---|---|
| Rent | -10% $-303 | -5% $-230 | +0% $-157 | +5% $-84 | +10% $-11 |
| Rate | -1.0pp $-47 | -0.5pp $-101 | base $-157 | +0.5pp $-214 | +1.0pp $-271 |
UW: 25.0% down · 7.5% · 30yr · 1.5% tax · 5.0% vac · 8.0% maint · 8.0% mgmt
Financing live
Cash to close
- Down payment
- $54,725
- Closing costs
- $6,567
- Reserves months
- —
- Total cash needed
- —
Loan-product check · same deal, 3 products live
Conventional
25% down · 7.5% · 30yr
- Down + closing
- —
- Monthly P&I
- —
- Monthly cashflow
- —
- DSCR
- —
- Eligible?
- —
Personal DTI + credit; lowest rate.
DSCR
20% down · 8.5% · 30yr
- Down + closing
- —
- Monthly P&I
- —
- Monthly cashflow
- —
- DSCR
- —
- Eligible?
- —
No personal income docs; deal must DSCR.
Hard money
10% down · 12.0% · 12mo
- Down + closing
- —
- Monthly P&I
- —
- Monthly cashflow
- —
- DSCR
- —
- Eligible?
- —
Short-term bridge; refi at stabilization.
Listing history 50 events
-
2026-06-21days on market $218,900 Active 28 DOM
-
2026-06-18days on market $218,900 Active 25 DOM
-
2026-06-17days on market $218,900 Active 24 DOM
-
2026-06-16days on market $218,900 Active 23 DOM
-
2026-06-15days on market $218,900 Active 22 DOM
-
2026-06-13pricedays on market $218,900 Active 20 DOM
-
2026-06-13days on market $224,900 Active 19 DOM
-
2026-06-09days on market $224,900 Active 16 DOM
-
2026-06-08days on market $224,900 Active 15 DOM
-
2026-06-07days on market $224,900 Active 14 DOM
-
2026-06-04days on market $224,900 Active 11 DOM
-
2026-06-03days on market $224,900 Active 10 DOM
-
2026-06-02days on market $224,900 Active 9 DOM
-
2026-06-01days on market $224,900 Active 8 DOM
-
2026-05-31days on market $224,900 Active 7 DOM
-
2025-07-21historical
-
2025-06-10price
-
2025-05-08price
-
2025-05-02price
-
2025-04-06price
-
2025-03-28Active
-
2025-02-23historical
-
2024-12-03price
-
2024-10-03Active
-
2024-09-10historical
-
2024-07-16status Active
-
2024-07-10historical
-
2024-07-08price
-
2024-07-08price
-
2024-04-16Active
-
2023-05-03historical
-
2019-05-24soldstatus $6,800 Closed Sale
-
2019-04-27status Contingent (Do Not Show)
-
2019-03-28price $6,800
-
2019-02-27$7,500 New
-
2013-04-25soldstatus $19,900 Closed Sale
-
2013-02-25status Pending
-
2013-01-14$19,900 New
-
2012-09-03historical
-
2011-09-02New
-
2008-06-16soldstatus $18,000
-
2008-04-02historical
-
2008-02-07$18,600
-
2008-01-24historical
-
2007-10-23
-
2007-06-22historical
-
2006-10-27
-
2000-08-14soldstatus $55,000
-
2000-07-10soldstatus $20,000
-
1997-02-25soldstatus $23,500
ⓘ Source: listings_history table (triggers on properties + properties_extension) + one-shot
backfill from property_details.listing_events for pre-trigger history.
Tax reassessment forecast IL · Partial reset (capped growth)
- Current annual tax
- $4,510 · $376/mo
- Projected year-2 tax
- $4,739 · $395/mo
- Expected delta
- +$230/yr (+$19/mo · 5.1%)
ⓘ Screening estimate from a state-policy table — verify with the county assessor before closing.
Climate risk First Street
- Flood 4/10 Moderate FEMA zone X (unshaded) · 22% chance over 30 yrs
- Wildfire 1/10 Low
- Heat 3/10 Moderate 7 d/yr ≥102°F today · 15 d/yr by 30 yrs out
- Wind 2/10 Low
- Air quality 4/10 Moderate 4 unhealthy d/yr today · 5 by 30 yrs out
Nearby sold comps map
Loading sold comps map…
Walkable amenities ~0.75 mi
Loading nearby amenities…
Taxation est. · year 1
- Rental income
- $22,145
- − Mortgage interest
- −$12,262
- − Property taxes
- −$4,510
- − Insurance
- −$1,094
- − Repairs & maintenance
- −$1,772
- − Management
- −$1,772
- − Depreciation
- −$6,368
- Taxable loss
- −$5,632
- Est. tax savings @ 24.0%
- +$1,352
- After-tax cash flow
- $-533/yr
For passive investors: Depreciation is non-cash, so a rental often shows a tax loss while cash-flowing — sheltering income. Rental losses are passive: they offset passive income freely, and up to $25,000/yr can offset ordinary (W-2) income if you actively participate and your MAGI is under $100k (phasing out to $0 by $150k); unused losses carry forward. On sale, claimed depreciation is recaptured at up to 25%, and gains may owe capital-gains tax (a 1031 exchange can defer both). Figures are a year-1 estimate at your 24.0% rate — not tax advice; consult a CPA.
Schools (NCES district)
- District
- Thornton Twp Hsd 205
- NCES district ID
- 1738970
- Math proficiency
- 7% ▬ 0.00%
- Reading proficiency
- 8% ▼ -2.00%
- Median HH income
- $43,392
- Composite
- 6.92/100
- National rank
- #9976
- State rank
- #594 of 620 in IL
Livability — Harvey
- Score
- 67/100
- State rank
- #539
- US rank
- #11162
Category grades
Schools grade is shown separately in the Schools card above.
Census & demographics
- Census place
- Harvey, IL
- City population
- 23,066
- Population (ZIP)
- 23,066
Population outlook (Cook County) Hauer SSP2
- Today (2025)
- 5,347,519 people
- By 2030
- 5,357,703 · +0.2%
- By 2040
- 5,324,924 · -0.4%
- By 2050
- 5,230,762 · -2.2%
- By 2075
- 4,785,735 · -10.5%
- By 2100
- 4,188,836 · -21.7%
Race, ethnicity, and origin ACS 2023
- Neighborhood character
- Majority Black (59%)
- Race & ethnicity
- Black 59% Hispanic / Latino 33% Two or more races 12% White 3% Asian 2%
- Hispanic origin (detail)
- Mexican 31%
- Foreign-born
- 17% · Canada
- Languages at home
- 67% English-only · Spanish 30% Other Indo-European 2% French/Haitian/Cajun 1%
Political lean MEDSL · Cook
- 2024 margin
- Solid D (+42.0) · D 70.4% · R 28.4% · Other 1.2%
- 2008→2024 swing
- -11.4pp toward R · 2008: 53.4pp · 2024: 42.0pp
- All cycles
- 2024: D+42.0 2020: D+50.3 2016: D+53.0 2012: D+49.4 2008: D+53.4
Not yet ingested
- Civics
- —
Market trends
- HPI YoY
- ▲ 20.36%
- Current HPI
- 313.7895
- Rent YoY
- —
- Metro
- —
- State GDP YoY
- ▲ 1.59%
- F500 in state
- 60
Industry mix (Fortune 500 HQ in IL)
| Industry | F500 HQs | Revenue |
|---|---|---|
| Insurance | 4 | $201B |
|
||
| Consumer Goods | 4 | $87B |
|
||
| Industrial Machinery | 3 | $64B |
|
||
| Healthcare | 2 | $55B |
|
||
| Retail / Pharmacy | 1 | $148B |
|
||
| Agriculture / Food | 1 | $86B |
|
||
Price history
-71.1% since first listed37 events — show timeline
- 2025-07-21 Listing Removed — MRED as Distributed by MLS Grid
- 2025-06-10 Price Changed — MRED as Distributed by MLS Grid
- 2025-05-08 Price Changed — MRED as Distributed by MLS Grid
- 2025-05-02 Price Changed — MRED as Distributed by MLS Grid
- 2025-04-06 Price Changed — MRED as Distributed by MLS Grid
- 2025-03-28 Listed — MRED as Distributed by MLS Grid
- 2025-02-23 Listing Removed — MRED as Distributed by MLS Grid
- 2024-12-03 Price Changed — MRED as Distributed by MLS Grid
- 2024-10-03 Listed — MRED as Distributed by MLS Grid
- 2024-09-10 Listing Removed — MRED as Distributed by MLS Grid
- 2024-07-16 Relisted — MRED as Distributed by MLS Grid
- 2024-07-10 Listing Removed — MRED as Distributed by MLS Grid
- 2024-07-08 Price Changed — MRED as Distributed by MLS Grid
- 2024-07-08 Price Changed — MRED as Distributed by MLS Grid
- 2024-04-16 Listed — MRED as Distributed by MLS Grid
- 2023-05-03 Listing Removed — MRED as Distributed by MLS Grid
- 2019-05-24 Sold (MLS) $6,800 MRED as Distributed by MLS Grid
- 2019-04-27 Pending — MRED as Distributed by MLS Grid
- 2019-03-28 Price Changed $6,800 MRED as Distributed by MLS Grid
- 2019-02-27 Listed $7,500 MRED as Distributed by MLS Grid
- 2013-04-25 Sold (MLS) $19,900 MRED as Distributed by MLS Grid
- 2013-02-25 Pending — MRED as Distributed by MLS Grid
- 2013-01-14 Listed $19,900 MRED as Distributed by MLS Grid
- 2012-09-03 Listing Removed — MRED as Distributed by MLS Grid
- 2011-09-02 Listed — MRED as Distributed by MLS Grid
- 2008-06-16 Sold (MLS) $18,000 MRED as Distributed by MLS Grid
- 2008-04-02 Listing Removed — MRED as Distributed by MLS Grid
- 2008-02-07 Listed $18,600 MRED as Distributed by MLS Grid
- 2008-01-24 Listing Removed — MRED as Distributed by MLS Grid
- 2007-10-23 Listed — MRED as Distributed by MLS Grid
- 2007-06-22 Listing Removed — MRED as Distributed by MLS Grid
- 2006-10-27 Listed — MRED as Distributed by MLS Grid
- 2000-08-14 Sold (Public Records) $55,000 Public Records
- 2000-07-10 Sold (Public Records) $20,000 Public Records
- 1997-02-25 Sold (Public Records) $65,000 Public Records
- 1997-02-25 Sold (Public Records) $22,500 Public Records
- 1997-02-25 Sold (Public Records) $23,500 Public Records
Property tax history
+1.5%/yrLatest (2023): $4,510 · +97.7% YoY. Source: county tax records.
Cash-flow waterfall
monthlySold comps — $/sqft
last 12 mo · ≤1 miLoading sold comps…