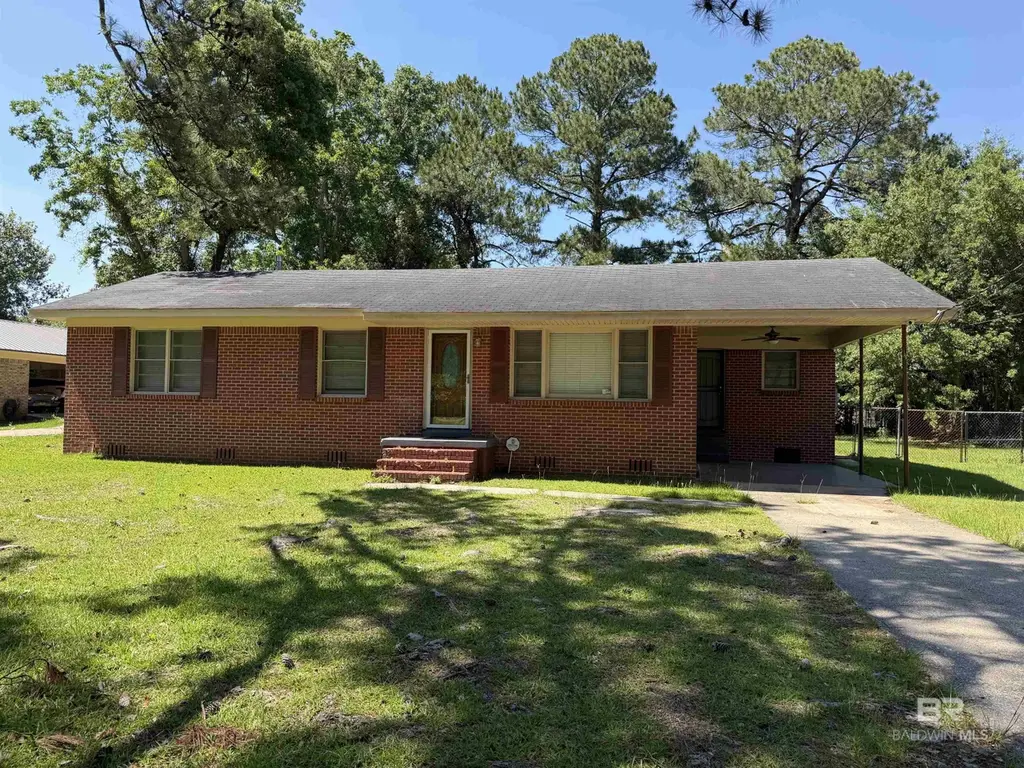
2204 David Dr · Mobile, AL
Flood risk 1/10 · Minimal
- FEMA flood zone
- X (unshaded)
- Chance of flooding over 30 yrs
- 0.0%
- Est. flood insurance / yr
- $507 – $1,088
Fire risk 2/10 · Minimal
- Est. fire insurance / yr
- $916 – $1,700
Heat risk 10/10 · Severe
- Hot days now (above 105°F)
- 7 days/yr
- Hot days in 30 yrs
- 22 days/yr
Wind risk 9/10 · Severe
- Chance of severe wind over 30 yrs
- 99.0%
Air-quality risk 2/10 · Minimal
- Unhealthy air days now
- 1 days/yr
- Unhealthy air days in 30 yrs
- 1 days/yr
Risk factors via First Street. Map © Google.
Why this score? — see what drove the B+ grade
The composite is a weighted blend of 9 inputs, each scored 0–100. Each bar is that input's sub-score; the figure is the points it added to the 100-point composite (weight × sub-score).
- Cash flow +30.0/30.0
- ARV discount +15.0/15.0
- DSCR +10.0/10.0
- 1% rule +8.0/10.0
- Rent growth +4.6/5.0
- Livability +3.8/5.0
- Condition / age +2.5/5.0
- Schools +2.3/10.0
- Appreciation +0.0/10.0
$104,900
🖨 Deal sheet 📄 Offer letter ✓ Due diligence
Listing remarks
Come check out this 4 sided brick home priced well below retail! There's lots of room for an easy fix and flip or perfect for a landlord to do a little TLC and this house will provide a nice rental property asset! This home has wood look tile flooring, ceramic tile and real hardwoods! Windows have been updated and the hvac is newer. You get so much for this price point! It has a huge yard for entertaining, and a very convenient location to the new international airport and I-10. This is an equitable interest listing where seller is selling only an option contract or assigning an interest in a contract, such as a purchase and sale agreement or a contract for deed. In this situation, the sel
Key facts
- Huge yard
- Convenient location
- Parking
Tags
Property features AI
Finance
- HOA & community: No HOA transfer fees; No community amenities
Exterior
- Parking: Single carport (1 covered space)
- Utilities: Electric service: Alabama Power; Public water and sewer (not otherwise specified)
- Home design: One-story property; Resale condition
- Construction: Brick construction; Pillar/Post/Pier foundation; Composition roof; Built area reported by seller
- Exterior features: Less than 1 acre lot; No waterfront; Whole/Full ownership
Interior
- Kitchen: Dishwasher; Disposal; Microwave; Electric range
- Flooring: Tile flooring; Wood flooring
- Bathrooms: 1 full bathroom
- Heating & cooling: Central heating; Central electric cooling
- Interior features: Ceiling fan(s); No fireplace
Neighborhood map
What this means for you Summary
Snapshot
- This is a 3-bed/1.0-bath single-family listed at $105k.
Deal economics
- At list price, monthly cash flow is $437 ($5k/yr) — positive.
- The deal already cash-flows at list — no discount required.
- Meets the 1% rule at list price ($1k rent vs $105k).
- Recommended offer: $103k (1.5% below list) — sets the bar for market timing.
- Cap rate 11.3% vs local median 4.9% in Mobile — top-decile yield for the area; either an underpriced asset or a hidden risk that comps aren't pricing in. Stress-test before assuming the spread holds.
Location & tenants
- Location reads 75/100 on livability (#20 in AL, #4,262 nationally) — a middle-class / working-renter tenant base. Strengths: commute A+, cost of living A+, housing A+; Watch: schools D-, crime F, employment D-.
- Mobile County (urban): math 15% / reading 39% proficiency, ranked #81 of 129 in AL (top 63%) — low school quality limits family demand, transient renter base, plan for 1-2y turnover; 67% free/reduced lunch — lower-income household profile, screen leases tightly.
- Market conditions: Rents rising fast (+8.3%/yr); 139 active listings in the ZIP; 13 comparable units currently listed for rent nearby; rentals at typical pace (median 21d on market — plan ~3-4 weeks tenant-placement turnaround); 46% of comp listings sitting > 30 days — soft ceiling on asking rent; lower-income renter base — watch delinquency; 1,678 units permitted in Mobile County in 2024 (264 in 5+ unit buildings).
- This rent runs 37% of the median local income ($44k/yr) — at the standard rent-burdened threshold; future hikes will face affordability resistance.
Forward outlook
- Local home prices are declining (-3.0%/yr); year-one equity from $725 of loan paydown is wiped out by about $3k of value loss. Plan a longer hold.
- Mobile County population projected to shrink 8% by 2050 — rents likely to lag national; underwrite the cash flow, not the appreciation.
- At projected returns (-3.0% appreciation + 8.0% rent growth), your $29k cash investment doubles in ~6 years — after that, you're playing with house money.
Negotiation context
- It's been on market 28 days — a 2% lower offer ($103k) is reasonable based on typical stale-listing flexibility.
Risks & watch-outs
- Climate carrying-cost: severe wind risk, 99% chance of damaging wind over 30y; extreme-heat days projected 7→22/yr by 2055 (HVAC capex compounding) — expect insurance premiums to compound above CPI over the hold.
Questions for the listing agent
- Is there a deadline driving the sale (1031 exchange, divorce, estate, relocation)? That informs how much negotiation room exists.
- Schools are D-rated, which usually means shorter tenancies and higher turnover. Who's the typical renter profile here, and what's been the actual vacancy rate?
- Crime grade is F in this area — have there been break-ins, vandalism, or insurance claims at this property in the last 3 years? What carrier currently insures it and at what premium?
- What's the average days-on-market for RENTAL listings here right now (not sales)? A rising rental-DOM trend means longer vacancies and softer asking-rent achievability than the comps imply.
- What's the recent tenant-quality profile in this submarket — average credit score on applications, eviction rate, late-payment / NSF rate, and stable-employment percentage? A property-management company in the area should have these aggregated.
- How much new for-sale + rental construction is in the pipeline within 1–3 miles? Heavy new supply typically softens prices + rents 12–24 months out; constrained supply supports both.
Investment metrics
- 1% rule
- 1.30% ✓
- Cap rate
- 11.29%
- Cash-on-cash
- 17.86%
- DSCR
- 1.79
- GRM
- 6.4
CMA / ARV
- ARV (on-the-fly)
- $148,122
- Comps found
- 8
Show comp detail 8 sales within ~0.75 mi
| Address | Dist | Beds/Ba | Sqft | Sold | Price | $/sf | Match |
|---|---|---|---|---|---|---|---|
| 2130 Barron Pl | 0.15mi | 3/2.0 | 1,326 (+5%) | 4mo | $136,000 | $103 | 78 |
| 2255 Pratt Dr | 0.36mi | 3/1.0 | 1,334 (+5%) | 1mo | $95,000 | $71 | 74 |
| 2224 Dauphin Island Pkwy | 0.03mi | 3/2.0 | 1,365 (+8%) | 21mo | $160,000 | $117 | 64 |
| 2305 Cassie Ln | 0.35mi | 3/2.0 | 1,205 (-5%) | 20mo | $105,000 | $87 | 55 |
| 2331 S Dog River Dr | 0.71mi | 3/1.0 | 1,366 (+8%) | 8mo | $167,000 | $122 | 47 |
| 2059 Magnolia Ln | 0.65mi | 3/2.0 | 1,114 (-12%) | 7mo | $175,000 | $157 | 40 |
| 2108 Old Military Rd | 0.63mi | 2/1.5 (-1) | 1,331 (+5%) | 22mo | $292,000 | $219 | 36 |
| 2329 Dog River Dr S | 0.70mi | 2/1.0 (-1) | 1,410 (+11%) | 11mo | $160,000 | $113 | 34 |
Match score weights: distance 35% · size 25% · config 20% · recency 20%. Top-matched comps best support the ARV.
Projected returns pro-forma
-3.0% appreciation · 8.0% rent growth · sell at horizon
- IRR
- 14.5%
- Equity multiple
- 1.61×
- Total profit
- $17,991
- Equity at exit
- $15,641
- IRR
- 26.5%
- Equity multiple
- 3.86×
- Total profit
- $84,086
- Equity at exit
- $9,070
Cash invested: $29,372 (down + closing). Projections, not guarantees.
Landlord ↔ Tenant lean methodology
- Overall (STATE)
- 90 Strongly Landlord-Friendly
- State Alabama
- 90 Strongly Landlord-Friendly · R+15
- County
- — inherits STATE
- City
- — inherits STATE
ZIP-level market 36605
- Rents YoY
- 8.3%
- Active inventory
- 139
- Price-to-rent
- 6.4×
Monthly cashflow live
- Estimated rent
- $1,360 high interval (Pro) →
- Mortgage (P&I)
- −$550
- Tax from tax record
- −$44 /mo · $522/yr
- Insurance
- −$44
- HOA
- −$0
- Vacancy / Maint / Mgmt
- −$286
- Net cashflow
- $437
Break-even live
UW: 25.0% down · 7.5% · 30yr · 1.5% tax · 5.0% vac · 8.0% maint · 8.0% mgmt
Financing live
Cash to close
- Down payment
- $26,225
- Closing costs
- $3,147
- Reserves months
- —
- Total cash needed
- —
Loan-product check · same deal, 3 products live
Conventional
25% down · 7.5% · 30yr
- Down + closing
- —
- Monthly P&I
- —
- Monthly cashflow
- —
- DSCR
- —
- Eligible?
- —
Personal DTI + credit; lowest rate.
DSCR
20% down · 8.5% · 30yr
- Down + closing
- —
- Monthly P&I
- —
- Monthly cashflow
- —
- DSCR
- —
- Eligible?
- —
No personal income docs; deal must DSCR.
Hard money
10% down · 12.0% · 12mo
- Down + closing
- —
- Monthly P&I
- —
- Monthly cashflow
- —
- DSCR
- —
- Eligible?
- —
Short-term bridge; refi at stabilization.
Rent comps 13 comps
| Address | Beds | Baths | Sqft | Rent | $/sqft | DOM | Units | Dist |
|---|---|---|---|---|---|---|---|---|
| 2115 Barron Pl Mobile, AL | 3.0 | 1.0 | 1000 | $1,200 | $1.20 | 43d | 1 | 0.19mi |
| 1815 Ogburn Ave Unit B Mobile, AL | 2.0 | 1.0 | 900 | $900 | $1.00 | 21d | 1 | 0.56mi |
| 2255 Dog River Ct Unit 1043454P Mobile, AL | 4.0 | 2.0 | 1851 | $2,890 | $1.56 | 21d | 1 | 0.78mi |
| 1601 Neshota Dr Apt 86 Mobile, AL | 3.0 | 1.0 | 880 | $900 | $1.02 | 43d | 1 | 1.01mi |
| 1601 Neshota Dr Mobile, AL | 2.0–3.0 | 1.0 | 815 | $825 | $1.01 | 13d | 7 | 1.01mi |
| 1854 Jacob Dr Unit Jacob Dr unit Mobile, AL | 4.0 | 2.0 | 1700 | $1,950 | $1.15 | 43d | 1 | 1.04mi |
| 2359 Vermillion Dr Mobile, AL | 3.0 | 1.0 | 1064 | $895 | $0.84 | 21d | 1 | 1.08mi |
| 2055 Steiner St Mobile, AL | 2.0 | 1.0 | 1797 | $895 | $0.50 | 43d | 1 | 1.15mi |
| 2665 S Faure Dr Mobile, AL | 4.0 | 1.0 | 1817 | $1,514 | $0.83 | 21d | 1 | 1.30mi |
| 2366 White St Unit B Mobile, AL | 2.0 | 1.0 | 900 | $845 | $0.94 | 43d | 1 | 1.33mi |
| 1351 Dauphin Island Pkwy Mobile, AL | 3.0 | 1.0 | 992 | $1,095 | $1.10 | 43d | 1 | 1.43mi |
| 1326 Doyle Ave Mobile, AL | 3.0 | 2.0 | 1518 | $1,750 | $1.15 | 13d | 1 | 1.43mi |
| 1806 Gill Rd Mobile, AL | 3.0 | 2.0 | 1360 | $1,250 | $0.92 | 21d | 1 | 1.50mi |
Listing history 20 events
-
2026-06-18days on market $104,900 Active 28 DOM
-
2026-06-17days on market $104,900 Active 27 DOM
-
2026-06-16days on market $104,900 Active 26 DOM
-
2026-06-15days on market $104,900 Active 25 DOM
-
2026-06-14days on market $104,900 Active 23 DOM
-
2026-06-13days on market $104,900 Active 22 DOM
-
2026-06-10days on market $104,900 Active 20 DOM
-
2026-06-09days on market $104,900 Active 19 DOM
-
2026-06-08days on market $104,900 Active 18 DOM
-
2026-06-07pricedays on market $104,900 Active 17 DOM
-
2026-06-05days on market $109,900 Active 14 DOM
-
2026-06-03days on market $109,900 Active 13 DOM
-
2026-06-02days on market $109,900 Active 12 DOM
-
2026-06-01days on market $109,900 Active 11 DOM
-
2026-05-31days on market $109,900 Active 10 DOM
-
2026-05-30days on market $109,900 Active 9 DOM
-
2026-05-21$115,000 Active
-
2026-02-12price $147,000
-
2005-04-18soldstatus $142,500
-
2004-12-22soldstatus $60,000
ⓘ Source: listings_history table (triggers on properties + properties_extension) + one-shot
backfill from property_details.listing_events for pre-trigger history.
Tax reassessment forecast AL · Resets to sale price
- Current annual tax
- $522 · $44/mo
- Projected year-2 tax
- $522 · $44/mo
- Expected delta
- $0/yr ($0/mo · 0.0%)
ⓘ Screening estimate from a state-policy table — verify with the county assessor before closing.
Climate risk First Street
- Flood 1/10 Low FEMA zone X (unshaded) · 0% chance over 30 yrs
- Wildfire 2/10 Low
- Heat 10/10 Extreme 7 d/yr ≥105°F today · 22 d/yr by 30 yrs out
- Wind 9/10 Extreme 99% chance of damaging wind over 30 yrs
- Air quality 2/10 Low 1 unhealthy d/yr today · 1 by 30 yrs out
Nearby sold comps map
Loading sold comps map…
Walkable amenities ~0.75 mi
Loading nearby amenities…
Taxation est. · year 1
- Rental income
- $16,320
- − Mortgage interest
- −$5,876
- − Property taxes
- −$522
- − Insurance
- −$524
- − Repairs & maintenance
- −$1,306
- − Management
- −$1,306
- − Depreciation
- −$3,052
- Taxable income
- $3,734
- Est. tax owed @ 24.0%
- −$896
- After-tax cash flow
- $4,348/yr
For passive investors: Depreciation is non-cash, so a rental often shows a tax loss while cash-flowing — sheltering income. Rental losses are passive: they offset passive income freely, and up to $25,000/yr can offset ordinary (W-2) income if you actively participate and your MAGI is under $100k (phasing out to $0 by $150k); unused losses carry forward. On sale, claimed depreciation is recaptured at up to 25%, and gains may owe capital-gains tax (a 1031 exchange can defer both). Figures are a year-1 estimate at your 24.0% rate — not tax advice; consult a CPA.
Schools (NCES district)
- District
- Mobile County
- NCES district ID
- 0102370
- Math proficiency
- 15% ▼ -28.00%
- Reading proficiency
- 39% ▬ 0.00%
- Median HH income
- $42,455
- Composite
- 22.9/100
- National rank
- #8002
- State rank
- #81 of 129 in AL
Livability — Mobile
- Score
- 75/100
- State rank
- #20
- US rank
- #4262
Category grades
Schools grade is shown separately in the Schools card above.
Census & demographics
- Census place
- Mobile, AL
- County
- Mobile County · 246,577 people
- City population
- 205,729
- Metro
- Mobile, AL
- Population (ZIP)
- 25,104
- Household income
- $43,538
- Rent vs Own
- Severe rent burden
- 1521.0
Population outlook (Mobile County) Hauer SSP2
- Today (2025)
- 415,303 people
- By 2030
- 411,755 · -0.9%
- By 2040
- 399,670 · -3.8%
- By 2050
- 382,616 · -7.9%
- By 2075
- 337,353 · -18.8%
- By 2100
- 283,391 · -31.8%
Race, ethnicity, and origin ACS 2023
- Neighborhood character
- Predominantly Black (67%)
- Race & ethnicity
- Black 67% White 27% Two or more races 4% Hispanic / Latino 3%
- Common ancestry
- Lithuanian 3% Slovak 2% Iranian 1%
- Foreign-born
- 3% · Canada
- Languages at home
- 97% English-only · Spanish 2%
Political lean MEDSL · Mobile
- 2024 margin
- R (+16.4) · D 41.3% · R 57.7%
- 2008→2024 swing
- -7.7pp toward R · 2008: -8.7pp · 2024: -16.4pp
- All cycles
- 2024: R+16.4 2020: R+11.9 2016: R+13.9 2012: R+9.3 2008: R+8.7
Not yet ingested
- Civics
- —
Market trends
- HPI YoY
- ▼ -96.46%
- Current HPI
- 125.9526
- Rent YoY
- ▲ 8.26%
- Metro
- Mobile, AL
- State GDP YoY
- ▲ 2.94%
- F500 in state
- 4
Industry mix (Fortune 500 HQ in AL)
| Industry | F500 HQs | Revenue |
|---|---|---|
| Financial Services | 1 | $8B |
|
||
| Healthcare | 1 | $5B |
|
||
Price history
+91.7% since first listed4 events — show timeline
- 2026-05-21 Listed $115,000 BCAR
- 2026-02-12 Price Changed $147,000 GCMLS AL
- 2005-04-18 Sold (Public Records) $142,500 Public Records
- 2004-12-22 Sold (Public Records) $60,000 Public Records
Property tax history
+3.5%/yrLatest (2025): $522 · +3.8% YoY. Source: county tax records.
Cash-flow waterfall
monthlySold comps — $/sqft
last 12 mo · ≤1 miLoading sold comps…