11296 Rexmere Blvd · Davie, FL
Flood risk 1/10 · Minimal
- FEMA flood zone
- X (shaded)
- Chance of flooding over 30 yrs
- 0.0%
- Est. flood insurance / yr
- $507 – $1,088
Fire risk 1/10 · Minimal
- Est. fire insurance / yr
- $947 – $1,759
Heat risk 10/10 · Severe
- Hot days now (above 105°F)
- 7 days/yr
- Hot days in 30 yrs
- 27 days/yr
Wind risk 10/10 · Severe
- Chance of severe wind over 30 yrs
- 99.0%
Air-quality risk 3/10 · Minor
- Unhealthy air days now
- 2 days/yr
- Unhealthy air days in 30 yrs
- 3 days/yr
Risk factors via First Street. Map © Google.
Why this score? — see what drove the B grade
The composite is a weighted blend of 9 inputs, each scored 0–100. Each bar is that input's sub-score; the figure is the points it added to the 100-point composite (weight × sub-score).
- Cash flow +30.0/30.0
- 1% rule +10.0/10.0
- DSCR +10.0/10.0
- ARV discount +7.5/15.0
- Schools +4.1/10.0
- Livability +4.1/5.0
- Condition / age +2.5/5.0
- Rent growth +2.3/5.0
- Appreciation +0.0/10.0
$119,000
🖨 Deal sheet (PDF) 📄 Offer letter ✓ Due diligence
Listing remarks
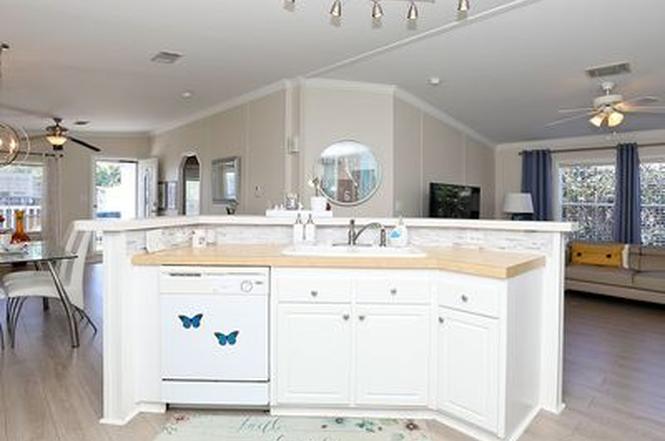
& acirc; & euro; & cent; Saint Angel & acirc; & euro; � This beautifully maintained and stunningly landscaped 2006 Fleetwood Lifestyle 3/2 home sits on a quiet and beautiful street. Enjoy morning coffee on your charming, rocking chair front porch and wave to friendly neighbors as they pass by. The home features an open concept split floor plan with the Master Suite in the rear and 2 guest bedrooms in the front of the home. The master bedroom is a relaxing sanctuary with the master bedroom, huge walk-in closet and large en suite featuring large his and her double vanity, walk-in shower and linen closet. This stunning home features pickled hardwood laminate flooring throug
Key facts
- Huge walk-in closet
- Large en suite
- Walk-in shower
Tags
Neighborhood map
What this means for you Summary
Snapshot
- This is a 3-bed/2.0-bath single-family listed at $119k.
Deal economics
- At list price, monthly cash flow is $2k ($23k/yr) — positive.
- The deal already cash-flows at list — no discount required.
- Meets the 1% rule at list price ($3k rent vs $119k).
- Cap rate 25.4% vs local median 3.4% in Davie — top-decile yield for the area; either an underpriced asset or a hidden risk that comps aren't pricing in. Stress-test before assuming the spread holds.
Location & tenants
- Location reads 82/100 on livability (#68 in FL, #1,159 nationally) — a professional / high-income tenant draw. Strengths: crime A+, housing A+, health & safety A+; Watch: cost of living D, amenities D-.
- Broward (suburban): math 42% / reading 53% proficiency, ranked #46 of 73 in FL (top 63%) — families likely to look elsewhere, expect single-tenant / working-renter base with shorter leases.
- Zoned schools: Fox Trail Elementary School (math 58% / reading 69%, grade B, #564 of 2,144 statewide, top 27%, 1,130 students, 53% FRL); Indian Ridge Middle School (math 55% / reading 60%, grade B, #157 of 571 statewide, top 28%, 2,020 students, 46% FRL); Western High School (math 43% / reading 60%, grade D+, #167 of 667 statewide, top 25%, 3,566 students, 43% FRL) — zoned schools at 47% FRL track the district average.
- Market conditions: Rents soft (-0.9%/yr); 179 active listings in the ZIP; 21 comparable units currently listed for rent nearby; rentals at typical pace (median 16d on market — plan ~3-4 weeks tenant-placement turnaround); solid renter incomes; 2,111 units permitted in Broward County in 2024 (1,265 in 5+ unit buildings).
- This rent runs 41% of the median local income ($101k/yr) — at the standard rent-burdened threshold; future hikes will face affordability resistance.
Forward outlook
- Local home prices are declining (-3.0%/yr); year-one equity from $823 of loan paydown is wiped out by about $4k of value loss. Plan a longer hold.
- Broward County population projected at +34% by 2050 — long-run rental-demand tailwind backs the buy-and-hold thesis.
- At projected returns (-3.0% appreciation + 0.0% rent growth), your $33k cash investment doubles in ~2 years — after that, you're playing with house money.
Negotiation context
- Only 5 days on market — expect competitive offers; lowballing is unlikely to land.
Risks & watch-outs
- Climate carrying-cost: severe wind risk, 99% chance of damaging wind over 30y; extreme-heat days projected 7→27/yr by 2055 (HVAC capex compounding) — expect insurance premiums to compound above CPI over the hold.
Questions for the listing agent
- Is there a deadline driving the sale (1031 exchange, divorce, estate, relocation)? That informs how much negotiation room exists.
- Schools are A-rated — typically a magnet for longer-tenancy family renters. What's the average tenant stay here, and is there a school-zone premium baked into asking?
- What's the average days-on-market for RENTAL listings here right now (not sales)? A rising rental-DOM trend means longer vacancies and softer asking-rent achievability than the comps imply.
- What's the recent tenant-quality profile in this submarket — average credit score on applications, eviction rate, late-payment / NSF rate, and stable-employment percentage? A property-management company in the area should have these aggregated.
- How much new for-sale + rental construction is in the pipeline within 1–3 miles? Heavy new supply typically softens prices + rents 12–24 months out; constrained supply supports both.
Investment metrics
- 1% rule
- 2.89% ✓
- Cap rate
- 25.38%
- Cash-on-cash
- 68.16%
- DSCR
- 4.03
- GRM
- 2.9
CMA / ARV
- ARV (on-the-fly)
- $739,648
- Comps found
- 2
Show comp detail 2 sales within ~0.75 mi
| Address | Dist | Beds/Ba | Sqft | Sold | Price | $/sf | Match |
|---|---|---|---|---|---|---|---|
| 11640 SW 3rd St | 0.74mi | 3/2.0 | 1,444 (-1%) | 23mo | $665,000 | $461 | 45 |
| 1621 SW 117th Ave | 0.59mi | 3/2.0 | 1,672 (+15%) | 4mo | $850,000 | $508 | 44 |
Match score weights: distance 35% · size 25% · config 20% · recency 20%. Top-matched comps best support the ARV.
Projected returns pro-forma
-3.0% appreciation · 0.0% rent growth · sell at horizon
- IRR
- 64.1%
- Equity multiple
- 3.74×
- Total profit
- $91,244
- Equity at exit
- $17,743
- IRR
- 67.6%
- Equity multiple
- 6.88×
- Total profit
- $195,964
- Equity at exit
- $10,289
Cash invested: $33,320 (down + closing). Projections, not guarantees.
Landlord ↔ Tenant lean methodology
- Overall (STATE)
- 87 Strongly Landlord-Friendly
- State Florida
- 87 Strongly Landlord-Friendly · R+3
- County
- — inherits STATE
- City
- — inherits STATE
ZIP-level market 33325
- Rents YoY
- -0.9%
- Active inventory
- 179
- Price-to-rent
- 2.9×
Monthly cashflow live
- Estimated rent
- $3,437 high interval (Pro) →
- Mortgage (P&I)
- −$624
- Tax est. 1.5%
- −$149 /mo · $1,785/yr
- Insurance
- −$50
- HOA
- −$0
- Vacancy / Maint / Mgmt
- −$722
- Net cashflow
- $1,893
Break-even live
Sensitivity live
| Price | -10% $1,975 | -5% $1,934 | +0% $1,893 | +5% $1,852 | +10% $1,810 |
|---|---|---|---|---|---|
| Rent | -10% $1,621 | -5% $1,757 | +0% $1,893 | +5% $2,028 | +10% $2,164 |
| Rate | -1.0pp $1,953 | -0.5pp $1,923 | base $1,893 | +0.5pp $1,862 | +1.0pp $1,830 |
UW: 25.0% down · 7.5% · 30yr · 1.5% tax · 5.0% vac · 8.0% maint · 8.0% mgmt
Financing live
Cash to close
- Down payment
- $29,750
- Closing costs
- $3,570
- Reserves months
- —
- Total cash needed
- —
Loan-product check · same deal, 3 products live
Conventional
25% down · 7.5% · 30yr
- Down + closing
- —
- Monthly P&I
- —
- Monthly cashflow
- —
- DSCR
- —
- Eligible?
- —
Personal DTI + credit; lowest rate.
DSCR
20% down · 8.5% · 30yr
- Down + closing
- —
- Monthly P&I
- —
- Monthly cashflow
- —
- DSCR
- —
- Eligible?
- —
No personal income docs; deal must DSCR.
Hard money
10% down · 12.0% · 12mo
- Down + closing
- —
- Monthly P&I
- —
- Monthly cashflow
- —
- DSCR
- —
- Eligible?
- —
Short-term bridge; refi at stabilization.
Rent comps 21 comps
| Address | Beds | Baths | Sqft | Rent | $/sqft | DOM | Units | Dist |
|---|---|---|---|---|---|---|---|---|
| 11160 SW 11th Pl Davie, FL | 2.0 | 2.0 | 1278 | $3,300 | $2.58 | 9d | 1 | 0.22mi |
| 1210 SW 118th Ter #1210 Davie, FL | 3.0 | 2.5 | 1654 | $3,200 | $1.93 | 17d | 1 | 0.43mi |
| 1210 SW 118th Ter Davie, FL | 3.0 | 2.5 | 1654 | $3,200 | $1.93 | 19d | 1 | 0.43mi |
| 11000 Cameron Ct Davie, FL | 1.0–3.0 | 1.0–2.0 | 1024 | $2,893 | $2.82 | 1d | 25 | 0.48mi |
| 1415 SW 110th Way #1415 Davie, FL | 3.0 | 2.5 | 1648 | $3,250 | $1.97 | 9d | 1 | 0.49mi |
| 10791 SW 10th Pl Davie, FL | 3.0 | 2.0 | 1472 | $4,850 | $3.29 | 12d | 1 | 0.57mi |
| 10791 SW 10th Pl Davie, FL | 3.0 | 2.0 | 1472 | $4,850 | $3.29 | 16d | 1 | 0.57mi |
| 821 E Village Cir #821 Davie, FL | 3.0 | 2.5 | 1835 | $3,750 | $2.04 | 23d | 1 | 0.81mi |
| 821 E Village Cir #821 Davie, FL | 3.0 | 2.5 | 1835 | $3,650 | $1.99 | 6d | 1 | 0.81mi |
| 11749 Terra Bella Blvd Plantation, FL | 2.0 | 2.0 | 930 | $2,650 | $2.85 | 9d | 1 | 1.02mi |
| 10939 W Broward Blvd #10939 Plantation, FL | 3.0 | 3.0 | 1809 | $3,000 | $1.66 | 13d | 1 | 1.10mi |
| 1021 Mockingbird Ln #114 Plantation, FL | 2.0 | 2.0 | 1210 | $2,300 | $1.90 | 26d | 1 | 1.18mi |
| 10401 W Broward Blvd #301 Plantation, FL | 3.0 | 2.0 | 1100 | $2,650 | $2.41 | 26d | 1 | 1.20mi |
| 10451 W Broward Blvd #306 Plantation, FL | 2.0 | 2.0 | 1000 | $2,200 | $2.20 | 4d | 1 | 1.25mi |
| 958 Mockingbird Ln #515 Plantation, FL | 3.0 | 2.0 | 1597 | $3,595 | $2.25 | 21d | 1 | 1.31mi |
| 9721 SW 15th Dr Plantation, FL | 3.0 | 2.0 | 1664 | $4,200 | $2.52 | 26d | 1 | 1.39mi |
| 165 Emerald Creek Ter #165 Davie, FL | 3.0 | 2.5 | 1742 | $3,350 | $1.92 | 1d | 1 | 1.45mi |
| 12447 Emerald Creek Mnr Davie, FL | 3.0 | 2.5 | 1872 | $3,100 | $1.66 | 26d | 1 | 1.45mi |
| 1631 SW 129th Way Davie, FL | 3.0 | 2.0 | 1189 | $3,700 | $3.11 | 7d | 1 | 1.46mi |
| 141 SW 127th Ter Unit 141 Plantation, FL | 3.0 | 2.5 | 1720 | $3,600 | $2.09 | 26d | 1 | 1.47mi |
| 12471 NW 3rd St Unit D1 Plantation, FL | 3.0 | 2.0 | 1681 | $3,500 | $2.08 | 26d | 1 | 1.50mi |
Listing history 4 events
-
2026-06-21days on market $119,000 Active 5 DOM
-
2026-06-18days on market $119,000 Active 2 DOM
-
2026-06-17remarks 679-char remark
-
2026-06-17$119,000 Active 1 DOM
ⓘ Source: listings_history table (triggers on properties + properties_extension) + one-shot
backfill from property_details.listing_events for pre-trigger history.
Climate risk First Street
- Flood 1/10 Low FEMA zone X (shaded) · 0% chance over 30 yrs
- Wildfire 1/10 Low
- Heat 10/10 Extreme 7 d/yr ≥105°F today · 27 d/yr by 30 yrs out
- Wind 10/10 Extreme 99% chance of damaging wind over 30 yrs
- Air quality 3/10 Moderate 2 unhealthy d/yr today · 3 by 30 yrs out
Nearby sold comps map
Loading sold comps map…
Walkable amenities ~0.75 mi
Loading nearby amenities…
Taxation est. · year 1
- Rental income
- $41,242
- − Mortgage interest
- −$6,666
- − Property taxes
- −$1,785
- − Insurance
- −$595
- − Repairs & maintenance
- −$3,299
- − Management
- −$3,299
- − Depreciation
- −$3,462
- Taxable income
- $22,135
- Est. tax owed @ 24.0%
- −$5,313
- After-tax cash flow
- $17,400/yr
For passive investors: Depreciation is non-cash, so a rental often shows a tax loss while cash-flowing — sheltering income. Rental losses are passive: they offset passive income freely, and up to $25,000/yr can offset ordinary (W-2) income if you actively participate and your MAGI is under $100k (phasing out to $0 by $150k); unused losses carry forward. On sale, claimed depreciation is recaptured at up to 25%, and gains may owe capital-gains tax (a 1031 exchange can defer both). Figures are a year-1 estimate at your 24.0% rate — not tax advice; consult a CPA.
Schools (NCES district)
- District
- Broward
- NCES district ID
- 1200180
- Math proficiency
- 42% ▼ -18.00%
- Reading proficiency
- 53% ▼ -5.00%
- Median HH income
- $52,139
- Composite
- 40.88/100
- National rank
- #3621
- State rank
- #46 of 73 in FL
Livability — Davie
- Score
- 82/100
- State rank
- #68
- US rank
- #1159
Category grades
Schools grade is shown separately in the Schools card above.
Census & demographics
- Census place
- Davie, FL
- County
- Broward County · 1,963,430 people
- City population
- 92,317
- Metro
- Miami-Fort Lauderdale-Pompano Beach, FL
- Population (ZIP)
- 32,399
- Household income
- $100,553
- Rent vs Own
- Severe rent burden
- 924.0
Population outlook (Broward County) Hauer SSP2
- Today (2025)
- 2,207,033 people
- By 2030
- 2,360,704 · +7.0%
- By 2040
- 2,661,208 · +20.6%
- By 2050
- 2,946,698 · +33.5%
- By 2075
- 3,602,273 · +63.2%
- By 2100
- 3,970,984 · +79.9%
Race, ethnicity, and origin ACS 2023
- Neighborhood character
- Diverse neighborhood (Simpson 0.62)
- Race & ethnicity
- Hispanic / Latino 51% White 33% Two or more races 31% Black 6% Asian 3%
- Hispanic origin (detail)
- Mexican 3% Puerto Rican 8% Cuban 9% Dominican 1% Salvadoran 1%
- Common ancestry
- Italian 3% Romanian 1% Scotch-Irish 1%
- Foreign-born
- 35% · Canada, Jamaica, Dominican Republic
- Languages at home
- 49% English-only · Spanish 46% Other Indo-European 2% French/Haitian/Cajun 2%
Political lean MEDSL · Broward
- 2024 margin
- D (+17.0) · D 58.0% · R 41.0%
- 2008→2024 swing
- -17.8pp toward R · 2008: 34.7pp · 2024: 17.0pp
- All cycles
- 2024: D+17.0 2020: D+29.8 2016: D+35.0 2012: D+34.9 2008: D+34.7
Not yet ingested
- Civics
- —
Market trends
- HPI YoY
- ▼ -437.64%
- Current HPI
- 385.1467
- Rent YoY
- ▼ -0.88%
- Metro
- Miami-Fort Lauderdale-Pompano Beach, FL
- State GDP YoY
- ▲ 3.28%
- F500 in state
- 36
Industry mix (Fortune 500 HQ in FL)
| Industry | F500 HQs | Revenue |
|---|---|---|
| Industrial Technology | 2 | $29B |
|
||
| Insurance | 2 | $17B |
|
||
| Retail | 1 | $60B |
|
||
| Technology Distribution | 1 | $58B |
|
||
| Homebuilding | 1 | $35B |
|
||
| Technology Manufacturing | 1 | $35B |
|
||
Price history
1 event — show timeline
- 2026-06-17 Listed $119,000 FSBO.com
Cash-flow waterfall
monthlySold comps — $/sqft
last 12 mo · ≤1 miLoading sold comps…