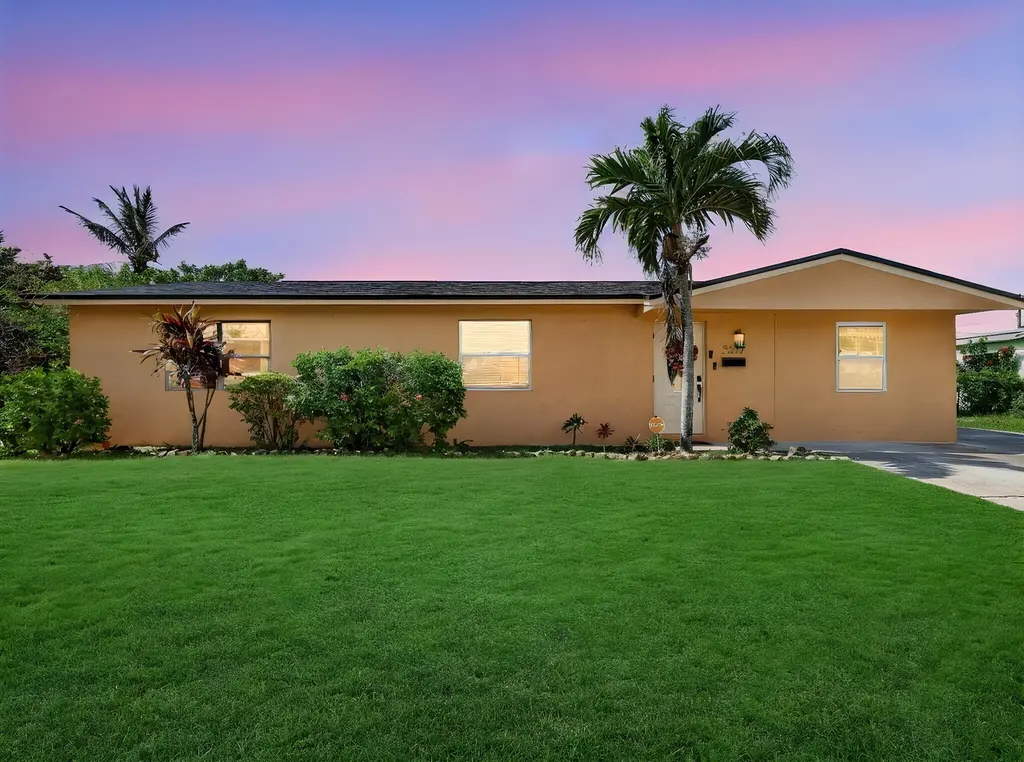
361 W 21st St · Riviera Beach, FL
Flood risk 1/10 · Minimal
- FEMA flood zone
- X (unshaded)
- Chance of flooding over 30 yrs
- 0.0%
- Est. flood insurance / yr
- $507 – $1,088
Fire risk 1/10 · Minimal
- Est. fire insurance / yr
- $947 – $1,759
Heat risk 10/10 · Severe
- Hot days now (above 106°F)
- 7 days/yr
- Hot days in 30 yrs
- 25 days/yr
Wind risk 10/10 · Severe
- Chance of severe wind over 30 yrs
- 99.0%
Air-quality risk 2/10 · Minimal
- Unhealthy air days now
- 0 days/yr
- Unhealthy air days in 30 yrs
- 1 days/yr
Risk factors via First Street. Map © Google.
Why this score? — see what drove the C+ grade
The composite is a weighted blend of 9 inputs, each scored 0–100. Each bar is that input's sub-score; the figure is the points it added to the 100-point composite (weight × sub-score).
- Cash flow +25.9/30.0
- DSCR +8.7/10.0
- ARV discount +7.5/15.0
- 1% rule +6.4/10.0
- Schools +4.3/10.0
- Livability +3.4/5.0
- Condition / age +2.5/5.0
- Rent growth +2.3/5.0
- Appreciation +0.0/10.0
$334,999
🖨 Deal sheet (PDF) 📄 Offer letter ✓ Due diligence
Listing remarks
Move-in ready Riviera Beach home with NO HOA! This well-maintained 2BR/1BA property features an open-concept layout with spacious living areas and a permitted garage conversion ideal for a den, office, or possible 3rd bedroom (window, no closet). Recent updates include newer roof, fresh exterior paint, and newer kitchen appliances. Enjoy the fully fenced backyard complete with a newer 1,700-gallon above-ground pool, shed, and sprinkler system. Additional features include smart locks, security system with cameras, and video doorbell for added convenience. Conveniently located near beaches, parks, shopping, dining, schools, and major highways. Great opportunity! Primary picture AI enhance wit
Key facts
- Smart locks
- Security system
- Above-ground pool
Tags
Property features AI
Finance
- Other: Living area reported as 1,025 (public records listing shows building area 1,376); Property taxes listed (financial details omitted per instructions)
Exterior
- Parking: Driveway parking
- Utilities: Public water; Public sewer; No additional utilities listed
- Home design: Single-family residence; One story; Faces west; Resale property
- Construction: Concrete block construction with stucco; Shingle roof; Built as of public records (building area 1,376)
- Exterior features: Private above-ground pool; Full lot fencing; Storage shed(s)
Interior
- Kitchen: Dishwasher; Electric range; Microwave; Refrigerator; Owned water heater
- Bedrooms: Two bedrooms on the main level
- Flooring: Carpet; Tile; Wood
- Bathrooms: One full bathroom on the main level
- Heating & cooling: Central heating; Central air conditioning; Ceiling fans
- Interior features: No special interior features listed
- Laundry & utility: Indoor laundry room
Neighborhood map
What this means for you Summary
Snapshot
- This is a 2-bed/1.0-bath single-family listed at $335k.
Deal economics
- At list price, monthly cash flow is $828 ($10k/yr) — positive.
- The deal already cash-flows at list — no discount required.
- Meets the 1% rule at list price ($4k rent vs $335k).
Location & tenants
- Location reads 67/100 on livability (#581 in FL) — a middle-class / working-renter tenant base. Strengths: housing A+, health & safety A+, cost of living A-; Watch: employment D, crime F, amenities F.
- Palm Beach (suburban): math 46% / reading 53% proficiency, ranked #34 of 73 in FL (top 47%) — families likely to look elsewhere, expect single-tenant / working-renter base with shorter leases.
- Market conditions: Rents soft (-0.7%/yr); 506 active listings in the ZIP; 20 comparable units currently listed for rent nearby; rentals at typical pace (median 26d on market — plan ~3-4 weeks tenant-placement turnaround); 3,974 units permitted in Palm Beach County in 2024 (1,012 in 5+ unit buildings).
- At $3,816/mo this rent would consume 70% of the median local household income ($65k/yr) (locally 1838% of renters already pay >50% of income on rent) — very limited rent-growth headroom before tenants either downsize or default.
Forward outlook
- Local home prices are declining (-3.0%/yr); year-one equity from $2k of loan paydown is wiped out by about $10k of value loss. Plan a longer hold.
- Palm Beach County population projected at +30% by 2050 — long-run rental-demand tailwind backs the buy-and-hold thesis.
Negotiation context
- Only 7 days on market — expect competitive offers; lowballing is unlikely to land.
- Current owner paid $267k; 25% above their basis — modest negotiation headroom, anchor on the comps not their cost.
Risks & watch-outs
- Climate carrying-cost: severe wind risk, 99% chance of damaging wind over 30y; extreme-heat days projected 7→25/yr by 2055 (HVAC capex compounding) — expect insurance premiums to compound above CPI over the hold.
Questions for the listing agent
- Built in 1973 — when were the roof, HVAC, electrical panel, plumbing, and water heater last replaced?
- Is there a deadline driving the sale (1031 exchange, divorce, estate, relocation)? That informs how much negotiation room exists.
- Crime grade is F in this area — have there been break-ins, vandalism, or insurance claims at this property in the last 3 years? What carrier currently insures it and at what premium?
- What's the average days-on-market for RENTAL listings here right now (not sales)? A rising rental-DOM trend means longer vacancies and softer asking-rent achievability than the comps imply.
- What's the recent tenant-quality profile in this submarket — average credit score on applications, eviction rate, late-payment / NSF rate, and stable-employment percentage? A property-management company in the area should have these aggregated.
- How much new for-sale + rental construction is in the pipeline within 1–3 miles? Heavy new supply typically softens prices + rents 12–24 months out; constrained supply supports both.
Investment metrics
- 1% rule
- 1.14% ✓
- Cap rate
- 9.26%
- Cash-on-cash
- 10.60%
- DSCR
- 1.47
- GRM
- 7.3
CMA / ARV
No comps found within radius.
Projected returns pro-forma
-3.0% appreciation · 0.0% rent growth · sell at horizon
- IRR
- -3.7%
- Equity multiple
- 0.86×
- Total profit
- $-12,727
- Equity at exit
- $49,949
- IRR
- 2.3%
- Equity multiple
- 1.14×
- Total profit
- $13,553
- Equity at exit
- $28,965
Cash invested: $93,800 (down + closing). Projections, not guarantees.
Landlord ↔ Tenant lean methodology
- Overall (STATE)
- 87 Strongly Landlord-Friendly
- State Florida
- 87 Strongly Landlord-Friendly · R+3
- County
- — inherits STATE
- City
- — inherits STATE
ZIP-level market 33404
- Home prices YoY
- -31.1%
- Rents YoY
- -0.7%
- Active inventory
- 506
- Price-to-rent
- 7.3×
Monthly cashflow live
- Estimated rent
- $3,816 high interval (Pro) →
- Mortgage (P&I)
- −$1,757
- Tax from tax record
- −$290 /mo · $3,475/yr
- Insurance
- −$140
- HOA
- −$0
- Vacancy / Maint / Mgmt
- −$801
- Net cashflow
- $828
Break-even live
Sensitivity live
| Price | -10% $1,018 | -5% $923 | +0% $828 | +5% $734 | +10% $639 |
|---|---|---|---|---|---|
| Rent | -10% $527 | -5% $678 | +0% $828 | +5% $979 | +10% $1,130 |
| Rate | -1.0pp $997 | -0.5pp $914 | base $828 | +0.5pp $742 | +1.0pp $653 |
UW: 25.0% down · 7.5% · 30yr · 1.5% tax · 5.0% vac · 8.0% maint · 8.0% mgmt
Financing live
Cash to close
- Down payment
- $83,750
- Closing costs
- $10,050
- Reserves months
- —
- Total cash needed
- —
Loan-product check · same deal, 3 products live
Conventional
25% down · 7.5% · 30yr
- Down + closing
- —
- Monthly P&I
- —
- Monthly cashflow
- —
- DSCR
- —
- Eligible?
- —
Personal DTI + credit; lowest rate.
DSCR
20% down · 8.5% · 30yr
- Down + closing
- —
- Monthly P&I
- —
- Monthly cashflow
- —
- DSCR
- —
- Eligible?
- —
No personal income docs; deal must DSCR.
Hard money
10% down · 12.0% · 12mo
- Down + closing
- —
- Monthly P&I
- —
- Monthly cashflow
- —
- DSCR
- —
- Eligible?
- —
Short-term bridge; refi at stabilization.
Rent comps 20 comps
| Address | Beds | Baths | Sqft | Rent | $/sqft | DOM | Units | Dist |
|---|---|---|---|---|---|---|---|---|
| 520 W 28th St Riviera Beach, FL | 3.0 | 1.0 | 1296 | $6,000 | $4.63 | 4d | 1 | 0.44mi |
| 158 E 23rd St Riviera Beach, FL | 2.0 | 2.0 | 1110 | $2,900 | $2.61 | 25d | 1 | 0.62mi |
| 158 E 23rd St Riviera Beach, FL | 2.0 | 2.0 | 1110 | $2,900 | $2.61 | 23d | 1 | 0.62mi |
| 410 Wilma Cir #103 Riviera Beach, FL | 2.0 | 2.0 | 1056 | $4,000 | $3.79 | 16d | 1 | 0.87mi |
| 400 Wilma Cir #309 Riviera Beach, FL | 1.0 | 1.0 | 818 | $4,000 | $4.89 | 6d | 1 | 0.91mi |
| 901 W 37th St Riviera Beach, FL | 3.0 | 1.0 | 900 | $2,895 | $3.22 | 25d | 1 | 0.93mi |
| 522 W 2nd St Riviera Beach, FL | 3.0 | 1.0 | 900 | $2,895 | $3.22 | 25d | 1 | 0.96mi |
| 1401 W 9th St Riviera Beach, FL | 3.0 | 2.0 | 1304 | $3,200 | $2.45 | 25d | 1 | 0.98mi |
| 220 Lake Shore Dr Lake Park, FL | 1.0–3.0 | 1.5–3.5 | 2134 | $14,498 | $6.79 | 0d | 19 | 1.17mi |
| 301 Lake Shore Dr #802 West Palm Beach, FL | 2.0 | 2.0 | 1316 | $3,000 | $2.28 | 25d | 1 | 1.28mi |
| 855 Date Palm Dr West Palm Beach, FL | 3.0 | 3.0 | 1216 | $3,150 | $2.59 | 25d | 1 | 1.30mi |
| 510 56th St West Palm Beach, FL | 2.0 | 1.0 | 1152 | $3,800 | $3.30 | 23d | 1 | 1.34mi |
| 517 55th St West Palm Beach, FL | 2.0 | 2.0 | 1238 | $4,550 | $3.68 | 25d | 1 | 1.35mi |
| 1025 Sugar Sands Blvd #159 Riviera Beach, FL | 1.0 | 1.0 | 987 | $4,200 | $4.26 | 25d | 1 | 1.39mi |
| 220 Lake Dr #206 Palm Beach Shores, FL | 2.0 | 2.0 | 1241 | $4,000 | $3.22 | 14d | 1 | 1.40mi |
| 1030 Sugar Sands Blvd #171 Riviera Beach, FL | 2.0 | 2.0 | 1143 | $5,000 | $4.37 | 25d | 1 | 1.41mi |
| 5600 N Flagler Dr West Palm Beach, FL | 1.0–3.0 | 2.0 | 1192 | $4,600 | $3.86 | 0d | 7 | 1.44mi |
| 5600 N Flagler Dr West Palm Beach, FL | 1.0–3.0 | 2.0 | 1192 | $4,500 | $3.77 | 22d | 8 | 1.44mi |
| 1050 Sugar Sands Blvd #174 Riviera Beach, FL | 3.0 | 2.0 | 1490 | $5,400 | $3.62 | 0d | 1 | 1.45mi |
| 301 Hawthorne Dr West Palm Beach, FL | 3.0 | 2.0 | 1402 | $3,200 | $2.28 | 25d | 1 | 1.49mi |
Listing history 5 events
-
2026-05-21status Pending
-
2026-05-13$334,999 Active
-
2022-07-28soldstatus $267,000
-
1980-01-01soldstatus $27,000
-
1973-01-01soldstatus $26,900
ⓘ Source: listings_history table (triggers on properties + properties_extension) + one-shot
backfill from property_details.listing_events for pre-trigger history.
Tax reassessment forecast FL · Resets to sale price
- Current annual tax
- $3,475 · $290/mo
- Projected year-2 tax
- $3,475 · $290/mo
- Expected delta
- $0/yr ($0/mo · 0.0%)
ⓘ Screening estimate from a state-policy table — verify with the county assessor before closing.
Climate risk First Street
- Flood 1/10 Low FEMA zone X (unshaded) · 0% chance over 30 yrs
- Wildfire 1/10 Low
- Heat 10/10 Extreme 7 d/yr ≥106°F today · 25 d/yr by 30 yrs out
- Wind 10/10 Extreme 99% chance of damaging wind over 30 yrs
- Air quality 2/10 Low 0 unhealthy d/yr today · 1 by 30 yrs out
Nearby sold comps map
Loading sold comps map…
Walkable amenities ~0.75 mi
Loading nearby amenities…
Taxation est. · year 1
- Rental income
- $45,788
- − Mortgage interest
- −$18,765
- − Property taxes
- −$3,475
- − Insurance
- −$1,675
- − Repairs & maintenance
- −$3,663
- − Management
- −$3,663
- − Depreciation
- −$9,745
- Taxable income
- $4,801
- Est. tax owed @ 24.0%
- −$1,152
- After-tax cash flow
- $8,789/yr
For passive investors: Depreciation is non-cash, so a rental often shows a tax loss while cash-flowing — sheltering income. Rental losses are passive: they offset passive income freely, and up to $25,000/yr can offset ordinary (W-2) income if you actively participate and your MAGI is under $100k (phasing out to $0 by $150k); unused losses carry forward. On sale, claimed depreciation is recaptured at up to 25%, and gains may owe capital-gains tax (a 1031 exchange can defer both). Figures are a year-1 estimate at your 24.0% rate — not tax advice; consult a CPA.
Schools (NCES district)
- District
- Palm Beach
- NCES district ID
- 1201500
- Math proficiency
- 46% ▼ -16.00%
- Reading proficiency
- 53% ▼ -4.00%
- Median HH income
- $53,943
- Composite
- 42.72/100
- National rank
- #3160
- State rank
- #34 of 73 in FL
Livability — Riviera Beach
- Score
- 67/100
- State rank
- #581
- US rank
- #11060
Category grades
Schools grade is shown separately in the Schools card above.
Census & demographics
- Census place
- Riviera Beach, FL
- County
- Palm Beach County · 1,438,312 people
- City population
- 30,912
- Metro
- Miami-Fort Lauderdale-Pompano Beach, FL
- Population (ZIP)
- 30,912
- Household income
- $65,063
- Rent vs Own
- Severe rent burden
- 1838.0
Population outlook (Palm Beach County) Hauer SSP2
- Today (2025)
- 1,637,487 people
- By 2030
- 1,743,255 · +6.5%
- By 2040
- 1,948,712 · +19.0%
- By 2050
- 2,132,979 · +30.3%
- By 2075
- 2,530,027 · +54.5%
- By 2100
- 2,706,979 · +65.3%
Race, ethnicity, and origin ACS 2023
- Neighborhood character
- Majority Black (64%)
- Race & ethnicity
- Black 64% White 22% Hispanic / Latino 9% Two or more races 8%
- Hispanic origin (detail)
- Mexican 1% Puerto Rican 1%
- Common ancestry
- Hispanic 8% Romanian 1% Italian 1%
- Foreign-born
- 21% · Canada, Jamaica
- Languages at home
- 82% English-only · Spanish 8% French/Haitian/Cajun 7% Other Indo-European 1%
Political lean MEDSL · Palm Beach
- 2024 margin
- Toss-up / Even · D 50.0% · R 49.2%
- 2008→2024 swing
- -22.1pp toward R · 2008: 22.9pp · 2024: 0.8pp
- All cycles
- 2024: D+0.8 2020: D+12.8 2016: D+15.3 2012: D+17.0 2008: D+22.9
Not yet ingested
- Civics
- —
Market trends
- HPI YoY
- ▼ -153.74%
- Current HPI
- 341.1761
- Rent YoY
- ▼ -0.72%
- Metro
- Miami-Fort Lauderdale-Pompano Beach, FL
- State GDP YoY
- ▲ 3.28%
- F500 in state
- 36
Industry mix (Fortune 500 HQ in FL)
| Industry | F500 HQs | Revenue |
|---|---|---|
| Industrial Technology | 2 | $29B |
|
||
| Insurance | 2 | $17B |
|
||
| Retail | 1 | $60B |
|
||
| Technology Distribution | 1 | $58B |
|
||
| Homebuilding | 1 | $35B |
|
||
| Technology Manufacturing | 1 | $35B |
|
||
Price history
+1145.3% since first listed5 events — show timeline
- 2026-05-21 Pending — Beaches MLS
- 2026-05-13 Listed $334,999 Beaches MLS
- 2022-07-28 Sold (Public Records) $267,000 Public Records
- 1980-01-01 Sold (Public Records) $27,000 Public Records
- 1973-01-01 Sold (Public Records) $26,900 Public Records
Property tax history
+14.8%/yrLatest (2025): $3,475 · +3.5% YoY. Source: county tax records.
Cash-flow waterfall
monthlySold comps — $/sqft
last 12 mo · ≤1 miLoading sold comps…