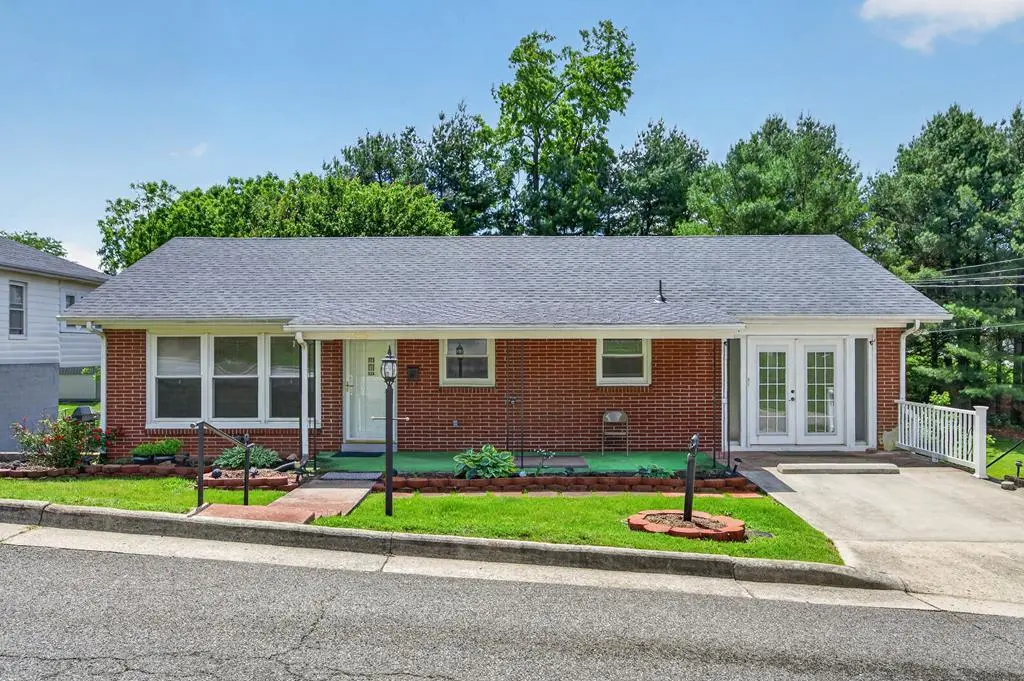
1055 W North St · Wytheville, VA
Flood risk No data
- FEMA flood zone
- —
- Chance of flooding over 30 yrs
- —
- Est. flood insurance / yr
- —
Fire risk No data
- Est. fire insurance / yr
- —
Heat risk No data
- Hot days now (above threshold)
- —
- Hot days in 30 yrs
- —
Wind risk No data
- Chance of severe wind over 30 yrs
- —
Air-quality risk No data
- Unhealthy air days now
- —
- Unhealthy air days in 30 yrs
- —
Risk factors via First Street. Map © Google.
Why this score? — see what drove the F grade
The composite is a weighted blend of 9 inputs, each scored 0–100. Each bar is that input's sub-score; the figure is the points it added to the 100-point composite (weight × sub-score).
- Schools +6.0/10.0
- Cash flow +5.5/30.0
- Livability +3.8/5.0
- Rent growth +2.5/5.0
- Condition / age +2.5/5.0
- 1% rule +0.0/10.0
- DSCR +0.0/10.0
- ARV discount +0.0/15.0
- Appreciation +0.0/10.0
$260,000
🖨 Deal sheet (PDF) 📄 Offer letter ✓ Due diligence
Listing remarks
Brick ranch on a rare half-acre corner lot just minutes from downtown Wytheville! Conveniently located within walking distance of Main Street and the newly renovated Scott Memorial Middle School/George Wythe High School. Main level offers 3 bedrooms and easy one-level living, while the basement features a potential 4th bedroom, second full bath, and additional space ideal for separate living quarters, guests, or multi-generational living. Large yard, great location, and endless possibilities! Beautiful kitchen cabinets with lots of storage, Roof less than 5 years old.
Key facts
- Half-acre corner lot
- Lots of storage
- Large yard
Tags
Property features AI
Exterior
- Utilities: Public water; Public sewer; Natural gas available
- Home design: Single-family residence; One story
- Construction: Brick construction; Finished below-grade area
- Exterior features: Shingle roof; Shed(s); Cleared, level corner lot
Interior
- Kitchen: Dishwasher; Electric range; Refrigerator
- Flooring: Carpet; Vinyl
- Bathrooms: 2 full bathrooms
- Heating & cooling: Baseboard heating
- Interior features: Insulated windows; Wood-burning fireplace; Basement
Neighborhood map
What this means for you Summary
Snapshot
- This is a 2-bed/1.5-bath single-family listed at $260k.
Deal economics
- At list price, monthly cash flow is $-558 ($-7k/yr) — negative.
- To cash-flow at today's rent, offer at most $161k (37.9% below list).
- To meet the 1% rule (rent ≥ 1% of price), the offer needs to be $125k (51.9% below list).
- Recommended offer: $125k (51.9% below list) — sets the bar for 1% rule.
Location & tenants
- Location reads 76/100 on livability (#116 in VA, #3,571 nationally) — a middle-class / working-renter tenant base. Strengths: cost of living A+, health & safety A+, crime B+; Watch: employment D, amenities F, commute F.
- Wythe County Public School District (rural): math 67% / reading 77% proficiency, ranked #20 of 131 in VA (top 15%) — strong family-tenant draw, lease renewals of 3-5y typical.
- Zoned schools: Spiller Elementary (math 62% / reading 73%, grade B+, #372 of 1,108 statewide, top 34%, 624 students, 73% FRL); Scott Memorial Middle (math 73% / reading 79%, grade A, #42 of 342 statewide, top 13%, 318 students, 73% FRL); George Wythe High (math 72% / reading 82%, grade A-, #90 of 319 statewide, top 30%, 462 students, 73% FRL) — zoned schools average 73% FRL vs 41% district-wide (32 pts higher); higher-poverty schools than district average — tighter screening recommended.
- Market conditions: 156 active listings in the ZIP; 1 comparable units currently listed for rent nearby; 63 units permitted in Wythe County in 2024 (12 in 5+ unit buildings).
Forward outlook
- Local home prices are declining (-3.0%/yr); year-one equity from $2k of loan paydown is wiped out by about $8k of value loss. Plan a longer hold.
- Wythe County population projected to shrink 7% by 2050 — rents likely to lag national; underwrite the cash flow, not the appreciation.
Negotiation context
- It's been on market 19 days — a 2% lower offer ($256k) is reasonable based on typical stale-listing flexibility.
- Current owner paid $114k; list at $260k implies a 128% gain — meaningful room to come down on a strong offer.
Questions for the listing agent
- What do current leases actually rent for vs. the listed asking? Can we see a recent rent roll and the last 12 months of T-12 income?
- Built in 1970 — when were the roof, HVAC, electrical panel, plumbing, and water heater last replaced?
- Is there a deadline driving the sale (1031 exchange, divorce, estate, relocation)? That informs how much negotiation room exists.
- Schools are A-rated — typically a magnet for longer-tenancy family renters. What's the average tenant stay here, and is there a school-zone premium baked into asking?
- The area grade is low — what's the realistic commute time and amenity access for the typical tenant pool here? Any planned neighborhood developments (good or bad) we should know about?
- What's the average days-on-market for RENTAL listings here right now (not sales)? A rising rental-DOM trend means longer vacancies and softer asking-rent achievability than the comps imply.
- What's the recent tenant-quality profile in this submarket — average credit score on applications, eviction rate, late-payment / NSF rate, and stable-employment percentage? A property-management company in the area should have these aggregated.
- How much new for-sale + rental construction is in the pipeline within 1–3 miles? Heavy new supply typically softens prices + rents 12–24 months out; constrained supply supports both.
Investment metrics
- 1% rule
- 0.48% ✗
- Cap rate
- 3.72%
- Cash-on-cash
- -9.20%
- DSCR
- 0.59
- GRM
- 17.3
CMA / ARV
- ARV (on-the-fly)
- $196,224
- Comps found
- 11
Show comp detail 11 sales within ~0.75 mi
| Address | Dist | Beds/Ba | Sqft | Sold | Price | $/sf | Match |
|---|---|---|---|---|---|---|---|
| 365 N 14th St | 0.19mi | 3/1.5 (+1) | 1,430 (+6%) | 6mo | $237,000 | $166 | 71 |
| 210 Spring Meadow Dr | 0.32mi | 3/2.0 (+1) | 1,405 (+4%) | 7mo | $300,000 | $214 | 65 |
| 220 Spring Meadow Dr | 0.30mi | 3/2.0 (+1) | 1,370 (+2%) | 16mo | $306,000 | $223 | 62 |
| 220 Spring Meadow Dr | 0.32mi | 3/2.0 (+1) | 1,370 (+2%) | 16mo | $306,000 | $223 | 62 |
| 990 W Jefferson St | 0.50mi | 3/1.0 (+1) | 1,306 (-3%) | 5mo | $134,000 | $103 | 60 |
| 1310 W Spiller St | 0.21mi | 3/2.0 (+1) | 1,538 (+14%) | 5mo | $85,000 | $55 | 55 |
| 835 W Madison St | 0.67mi | 2/1.0 | 1,184 (-12%) | 4mo | $42,000 | $35 | 44 |
| 805 W Madison St | 0.68mi | 2/1.0 | 1,182 (-12%) | 6mo | $60,000 | $51 | 41 |
| 650 S 8th St | 0.71mi | 3/1.0 (+1) | 1,372 (+2%) | 20mo | $140,500 | $102 | 40 |
| 490 W Jefferson St | 0.66mi | 3/1.0 (+1) | 1,528 (+14%) | 4mo | $223,500 | $146 | 36 |
| 660 W Union St | 0.51mi | 3/1.0 (+1) | 1,188 (-12%) | 23mo | $178,000 | $150 | 30 |
Match score weights: distance 35% · size 25% · config 20% · recency 20%. Top-matched comps best support the ARV.
Projected returns pro-forma
-3.0% appreciation · 3.0% rent growth · sell at horizon
- IRR
- -32.8%
- Equity multiple
- -0.07×
- Total profit
- $-77,819
- Equity at exit
- $38,767
- IRR
- -39.5%
- Equity multiple
- -0.57×
- Total profit
- $-114,094
- Equity at exit
- $22,480
Cash invested: $72,800 (down + closing). Projections, not guarantees.
Landlord ↔ Tenant lean methodology
- Overall (STATE)
- 55 Moderately Landlord-Leaning
- State Virginia
- 55 Moderately Landlord-Leaning · D+2
- County
- — inherits STATE
- City
- — inherits STATE
ZIP-level market 24382
- Home prices YoY
- -25.7%
- Active inventory
- 156
- Price-to-rent
- 17.3×
Monthly cashflow live
- Estimated rent
- $1,250 medium interval (Pro) →
- Mortgage (P&I)
- −$1,363
- Tax from tax record
- −$74 /mo · $887/yr
- Insurance
- −$108
- HOA
- −$0
- Vacancy / Maint / Mgmt
- −$262
- Net cashflow
- $-558
Break-even live
Sensitivity live
| Price | -10% $-411 | -5% $-485 | +0% $-558 | +5% $-632 | +10% $-705 |
|---|---|---|---|---|---|
| Rent | -10% $-657 | -5% $-608 | +0% $-558 | +5% $-509 | +10% $-459 |
| Rate | -1.0pp $-427 | -0.5pp $-492 | base $-558 | +0.5pp $-626 | +1.0pp $-694 |
UW: 25.0% down · 7.5% · 30yr · 1.5% tax · 5.0% vac · 8.0% maint · 8.0% mgmt
Financing live
Cash to close
- Down payment
- $65,000
- Closing costs
- $7,800
- Reserves months
- —
- Total cash needed
- —
Loan-product check · same deal, 3 products live
Conventional
25% down · 7.5% · 30yr
- Down + closing
- —
- Monthly P&I
- —
- Monthly cashflow
- —
- DSCR
- —
- Eligible?
- —
Personal DTI + credit; lowest rate.
DSCR
20% down · 8.5% · 30yr
- Down + closing
- —
- Monthly P&I
- —
- Monthly cashflow
- —
- DSCR
- —
- Eligible?
- —
No personal income docs; deal must DSCR.
Hard money
10% down · 12.0% · 12mo
- Down + closing
- —
- Monthly P&I
- —
- Monthly cashflow
- —
- DSCR
- —
- Eligible?
- —
Short-term bridge; refi at stabilization.
Rent comps 1 comps
| Address | Beds | Baths | Sqft | Rent | $/sqft | DOM | Units | Dist |
|---|---|---|---|---|---|---|---|---|
| 120 W Marshall St Unit 2 Wytheville, VA | 2.0 | 1.0 | 900 | $1,250 | $1.39 | 45d | 1 | 0.98mi |
Listing history 15 events
-
2026-06-21days on market $260,000 Active 19 DOM
-
2026-06-21days on market $260,000 Active 18 DOM
-
2026-06-18days on market $260,000 Active 16 DOM
-
2026-06-17days on market $260,000 Active 15 DOM
-
2026-06-16days on market $260,000 Active 14 DOM
-
2026-06-15days on market $260,000 Active 13 DOM
-
2026-06-15days on market $260,000 Active 12 DOM
-
2026-06-13days on market $260,000 Active 11 DOM
-
2026-06-12days on market $260,000 Active 10 DOM
-
2026-06-09days on market $260,000 Active 7 DOM
-
2026-06-08days on market $260,000 Active 6 DOM
-
2026-06-08days on market $260,000 Active 5 DOM
-
2026-06-07days on market $260,000 Active 4 DOM
-
2026-06-02remarks 574-char remark
-
2026-06-02$260,000 Active 1 DOM
ⓘ Source: listings_history table (triggers on properties + properties_extension) + one-shot
backfill from property_details.listing_events for pre-trigger history.
Tax reassessment forecast VA · Resets to sale price
- Current annual tax
- $887 · $74/mo
- Projected year-2 tax
- $2,132 · $178/mo
- Expected delta
- +$1,245/yr (+$104/mo · 140.4%)
ⓘ Screening estimate from a state-policy table — verify with the county assessor before closing.
Nearby sold comps map
Loading sold comps map…
Walkable amenities ~0.75 mi
Loading nearby amenities…
Taxation est. · year 1
- Rental income
- $15,000
- − Mortgage interest
- −$14,564
- − Property taxes
- −$887
- − Insurance
- −$1,300
- − Repairs & maintenance
- −$1,200
- − Management
- −$1,200
- − Depreciation
- −$7,564
- Taxable loss
- −$11,715
- Est. tax savings @ 24.0%
- +$2,811
- After-tax cash flow
- $-3,887/yr
For passive investors: Depreciation is non-cash, so a rental often shows a tax loss while cash-flowing — sheltering income. Rental losses are passive: they offset passive income freely, and up to $25,000/yr can offset ordinary (W-2) income if you actively participate and your MAGI is under $100k (phasing out to $0 by $150k); unused losses carry forward. On sale, claimed depreciation is recaptured at up to 25%, and gains may owe capital-gains tax (a 1031 exchange can defer both). Figures are a year-1 estimate at your 24.0% rate — not tax advice; consult a CPA.
Schools (NCES district)
- District
- Wythe County Public School District
- NCES district ID
- 5104110
- Math proficiency
- 67% ▼ -23.00%
- Reading proficiency
- 77% ▼ -9.00%
- Median HH income
- $41,665
- Composite
- 60.19/100
- National rank
- #863
- State rank
- #20 of 131 in VA
Livability — Wytheville
- Score
- 76/100
- State rank
- #116
- US rank
- #3571
Category grades
Schools grade is shown separately in the Schools card above.
Census & demographics
- Census place
- Wytheville, VA
- City population
- 14,751
- Population (ZIP)
- 14,751
Population outlook (Wythe County) Hauer SSP2
- Today (2025)
- 29,176 people
- By 2030
- 28,993 · -0.6%
- By 2040
- 28,273 · -3.1%
- By 2050
- 27,055 · -7.3%
- By 2075
- 23,668 · -18.9%
- By 2100
- 18,904 · -35.2%
Race, ethnicity, and origin ACS 2023
- Neighborhood character
- Predominantly White (92%)
- Race & ethnicity
- White 92% Black 4% Two or more races 2% Hispanic / Latino 2% Asian 1%
- Common ancestry
- Serbian 2% Slovak 1% Italian 1%
- Foreign-born
- 2%
- Languages at home
- 98% English-only · Spanish 1% Other Indo-European 1%
Political lean MEDSL · Wythe
- 2024 margin
- Solid R (+59.5) · D 19.9% · R 79.5%
- 2008→2024 swing
- -26.7pp toward R · 2008: -32.8pp · 2024: -59.5pp
- All cycles
- 2024: R+59.5 2020: R+57.0 2016: R+54.9 2012: R+36.8 2008: R+32.8
Not yet ingested
- Civics
- —
Market trends
- HPI YoY
- ▼ -66.18%
- Current HPI
- 191.6387
- Rent YoY
- —
- Metro
- —
- State GDP YoY
- ▲ 2.40%
- F500 in state
- 50
Industry mix (Fortune 500 HQ in VA)
| Industry | F500 HQs | Revenue |
|---|---|---|
| Aerospace / Defense | 4 | $236B |
|
||
| Technology / Defense | 3 | $32B |
|
||
| Financial Services | 2 | $176B |
|
||
| Utilities | 2 | $27B |
|
||
| Insurance | 2 | $25B |
|
||
| Technology | 2 | $15B |
|
||
Price history
+128.1% since first listed2 events — show timeline
- 2026-06-01 Listed $260,000 SWVAR
- 2011-09-02 Sold (Public Records) $114,000 Public Records
Property tax history
+4.8%/yrLatest (2025): $887 · +0.0% YoY. Source: county tax records.
Cash-flow waterfall
monthlySold comps — $/sqft
last 12 mo · ≤1 miLoading sold comps…