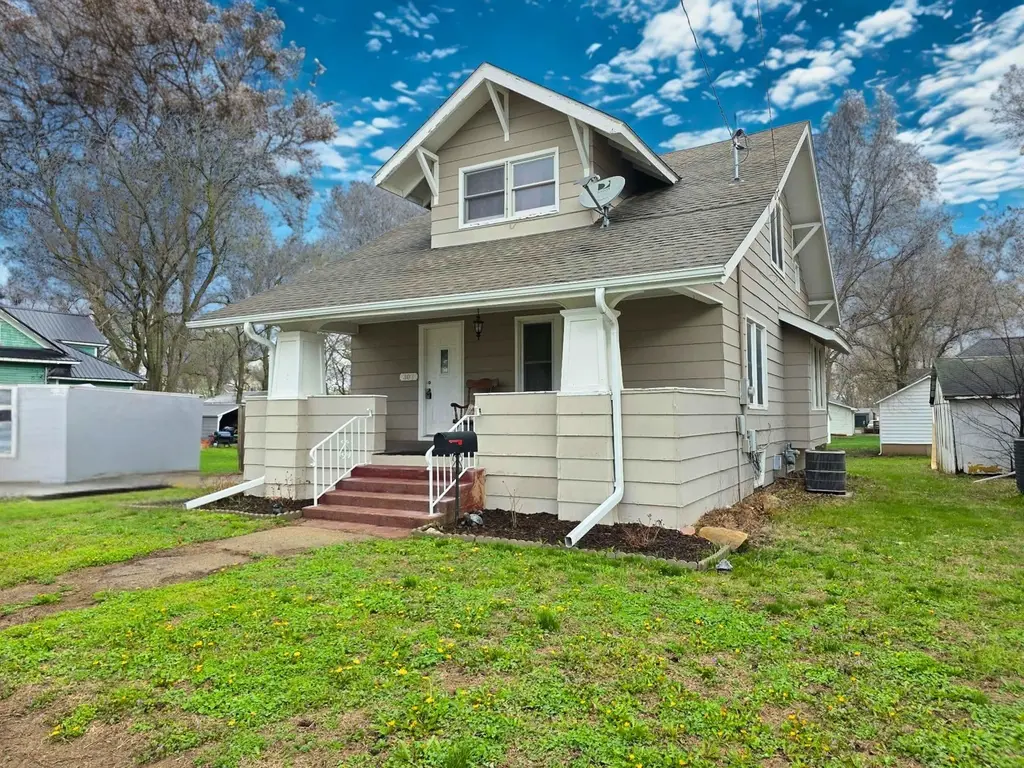
303 W Anthony St · Corydon, IA
Flood risk 1/10 · Minimal
- FEMA flood zone
- X (unshaded)
- Chance of flooding over 30 yrs
- 0.0%
- Est. flood insurance / yr
- $473 – $860
Fire risk 3/10 · Minor
- Est. fire insurance / yr
- $902 – $1,676
Heat risk 3/10 · Minor
- Hot days now (above 103°F)
- 7 days/yr
- Hot days in 30 yrs
- 15 days/yr
Wind risk 2/10 · Minimal
- Chance of severe wind over 30 yrs
- —
Air-quality risk 2/10 · Minimal
- Unhealthy air days now
- 1 days/yr
- Unhealthy air days in 30 yrs
- 3 days/yr
Risk factors via First Street. Map © Google.
Why this score? — see what drove the C- grade
The composite is a weighted blend of 9 inputs, each scored 0–100. Each bar is that input's sub-score; the figure is the points it added to the 100-point composite (weight × sub-score).
- Cash flow +11.5/30.0
- Appreciation +10.0/10.0
- ARV discount +8.1/15.0
- Schools +6.0/10.0
- Livability +4.2/5.0
- DSCR +3.4/10.0
- 1% rule +3.3/10.0
- Rent growth +2.5/5.0
- Condition / age +2.5/5.0
$130,000
🖨 Deal sheet 📄 Offer letter ✓ Due diligence
Listing remarks MLS
Welcome to this charming Cape Cod style home that perfectly balances classic character with modern convenience. Three comfortable bedrooms and one and three-quarter bathrooms provide ample space for family living. Beautiful hardwood floors flow throughout, complemented by carefully selected carpet and tile in just the right places. The formal dining room features a delightful window bench that cleverly doubles as additional storage - because who doesn't need more space for life's treasures? Step outside to discover your generous yard spanning nearly one-third of an acre, complete with a practical storage shed for all your outdoor gear. Located conveniently near Wayne High School and Hy Vee Grocery Store, this home offers the perfect blend of peaceful residential living with easy access to daily necessities. Schedule your private tour today!!
Key facts
- Formal dining room
- Generous yard
- Cape cod style home
Tags
Neighborhood map
What this means for you Summary
Snapshot
- This is a 3-bed/1.0-bath single-family listed at $130k.
Deal economics
- At list price, monthly cash flow is $-42 ($-501/yr) — negative.
- To cash-flow at today's rent, offer at most $123k (5.7% below list).
- To meet the 1% rule (rent ≥ 1% of price), the offer needs to be $108k (16.5% below list).
- Recommended offer: $108k (16.5% below list) — sets the bar for 1% rule.
Location & tenants
- Location reads 83/100 on livability (#33 in IA, #995 nationally) — a professional / high-income tenant draw. Strengths: crime A+, cost of living A+, housing A+; Watch: amenities F, commute F.
- Wayne Community School District (rural): math 69% / reading 74% proficiency, ranked #139 of 289 in IA (top 48%) — strong family-tenant draw, lease renewals of 3-5y typical.
- Market conditions: 13 active listings in the ZIP; 1 comparable units currently listed for rent nearby; 6 units permitted in Wayne County in 2024 (0 in 5+ unit buildings).
Forward outlook
- In year one you build about $14k of equity ($899 loan paydown + $13k appreciation (10.0% local appreciation)).
- Wayne County population projected to shrink 8% by 2050 — rents likely to lag national; underwrite the cash flow, not the appreciation.
- At projected returns (10.0% appreciation + 3.0% rent growth), your $36k cash investment doubles in ~3 years — after that, you're playing with house money.
- By year 3, paydown + projected appreciation supports a ~$35k cash-out refi (75% LTV) — recoverable capital for the next deal without selling this one.
Negotiation context
- It's been on market 48 days — a 3% lower offer ($126k) is reasonable based on typical stale-listing flexibility.
- 3 sale attempts with the ask held roughly flat each time — persistent listings suggest the price (not the market) is what's stuck; bring a comps-based counter.
- Current owner paid $90k; 45% above their basis — modest negotiation headroom, anchor on the comps not their cost.
Risks & watch-outs
- Watch-outs: built in 1920 — expect roof / HVAC / electrical / plumbing capex.
Questions for the listing agent
- What do current leases actually rent for vs. the listed asking? Can we see a recent rent roll and the last 12 months of T-12 income?
- It's been on market 48 days. Have you received any prior offers? Is the seller open to a 17% concession, seller financing, or rate buy-down credit?
- Built in 1920 — when were the roof, HVAC, electrical panel, plumbing, and water heater last replaced?
- Is there a deadline driving the sale (1031 exchange, divorce, estate, relocation)? That informs how much negotiation room exists.
- Schools are A-rated — typically a magnet for longer-tenancy family renters. What's the average tenant stay here, and is there a school-zone premium baked into asking?
- What's the average days-on-market for RENTAL listings here right now (not sales)? A rising rental-DOM trend means longer vacancies and softer asking-rent achievability than the comps imply.
- What's the recent tenant-quality profile in this submarket — average credit score on applications, eviction rate, late-payment / NSF rate, and stable-employment percentage? A property-management company in the area should have these aggregated.
- How much new for-sale + rental construction is in the pipeline within 1–3 miles? Heavy new supply typically softens prices + rents 12–24 months out; constrained supply supports both.
Investment metrics
- 1% rule
- 0.83% ✗
- Cap rate
- 5.91%
- Cash-on-cash
- -1.38%
- DSCR
- 0.94
- GRM
- 10.0
CMA / ARV
- ARV (median comp)
- $131,718
- List price
- $130,000
- Delta
- -1.30%
- Verdict
- FAIR
- Comps
- 20 within 1.0 mi
Show comp detail 10 sales within ~0.75 mi
| Address | Dist | Beds/Ba | Sqft | Sold | Price | $/sf | Match |
|---|---|---|---|---|---|---|---|
| 303 W Anthony St | 0.00mi | 3/2.0 | 1,446 (0%) | 1mo | $130,000 | $90 | 95 |
| 405 N Greeley St | 0.16mi | 3/1.0 | 1,400 (-3%) | 6mo | $89,000 | $64 | 82 |
| 213 N West St | 0.06mi | 3/2.0 | 1,428 (-1%) | 24mo | $199,000 | $139 | 71 |
| 412 W Jefferson St | 0.23mi | 3/2.0 | 1,631 (+13%) | 1mo | $47,000 | $29 | 63 |
| 414 W Jefferson St | 0.24mi | 2/1.0 (-1) | 1,300 (-10%) | 13mo | $135,000 | $104 | 56 |
| 419 E Moore St | 0.47mi | 3/1.0 | 1,392 (-4%) | 22mo | $45,000 | $32 | 54 |
| 405 S Johnson St | 0.47mi | 3/1.5 | 1,368 (-5%) | 18mo | $182,500 | $133 | 52 |
| 306 W South St | 0.46mi | 2/1.0 (-1) | 1,264 (-13%) | 11mo | $155,000 | $123 | 43 |
| 407 S West St | 0.37mi | 3/1.5 | 1,658 (+15%) | 17mo | $165,000 | $100 | 42 |
| 511 E State St | 0.54mi | 3/1.0 | 1,245 (-14%) | 13mo | $88,000 | $71 | 41 |
Match score weights: distance 35% · size 25% · config 20% · recency 20%. Top-matched comps best support the ARV.
Projected returns pro-forma
10.0% appreciation · 3.0% rent growth · sell at horizon
- IRR
- 23.3%
- Equity multiple
- 2.87×
- Total profit
- $68,159
- Equity at exit
- $117,114
- IRR
- 20.8%
- Equity multiple
- 6.57×
- Total profit
- $202,841
- Equity at exit
- $252,561
Cash invested: $36,400 (down + closing). Projections, not guarantees.
Landlord ↔ Tenant lean methodology
- Overall (STATE)
- 83 Strongly Landlord-Friendly
- State Iowa
- 83 Strongly Landlord-Friendly · R+6
- County
- — inherits STATE
- City
- — inherits STATE
ZIP-level market 50060
- Home prices YoY
- 5.1%
- Active inventory
- 13
- Price-to-rent
- 10.0×
Monthly cashflow live
- Estimated rent
- $1,085 medium interval (Pro) →
- Mortgage (P&I)
- −$682
- Tax from tax record
- −$163 /mo · $1,956/yr
- Insurance
- −$54
- HOA
- −$0
- Vacancy / Maint / Mgmt
- −$228
- Net cashflow
- $-42
Break-even live
UW: 25.0% down · 7.5% · 30yr · 1.5% tax · 5.0% vac · 8.0% maint · 8.0% mgmt
Financing live
Cash to close
- Down payment
- $32,500
- Closing costs
- $3,900
- Reserves months
- —
- Total cash needed
- —
Loan-product check · same deal, 3 products live
Conventional
25% down · 7.5% · 30yr
- Down + closing
- —
- Monthly P&I
- —
- Monthly cashflow
- —
- DSCR
- —
- Eligible?
- —
Personal DTI + credit; lowest rate.
DSCR
20% down · 8.5% · 30yr
- Down + closing
- —
- Monthly P&I
- —
- Monthly cashflow
- —
- DSCR
- —
- Eligible?
- —
No personal income docs; deal must DSCR.
Hard money
10% down · 12.0% · 12mo
- Down + closing
- —
- Monthly P&I
- —
- Monthly cashflow
- —
- DSCR
- —
- Eligible?
- —
Short-term bridge; refi at stabilization.
Rent comps 1 comps
| Address | Beds | Baths | Sqft | Rent | $/sqft | DOM | Units | Dist |
|---|---|---|---|---|---|---|---|---|
| 2218 Newton Rd Corydon, IA | 2.0–3.0 | 1.0–2.0 | 1042 | $1,085 | $1.04 | 43d | 5 | 0.57mi |
Listing history 8 events
-
2026-06-01days on market $130,000 Active 48 DOM
-
2026-05-31days on market $130,000 Active 47 DOM
-
2026-05-31days on market $130,000 Active 46 DOM
-
2026-04-14$130,000 Active 853-char remark
Show marketing remark (853 chars)
Welcome to this charming Cape Cod style home that perfectly balances classic character with modern convenience. Three comfortable bedrooms and one and three-quarter bathrooms provide ample space for family living. Beautiful hardwood floors flow throughout, complemented by carefully selected carpet and tile in just the right places. The formal dining room features a delightful window bench that cleverly doubles as additional storage - because who doesn't need more space for life's treasures? Step outside to discover your generous yard spanning nearly one-third of an acre, complete with a practical storage shed for all your outdoor gear. Located conveniently near Wayne High School and Hy Vee Grocery Store, this home offers the perfect blend of peaceful residential living with easy access to daily necessities. Schedule your private tour today!!
-
2026-03-27historical
-
2025-12-08$130,000 Active
-
2025-12-08$130,000 Active
-
2019-07-30soldstatus $89,500
ⓘ Source: listings_history table (triggers on properties + properties_extension) + one-shot
backfill from property_details.listing_events for pre-trigger history.
Tax reassessment forecast IA · Partial reset (capped growth)
- Current annual tax
- $1,956 · $163/mo
- Projected year-2 tax
- $1,998 · $167/mo
- Expected delta
- +$42/yr (+$4/mo · 2.2%)
ⓘ Screening estimate from a state-policy table — verify with the county assessor before closing.
Climate risk First Street
- Flood 1/10 Low FEMA zone X (unshaded) · 0% chance over 30 yrs
- Wildfire 3/10 Moderate
- Heat 3/10 Moderate 7 d/yr ≥103°F today · 15 d/yr by 30 yrs out
- Wind 2/10 Low
- Air quality 2/10 Low 1 unhealthy d/yr today · 3 by 30 yrs out
Nearby sold comps map
Loading sold comps map…
Walkable amenities ~0.75 mi
Loading nearby amenities…
Taxation est. · year 1
- Rental income
- $13,020
- − Mortgage interest
- −$7,282
- − Property taxes
- −$1,956
- − Insurance
- −$650
- − Repairs & maintenance
- −$1,042
- − Management
- −$1,042
- − Depreciation
- −$3,782
- Taxable loss
- −$2,733
- Est. tax savings @ 24.0%
- +$656
- After-tax cash flow
- $155/yr
For passive investors: Depreciation is non-cash, so a rental often shows a tax loss while cash-flowing — sheltering income. Rental losses are passive: they offset passive income freely, and up to $25,000/yr can offset ordinary (W-2) income if you actively participate and your MAGI is under $100k (phasing out to $0 by $150k); unused losses carry forward. On sale, claimed depreciation is recaptured at up to 25%, and gains may owe capital-gains tax (a 1031 exchange can defer both). Figures are a year-1 estimate at your 24.0% rate — not tax advice; consult a CPA.
Schools (NCES district)
- District
- Wayne Community School District
- NCES district ID
- 1930560
- Math proficiency
- 69% ▼ -7.00%
- Reading proficiency
- 74% ▲ 4.00%
- Median HH income
- $40,872
- Composite
- 59.73/100
- National rank
- #902
- State rank
- #139 of 289 in IA
Livability — Corydon
- Score
- 83/100
- State rank
- #33
- US rank
- #995
Category grades
Schools grade is shown separately in the Schools card above.
Census & demographics
- Census place
- Corydon, IA
- City population
- 2,385
- Population (ZIP)
- 2,385
Population outlook (Wayne County) Hauer SSP2
- Today (2025)
- 6,213 people
- By 2030
- 6,109 · -1.7%
- By 2040
- 5,926 · -4.6%
- By 2050
- 5,716 · -8.0%
- By 2075
- 5,502 · -11.4%
- By 2100
- 4,890 · -21.3%
Race, ethnicity, and origin ACS 2023
- Neighborhood character
- Predominantly White (94%)
- Race & ethnicity
- White 94% Two or more races 2% Hispanic / Latino 1% Asian 1% Black 1%
- Common ancestry
- Iranian 4% Slovak 3% Lithuanian 2%
- Foreign-born
- 2% · China, Canada
- Languages at home
- 98% English-only · Other Indo-European 1% Other Asian/Pacific 1%
Political lean MEDSL · Wayne
- 2024 margin
- Solid R (+57.2) · D 20.6% · R 77.8% · Other 1.6%
- 2008→2024 swing
- -50.2pp toward R · 2008: -7.0pp · 2024: -57.2pp
- All cycles
- 2024: R+57.2 2020: R+51.8 2016: R+46.2 2012: R+11.5 2008: R+7.0
Not yet ingested
- Civics
- —
Market trends
- HPI YoY
- ▲ 12.57%
- Current HPI
- 259.5272
- Rent YoY
- —
- Metro
- —
- State GDP YoY
- ▲ 2.48%
- F500 in state
- 4
Industry mix (Fortune 500 HQ in IA)
| Industry | F500 HQs | Revenue |
|---|---|---|
| Financial Services | 1 | $16B |
|
||
| Retail / Convenience | 1 | $15B |
|
||
Price history
+45.3% since first listed5 events — show timeline
- 2026-04-14 Listed $130,000 DMMLS
- 2026-03-27 Listing Removed — DMMLS
- 2025-12-08 Listed $130,000 IAR
- 2025-12-08 Listed $130,000 DMMLS
- 2019-07-30 Sold (Public Records) $89,500 Public Records
Property tax history
+6.6%/yrLatest (2025): $1,956 · +0.5% YoY. Source: county tax records.
Cash-flow waterfall
monthlySold comps — $/sqft
last 12 mo · ≤1 miLoading sold comps…