2304 Mark St #183 · Croswell, MI
Flood risk No data
- FEMA flood zone
- —
- Chance of flooding over 30 yrs
- —
- Est. flood insurance / yr
- —
Fire risk No data
- Est. fire insurance / yr
- —
Heat risk No data
- Hot days now (above threshold)
- —
- Hot days in 30 yrs
- —
Wind risk No data
- Chance of severe wind over 30 yrs
- —
Air-quality risk No data
- Unhealthy air days now
- —
- Unhealthy air days in 30 yrs
- —
Risk factors via First Street. Map © Google.
Why this score? — see what drove the B- grade
The composite is a weighted blend of 9 inputs, each scored 0–100. Each bar is that input's sub-score; the figure is the points it added to the 100-point composite (weight × sub-score).
- Cash flow +30.0/30.0
- 1% rule +10.0/10.0
- DSCR +10.0/10.0
- ARV discount +7.5/15.0
- Schools +3.2/10.0
- Livability +3.1/5.0
- Rent growth +2.5/5.0
- Condition / age +2.5/5.0
- Appreciation +0.0/10.0
$66,900
🖨 Deal sheet (PDF) 📄 Offer letter ✓ Due diligence
Listing remarks MLS
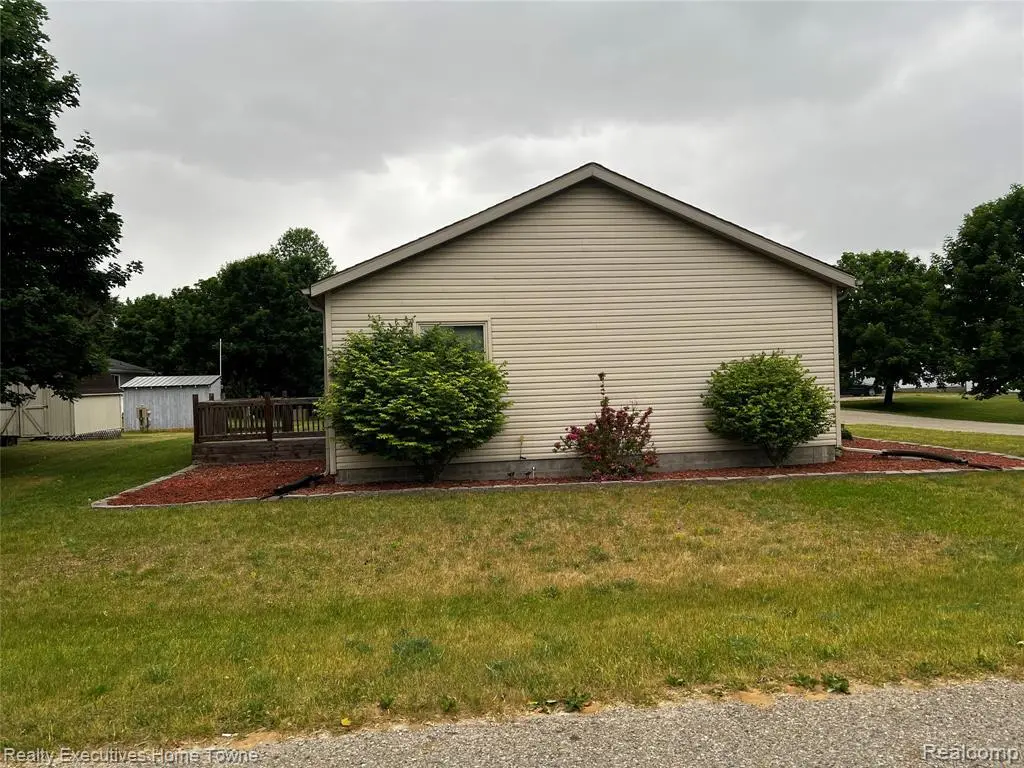
Remarks: A Remarkable Very well cared Premium 2006 DUTCH manufactured home has full drywall not wallboard. This beautiful 3 bedroom 2 Bath home has a lot of valuable upgrades. Ash Trim and All windows have been replaced and upgraded in the last six to seven years by Wall-side Windows and have a transferable warranty. Is plumbed for owned water softener. There is an attached Garage that is pre wired to accommodate a generator and side entrance with a large Shed. With Central air , and all the appliances. Home is move In Ready could be the one for you. The home sits on a beautiful Corner lot across an open area so has a country feel and a large shed and a nice yard, High Speed Fiber Optic Internet available in Eagles Landing Estates, Manufactured Home Park in Croswell. This home has a !5-2 pitch roof this is a great home for just starting out in your retirement Exfinity is available in the park
Key facts
- Attached garage
- Full drywall
- Corner lot
Tags
Property features AI
Finance
- Other: Pets allowed (call for details; breed restrictions may apply)
Exterior
- Parking: Attached garage; Garage with door opener; Garage faces side; Assigned parking; 1 garage space
- Utilities: Underground utilities; Public sewer
- Home design: Single family residence; One level; Ground-level entry; Vinyl siding
- Construction: Composition roof; Block and pillar/post/pier foundation; Built with vinyl siding
- Exterior features: Deck; Porch; Paved road access
Interior
- Kitchen: Dishwasher; Free-standing gas oven; Free-standing gas range; Microwave; Range hood
- Bathrooms: 2 full bathrooms
- Heating & cooling: Central air; Ceiling fan(s); Forced air heating; Natural gas heating
- Interior features: High speed internet
- Laundry & utility: Washer; Dryer; Electric dryer hookup; Gas dryer hookup; Laundry room; Washer hookup; Gas water heater
Neighborhood map
What this means for you Summary
Snapshot
- This is a 3-bed/2.0-bath other listed at $67k.
Deal economics
- At list price, monthly cash flow is $584 ($7k/yr) — positive.
- The deal already cash-flows at list — no discount required.
- Meets the 1% rule at list price ($1k rent vs $67k).
- Recommended offer: $66k (1.5% below list) — sets the bar for market timing.
Location & tenants
- Location reads 62/100 on livability (#549 in MI) — a middle-class / working-renter tenant base. Strengths: cost of living A+, housing A+; Watch: schools C-, crime D, employment D.
- Croswell-Lexington Community Schools (rural): math 30% / reading 47% proficiency, ranked #239 of 540 in MI (top 44%) — families likely to look elsewhere, expect single-tenant / working-renter base with shorter leases.
- Market conditions: 51 active listings in the ZIP; 63 units permitted in Sanilac County in 2024 (0 in 5+ unit buildings).
Forward outlook
- Local home prices are declining (-3.0%/yr); year-one equity from $463 of loan paydown is wiped out by about $2k of value loss. Plan a longer hold.
- Sanilac County population projected at -31% by 2050 — secular population decline; favor cash flow + early exit over multi-decade hold.
- At projected returns (-3.0% appreciation + 3.0% rent growth), your $19k cash investment doubles in ~4 years — after that, you're playing with house money.
Negotiation context
- It's been on market 16 days — a 2% lower offer ($66k) is reasonable based on typical stale-listing flexibility.
- 3 sale attempts since 7y ago with the ask held roughly flat each time — persistent listings suggest the price (not the market) is what's stuck; bring a comps-based counter.
- Current owner paid $48k; 38% above their basis — modest negotiation headroom, anchor on the comps not their cost.
Questions for the listing agent
- Is there a deadline driving the sale (1031 exchange, divorce, estate, relocation)? That informs how much negotiation room exists.
- Crime grade is D in this area — have there been break-ins, vandalism, or insurance claims at this property in the last 3 years? What carrier currently insures it and at what premium?
- What's the average days-on-market for RENTAL listings here right now (not sales)? A rising rental-DOM trend means longer vacancies and softer asking-rent achievability than the comps imply.
- What's the recent tenant-quality profile in this submarket — average credit score on applications, eviction rate, late-payment / NSF rate, and stable-employment percentage? A property-management company in the area should have these aggregated.
- How much new for-sale + rental construction is in the pipeline within 1–3 miles? Heavy new supply typically softens prices + rents 12–24 months out; constrained supply supports both.
Investment metrics
- 1% rule
- 1.98% ✓
- Cap rate
- 16.77%
- Cash-on-cash
- 37.40%
- DSCR
- 2.66
- GRM
- 4.2
CMA / ARV
No comps found within radius.
Projected returns pro-forma
-3.0% appreciation · 3.0% rent growth · sell at horizon
- IRR
- 33.4%
- Equity multiple
- 2.41×
- Total profit
- $26,368
- Equity at exit
- $9,975
- IRR
- 40.3%
- Equity multiple
- 4.79×
- Total profit
- $70,927
- Equity at exit
- $5,784
Cash invested: $18,732 (down + closing). Projections, not guarantees.
Landlord ↔ Tenant lean methodology
- Overall (STATE)
- 62 Landlord-Friendly
- State Michigan
- 62 Landlord-Friendly · EVEN
- County
- — inherits STATE
- City
- — inherits STATE
ZIP-level market 48422
- Home prices YoY
- -10.2%
- Active inventory
- 51
- Price-to-rent
- 4.2×
Monthly cashflow live
- Estimated rent
- $1,324 medium interval (Pro) →
- Mortgage (P&I)
- −$351
- Tax est. 1.5%
- −$84 /mo · $1,004/yr
- Insurance
- −$28
- HOA
- −$0
- Vacancy / Maint / Mgmt
- −$278
- Net cashflow
- $584
Break-even live
Sensitivity live
| Price | -10% $630 | -5% $607 | +0% $584 | +5% $561 | +10% $538 |
|---|---|---|---|---|---|
| Rent | -10% $479 | -5% $532 | +0% $584 | +5% $636 | +10% $689 |
| Rate | -1.0pp $618 | -0.5pp $601 | base $584 | +0.5pp $567 | +1.0pp $549 |
UW: 25.0% down · 7.5% · 30yr · 1.5% tax · 5.0% vac · 8.0% maint · 8.0% mgmt
Financing live
Cash to close
- Down payment
- $16,725
- Closing costs
- $2,007
- Reserves months
- —
- Total cash needed
- —
Loan-product check · same deal, 3 products live
Conventional
25% down · 7.5% · 30yr
- Down + closing
- —
- Monthly P&I
- —
- Monthly cashflow
- —
- DSCR
- —
- Eligible?
- —
Personal DTI + credit; lowest rate.
DSCR
20% down · 8.5% · 30yr
- Down + closing
- —
- Monthly P&I
- —
- Monthly cashflow
- —
- DSCR
- —
- Eligible?
- —
No personal income docs; deal must DSCR.
Hard money
10% down · 12.0% · 12mo
- Down + closing
- —
- Monthly P&I
- —
- Monthly cashflow
- —
- DSCR
- —
- Eligible?
- —
Short-term bridge; refi at stabilization.
Listing history 11 events
-
2026-06-21days on market $66,900 Active 16 DOM
-
2026-06-18days on market $66,900 Active 13 DOM
-
2026-06-17days on market $66,900 Active 12 DOM
-
2026-06-16days on market $66,900 Active 11 DOM
-
2026-06-15days on market $66,900 Active 10 DOM
-
2026-06-13days on market $66,900 Active 8 DOM
-
2026-06-13days on market $66,900 Active 7 DOM
-
2026-06-09days on market $66,900 Active 4 DOM
-
2026-06-08days on market $66,900 Active 3 DOM
-
2026-06-07remarks 699-char remark
-
2026-06-07$66,900 Active 2 DOM
ⓘ Source: listings_history table (triggers on properties + properties_extension) + one-shot
backfill from property_details.listing_events for pre-trigger history.
Nearby sold comps map
Loading sold comps map…
Walkable amenities ~0.75 mi
Loading nearby amenities…
Taxation est. · year 1
- Rental income
- $15,892
- − Mortgage interest
- −$3,747
- − Property taxes
- −$1,004
- − Insurance
- −$334
- − Repairs & maintenance
- −$1,271
- − Management
- −$1,271
- − Depreciation
- −$1,946
- Taxable income
- $6,318
- Est. tax owed @ 24.0%
- −$1,516
- After-tax cash flow
- $5,490/yr
For passive investors: Depreciation is non-cash, so a rental often shows a tax loss while cash-flowing — sheltering income. Rental losses are passive: they offset passive income freely, and up to $25,000/yr can offset ordinary (W-2) income if you actively participate and your MAGI is under $100k (phasing out to $0 by $150k); unused losses carry forward. On sale, claimed depreciation is recaptured at up to 25%, and gains may owe capital-gains tax (a 1031 exchange can defer both). Figures are a year-1 estimate at your 24.0% rate — not tax advice; consult a CPA.
Schools (NCES district)
- District
- Croswell-Lexington Community Schools
- NCES district ID
- 2611140
- Math proficiency
- 30% ▼ -7.00%
- Reading proficiency
- 47% ▼ -6.00%
- Median HH income
- $42,784
- Composite
- 32.49/100
- National rank
- #5707
- State rank
- #239 of 540 in MI
Livability — Croswell
- Score
- 62/100
- State rank
- #549
- US rank
- #17207
Category grades
Schools grade is shown separately in the Schools card above.
Census & demographics
- Population (ZIP)
- 6,172
Population outlook (Sanilac County) Hauer SSP2
- Today (2025)
- 37,948 people
- By 2030
- 35,772 · -5.7%
- By 2040
- 30,996 · -18.3%
- By 2050
- 26,280 · -30.7%
- By 2075
- 17,471 · -54.0%
- By 2100
- 10,572 · -72.1%
Race, ethnicity, and origin ACS 2023
- Neighborhood character
- Predominantly White (89%)
- Race & ethnicity
- White 89% Hispanic / Latino 7% Two or more races 4% Black 1%
- Hispanic origin (detail)
- Mexican 7%
- Common ancestry
- Romanian 9% Slovak 5% Lithuanian 3%
- Foreign-born
- 1% · Canada
- Languages at home
- 95% English-only · Spanish 5%
Political lean MEDSL · Sanilac
- 2024 margin
- Solid R (+47.7) · D 25.5% · R 73.2% · Other 1.3%
- 2008→2024 swing
- -39.6pp toward R · 2008: -8.1pp · 2024: -47.7pp
- All cycles
- 2024: R+47.7 2020: R+45.6 2016: R+44.5 2012: R+20.4 2008: R+8.1
Not yet ingested
- Civics
- —
Market trends
- HPI YoY
- ▼ -30.65%
- Current HPI
- 268.6695
- Rent YoY
- —
- Metro
- —
- State GDP YoY
- ▲ 1.37%
- F500 in state
- 28
Industry mix (Fortune 500 HQ in MI)
| Industry | F500 HQs | Revenue |
|---|---|---|
| Automotive Parts | 3 | $48B |
|
||
| Automotive | 2 | $372B |
|
||
| Chemicals | 1 | $45B |
|
||
| Automotive Retail | 1 | $29B |
|
||
| Healthcare / Medical Devices | 1 | $23B |
|
||
| Automotive Technology | 1 | $20B |
|
||
Price history
+21.9% since first listed6 events — show timeline
- 2026-06-02 Listed $66,900 MiRealSource-MiMLS
- 2026-06-02 Listed $66,900 REALCOMP
- 2019-08-07 Sold (MLS) $48,500 MiRealSource-MiMLS
- 2019-07-18 Pending — MiRealSource-MiMLS
- 2019-06-08 Price Changed $49,900 MiRealSource-MiMLS
- 2019-04-28 Listed $54,900 MiRealSource-MiMLS
Property tax history
+2.5%/yrLatest (2025): $102 · -54.6% YoY. Source: county tax records.
Cash-flow waterfall
monthlySold comps — $/sqft
last 12 mo · ≤1 miLoading sold comps…