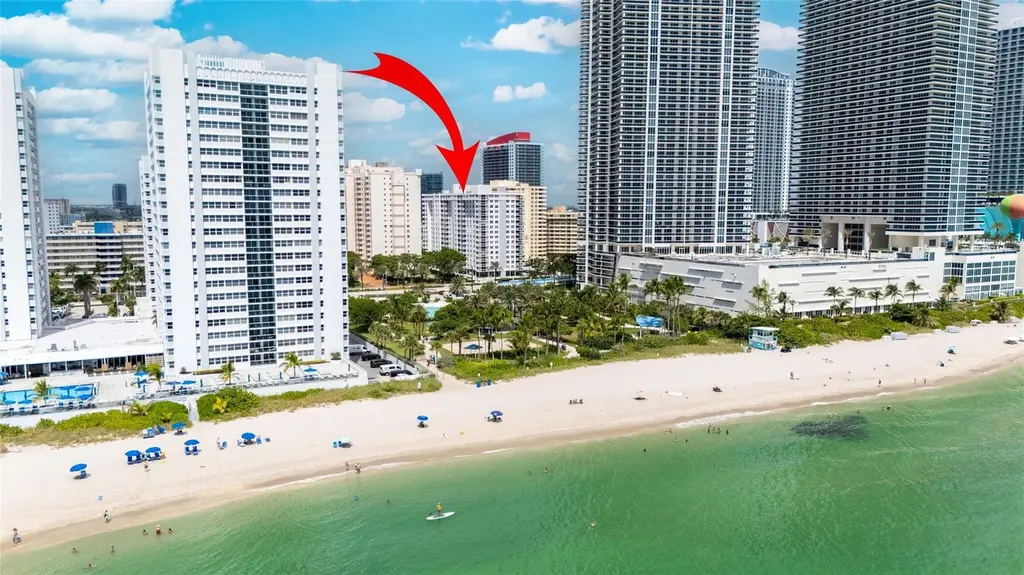
1849 S Ocean Dr #711 · Hallandale Beach, FL
Flood risk 8/10 · Major
- FEMA flood zone
- AE
- Chance of flooding over 30 yrs
- 0.98%
- Est. flood insurance / yr
- $1,737 – $8,500
Fire risk 1/10 · Minimal
- Est. fire insurance / yr
- $947 – $1,759
Heat risk 10/10 · Severe
- Hot days now (above 104°F)
- 6 days/yr
- Hot days in 30 yrs
- 22 days/yr
Wind risk 10/10 · Severe
- Chance of severe wind over 30 yrs
- 99.0%
Air-quality risk 2/10 · Minimal
- Unhealthy air days now
- 1 days/yr
- Unhealthy air days in 30 yrs
- 2 days/yr
Risk factors via First Street. Map © Google.
Why this score? — see what drove the D+ grade
The composite is a weighted blend of 9 inputs, each scored 0–100. Each bar is that input's sub-score; the figure is the points it added to the 100-point composite (weight × sub-score).
- Cash flow +15.0/30.0
- 1% rule +8.1/10.0
- ARV discount +7.5/15.0
- DSCR +4.6/10.0
- Schools +4.1/10.0
- Livability +4.0/5.0
- Rent growth +2.6/5.0
- Condition / age +2.5/5.0
- Appreciation +0.0/10.0
$349,900
🖨 Deal sheet (PDF) 📄 Offer letter ✓ Due diligence
Listing remarks
Hallandale Beach, one of the best area in Florida. This apartment has been fully modernized and remodeled to BDS standards: kitchen, two bedrooms, two bathrooms, new air conditioning, porcelain tile floors, smooth ceilings and walls, doors, new plumbing and wiring, two walk-in closets, two California closets, etc. , and is ready for occupancy. The building has recently been renovated and inspected. The maintenance fee includes: water, a swimming pool, gym, two billiard rooms, ping-pong, car wash, etc. The building is located directly across from the ocean and Hallandale Beach City Park, minutes from supermarkets, pharmacies, restaurants, casinos, etc. , and 15-20 min. from two airports. Own
Key facts
- Ping pong
- Fully renovated
- Car wash area
Tags
Property features AI
Finance
- HOA & community: Association with monthly fee; HOA fee includes common areas; HOA fee: $945 per month; Association amenities: other; Pets allowed (number limit applies)
Exterior
- Parking: Assigned parking; Guest parking (total spaces: 1)
- Security: Fire alarm; Security guard; Smoke detectors; Security system
- Utilities: Public water; Public sewer; Electricity available
- Home design: Condominium; 16-story building; Faces south
- Construction: Concrete block (no stucco) construction; Other roof
- Exterior features: Fenced; Waterfront property; Waterfront features: other
Interior
- Kitchen: Dishwasher; Electric range; Microwave; Refrigerator; Disposal
- Bedrooms: 2 bedrooms (main level)
- Flooring: Tile
- Bathrooms: 2 full bathrooms
- Heating & cooling: Has heating (type: other); Electric cooling
- Interior features: Updated/remodeled condominium; Disposal; Dishwasher; Electric range; Microwave; Refrigerator
- Laundry & utility: Washer hookup
Neighborhood map
What this means for you Summary
Snapshot
- This is a 2-bed/2.0-bath condo listed at $350k.
Deal economics
- At list price, monthly cash flow is $-318 ($-4k/yr) — negative.
- To cash-flow at today's rent, offer at most $294k (16.0% below list).
- Meets the 1% rule at list price ($5k rent vs $350k).
- Recommended offer: $294k (16.0% below list) — sets the bar for cash-flow.
- Cap rate 6.7% vs local median 5.2% in Hallandale Beach — meaningfully above typical; check what's discounted (condition, days-on-market, listing class) to confirm the premium yield is real.
Location & tenants
- Location reads 81/100 on livability (#86 in FL, #1,400 nationally) — a professional / high-income tenant draw. Strengths: commute A+, health & safety A+, crime B+; Watch: employment D-.
- Broward (suburban): math 42% / reading 53% proficiency, ranked #46 of 73 in FL (top 63%) — families likely to look elsewhere, expect single-tenant / working-renter base with shorter leases.
- Zoned schools: Gulfstream Academy of Hallandale Beach (math 32% / reading 40%, grade F, #1,670 of 2,144 statewide, top 78%, 1,317 students, 73% FRL); Nova Middle School (math 44% / reading 53%, grade C-, #274 of 571 statewide, top 50%, 1,284 students, 68% FRL); Hallandale High School (math 10% / reading 24%, grade F, #597 of 667 statewide, top 90%, 1,104 students, 70% FRL) — zoned schools average 70% FRL vs 51% district-wide (19 pts higher); higher-poverty schools than district average — tighter screening recommended.
- Zoned-school proficiency averages 34% at this address vs 48% district-wide (-14 pts) — the specific schools serving this property underperform the Broward average; the district grade overstates school quality for this exact location.
- Market conditions: Rents flat; 1380 active listings in the ZIP; 40 comparable units currently listed for rent nearby; rentals at typical pace (median 27d on market — plan ~3-4 weeks tenant-placement turnaround); 2,111 units permitted in Broward County in 2024 (1,265 in 5+ unit buildings).
Forward outlook
- Local home prices are declining (-3.0%/yr); year-one equity from $2k of loan paydown is wiped out by about $10k of value loss. Plan a longer hold.
- Broward County population projected at +34% by 2050 — long-run rental-demand tailwind backs the buy-and-hold thesis.
Negotiation context
- It's been on market 97 days — a 9% lower offer ($318k) is reasonable based on typical stale-listing flexibility.
- 3 sale attempts with the ask held roughly flat each time — persistent listings suggest the price (not the market) is what's stuck; bring a comps-based counter.
- Current owner paid $118k; list at $350k implies a 198% gain — meaningful room to come down on a strong offer.
Risks & watch-outs
- Watch-outs: flood insurance adds $427/mo; HOA is 21% of rent.
- Climate carrying-cost: in FEMA flood zone AE (mandatory federal flood insurance); severe wind risk, 99% chance of damaging wind over 30y; extreme-heat days projected 6→22/yr by 2055 (HVAC capex compounding) — expect insurance premiums to compound above CPI over the hold.
Questions for the listing agent
- What do current leases actually rent for vs. the listed asking? Can we see a recent rent roll and the last 12 months of T-12 income?
- It's been on market 97 days. Have you received any prior offers? Is the seller open to a 16% concession, seller financing, or rate buy-down credit?
- Built in 1970 — when were the roof, HVAC, electrical panel, plumbing, and water heater last replaced?
- What's the actual annual flood-insurance premium (NFIP or private), and is the property in a SFHA with mandatory coverage?
- What does the HOA fee cover, when was the last increase, and are there any pending special assessments or reserve-fund shortfalls?
- Any open or pending special assessments — roof, HVAC, plumbing, elevator, façade? What's the per-unit balance and payoff schedule, and is the seller paying it off at close or rolling it to the buyer?
- Why hasn't it sold? Are there any deal-killer items the seller is aware of (foundation, flood, title, zoning, code violations)?
- Is there a deadline driving the sale (1031 exchange, divorce, estate, relocation)? That informs how much negotiation room exists.
- The area grade is low — what's the realistic commute time and amenity access for the typical tenant pool here? Any planned neighborhood developments (good or bad) we should know about?
- What's the average days-on-market for RENTAL listings here right now (not sales)? A rising rental-DOM trend means longer vacancies and softer asking-rent achievability than the comps imply.
- What's the recent tenant-quality profile in this submarket — average credit score on applications, eviction rate, late-payment / NSF rate, and stable-employment percentage? A property-management company in the area should have these aggregated.
- How much new apartment / multifamily construction is in the pipeline within 1–3 miles? Heavy new supply (>2% of stock underway) typically softens rents 12–24 months out; light construction supports rent growth.
Investment metrics
- 1% rule
- 1.31% ✓
- Cap rate
- 6.67%
- Cash-on-cash
- 1.33%
- DSCR
- 1.06
- GRM
- 6.4
CMA / ARV
No comps found within radius.
Projected returns pro-forma
-3.0% appreciation · 0.43% rent growth · sell at horizon
- IRR
- -27.5%
- Equity multiple
- 0.11×
- Total profit
- $-87,486
- Equity at exit
- $52,171
- IRR
- -53.6%
- Equity multiple
- -0.46×
- Total profit
- $-143,185
- Equity at exit
- $30,253
Cash invested: $97,972 (down + closing). Projections, not guarantees.
Landlord ↔ Tenant lean methodology
- Overall (STATE)
- 87 Strongly Landlord-Friendly
- State Florida
- 87 Strongly Landlord-Friendly · R+3
- County
- — inherits STATE
- City
- — inherits STATE
ZIP-level market 33009
- Rents YoY
- 0.4%
- Active inventory
- 1380
- Price-to-rent
- 6.4×
Monthly cashflow live
- Estimated rent
- $4,581 high interval (Pro) →
- Mortgage (P&I)
- −$1,835
- Tax from tax record
- −$584 /mo · $7,010/yr
- Insurance
- −$146
- Flood insurance flood zone
- −$427 /mo · $5,118/yr
- HOA
- −$945
- Vacancy / Maint / Mgmt
- −$962
- Net cashflow
- $-318
Break-even live
Sensitivity live
| Price | -10% $-120 | -5% $-219 | +0% $-318 | +5% $-417 | +10% $-516 |
|---|---|---|---|---|---|
| Rent | -10% $-680 | -5% $-499 | +0% $-318 | +5% $-137 | +10% $44 |
| Rate | -1.0pp $-142 | -0.5pp $-229 | base $-318 | +0.5pp $-408 | +1.0pp $-501 |
UW: 25.0% down · 7.5% · 30yr · 1.5% tax · 5.0% vac · 8.0% maint · 8.0% mgmt
Financing live
Cash to close
- Down payment
- $87,475
- Closing costs
- $10,497
- Reserves months
- —
- Total cash needed
- —
Loan-product check · same deal, 3 products live
Conventional
25% down · 7.5% · 30yr
- Down + closing
- —
- Monthly P&I
- —
- Monthly cashflow
- —
- DSCR
- —
- Eligible?
- —
Personal DTI + credit; lowest rate.
DSCR
20% down · 8.5% · 30yr
- Down + closing
- —
- Monthly P&I
- —
- Monthly cashflow
- —
- DSCR
- —
- Eligible?
- —
No personal income docs; deal must DSCR.
Hard money
10% down · 12.0% · 12mo
- Down + closing
- —
- Monthly P&I
- —
- Monthly cashflow
- —
- DSCR
- —
- Eligible?
- —
Short-term bridge; refi at stabilization.
Rent comps 40 comps
| Address | Beds | Baths | Sqft | Rent | $/sqft | DOM | Units | Dist |
|---|---|---|---|---|---|---|---|---|
| 1880 N Ocean Dr Unit TS705 Hallandale Beach, FL | 2.0 | 2.0 | 1350 | $4,900 | $3.63 | 17d | 1 | 0.09mi |
| 1880 N Ocean Dr Unit TS705 Hallandale Beach, FL | 2.0 | 2.0 | 1350 | $5,000 | $3.70 | 19d | 1 | 0.09mi |
| 1880 N Ocean Dr Unit TS705 Hallandale Beach, FL | 2.0 | 2.0 | 1350 | $5,000 | $3.70 | 26d | 1 | 0.09mi |
| 1850 S Ocean Dr #2909 Hallandale Beach, FL | 2.0 | 1.0 | 1086 | $4,050 | $3.73 | 26d | 1 | 0.10mi |
| 1850 S Ocean Dr #3509 Hallandale Beach, FL | 2.0 | 1.0 | 1086 | $4,300 | $3.96 | 26d | 1 | 0.10mi |
| 1850 S Ocean Dr #4009 Hallandale Beach, FL | 2.0 | 1.0 | 1086 | $3,900 | $3.59 | 26d | 1 | 0.10mi |
| 1850 S Ocean Dr #3509 Hallandale Beach, FL | 2.0 | 1.0 | 1086 | $4,000 | $3.68 | 5d | 1 | 0.10mi |
| 1830 S Ocean Dr #1610 Hallandale Beach, FL | 2.0 | 2.0 | 1337 | $6,500 | $4.86 | 26d | 1 | 0.12mi |
| 1830 S Ocean Dr #2410 Hallandale Beach, FL | 2.0 | 2.0 | 1337 | $5,500 | $4.11 | 9d | 1 | 0.12mi |
| 1830 S Ocean Dr #3605 Hallandale Beach, FL | 1.0 | 1.0 | 811 | $4,500 | $5.55 | 5d | 1 | 0.12mi |
| 1830 S Ocean Dr #3210 Hallandale Beach, FL | 2.0 | 2.0 | 1337 | $5,300 | $3.96 | 26d | 1 | 0.12mi |
| 1830 S Ocean Dr #3910 Hallandale Beach, FL | 2.0 | 2.0 | 1337 | $8,000 | $5.98 | 26d | 1 | 0.12mi |
| 1830 S Ocean Dr #1812 Hallandale Beach, FL | 1.0 | 1.0 | 844 | $4,999 | $5.92 | 22d | 1 | 0.12mi |
| 1830 S Ocean Dr #3510 Hallandale Beach, FL | 2.0 | 2.0 | 1337 | $5,500 | $4.11 | 7d | 1 | 0.12mi |
| 1830 S Ocean Dr #3510 Hallandale Beach, FL | 2.0 | 2.0 | 1337 | $5,900 | $4.41 | 13d | 1 | 0.12mi |
| 1830 S Ocean Dr #1808 Hallandale Beach, FL | 2.0 | 2.0 | 1458 | $7,500 | $5.14 | 17d | 1 | 0.12mi |
| 1830 S Ocean Dr #4006 Hallandale Beach, FL | 2.0 | 2.0 | 1458 | $5,500 | $3.77 | 12d | 1 | 0.12mi |
| 1830 S Ocean Dr #2010 Hallandale Beach, FL | 2.0 | 2.0 | 1337 | $8,500 | $6.36 | 26d | 1 | 0.12mi |
| 1830 S Ocean Dr #1806 Hallandale Beach, FL | 2.0 | 2.0 | 1458 | $5,000 | $3.43 | 22d | 1 | 0.12mi |
| 1830 S Ocean Dr #3208 Hallandale Beach, FL | 2.0 | 2.0 | 1458 | $4,500 | $3.09 | 26d | 1 | 0.12mi |
| 1830 S Ocean Dr #1709 Hallandale Beach, FL | 1.0 | 1.0 | 844 | $4,500 | $5.33 | 26d | 1 | 0.12mi |
| 1830 S Ocean Dr #2409 Hallandale Beach, FL | 1.0 | 1.0 | 844 | $4,300 | $5.09 | 16d | 1 | 0.12mi |
| 1830 S Ocean Dr #4710 Hallandale Beach, FL | 2.0 | 2.0 | 1337 | $6,000 | $4.49 | 26d | 1 | 0.12mi |
| 1830 S Ocean Dr #4307 Hallandale Beach, FL | 1.0 | 1.0 | 871 | $4,100 | $4.71 | 26d | 1 | 0.12mi |
| 1830 S Ocean Dr #2412 Hallandale Beach, FL | 1.0 | 1.0 | 844 | $3,600 | $4.27 | 12d | 1 | 0.12mi |
| 1830 S Ocean Dr #4612 Hallandale Beach, FL | 1.0 | 1.0 | 844 | $4,950 | $5.86 | 26d | 1 | 0.12mi |
| 1830 S Ocean Dr #3407 Hallandale Beach, FL | 1.0 | 1.0 | 871 | $4,000 | $4.59 | 26d | 1 | 0.12mi |
| 1830 S Ocean Dr #2806 Hallandale Beach, FL | 2.0 | 2.0 | 1458 | $6,300 | $4.32 | 26d | 1 | 0.12mi |
| 1830 S Ocean Dr #3208 Hallandale Beach, FL | 2.0 | 2.0 | 1458 | $4,500 | $3.09 | 12d | 1 | 0.12mi |
| 1830 S Ocean Dr #4810 Hallandale Beach, FL | 2.0 | 2.0 | 1337 | $5,500 | $4.11 | 22d | 1 | 0.12mi |
| 1830 S Ocean Dr #1706 Hallandale Beach, FL | 2.0 | 2.0 | 1458 | $6,500 | $4.46 | 9d | 1 | 0.12mi |
| 1830 S Ocean Dr #3909 Hallandale Beach, FL | 1.0 | 1.0 | 844 | $5,000 | $5.92 | 26d | 1 | 0.12mi |
| 1830 S Ocean Dr #4712 Hallandale Beach, FL | 1.0 | 1.0 | 844 | $3,950 | $4.68 | 26d | 1 | 0.12mi |
| 1830 S Ocean Dr #4412 Hallandale Beach, FL | 1.0 | 1.0 | 844 | $4,500 | $5.33 | 9d | 1 | 0.12mi |
| 1830 S Ocean Dr #4309 Hallandale Beach, FL | 1.0 | 1.0 | 844 | $3,900 | $4.62 | 26d | 1 | 0.12mi |
| 1830 S Ocean Dr #4212 Hallandale Beach, FL | 1.0 | 1.0 | 844 | $3,800 | $4.50 | 26d | 1 | 0.12mi |
| 1830 S Ocean Dr #1107 Hallandale Beach, FL | 1.0 | 1.0 | 871 | $3,750 | $4.31 | 26d | 1 | 0.12mi |
| 1830 S Ocean Dr #4005 Hallandale Beach, FL | 1.0 | 1.0 | 811 | $4,600 | $5.67 | 26d | 1 | 0.12mi |
| 1830 S Ocean Dr #2108 Hallandale Beach, FL | 2.0 | 2.0 | 1458 | $7,300 | $5.01 | 26d | 1 | 0.12mi |
| 1830 S Ocean Dr #4709 Hallandale Beach, FL | 1.0 | 1.0 | 844 | $3,800 | $4.50 | 5d | 1 | 0.12mi |
HOA detail condo
- Monthly dues
- $945 · $11,340/yr
- Likely covers
- waterpoolgym
- Assessments
- None detected in remarks — confirm with the listing agent.
Listing history 34 events
-
2026-06-21days on market $349,900 Active 97 DOM
-
2026-06-18days on market $349,900 Active 94 DOM
-
2026-06-17days on market $349,900 Active 93 DOM
-
2026-06-16days on market $349,900 Active 92 DOM
-
2026-06-15days on market $349,900 Active 91 DOM
-
2026-06-13pricedays on market $349,900 Active 89 DOM
-
2026-06-09days on market $329,900 Active 85 DOM
-
2026-06-08days on market $329,900 Active 84 DOM
-
2026-06-07days on market $329,900 Active 83 DOM
-
2026-06-04days on market $329,900 Active 80 DOM
-
2026-06-03days on market $329,900 Active 79 DOM
-
2026-06-02days on market $329,900 Active 78 DOM
-
2026-06-02price $329,900 Active 77 DOM
-
2026-06-01days on market $336,900 Active 77 DOM
-
2026-05-31days on market $336,900 Active 76 DOM
-
2026-05-19price $339,900
-
2026-05-14price $339,400
-
2026-05-02price $339,500
-
2026-04-20price $339,900
-
2026-04-14price $344,500
-
2026-04-09price $344,900
-
2026-04-06price $349,900
-
2026-03-23price $352,900
-
2025-09-04$349,900 Active
-
2025-07-22historical
-
2025-06-12price $434,900
-
2025-04-24price $444,900
-
2025-03-29$465,000 Active
-
2025-03-28historical
-
2025-03-11price $465,000
-
2025-02-16price $480,000
-
2025-01-30$495,000 Active
-
2013-02-25soldstatus $117,600
-
1970-03-01soldstatus $29,000
ⓘ Source: listings_history table (triggers on properties + properties_extension) + one-shot
backfill from property_details.listing_events for pre-trigger history.
Tax reassessment forecast FL · Resets to sale price
- Current annual tax
- $7,010 · $584/mo
- Projected year-2 tax
- $7,010 · $584/mo
- Expected delta
- $0/yr ($0/mo · 0.0%)
ⓘ Screening estimate from a state-policy table — verify with the county assessor before closing.
Climate risk First Street
- Flood 8/10 Severe FEMA zone AE · 98% chance over 30 yrs
- Wildfire 1/10 Low
- Heat 10/10 Extreme 6 d/yr ≥104°F today · 22 d/yr by 30 yrs out
- Wind 10/10 Extreme 99% chance of damaging wind over 30 yrs
- Air quality 2/10 Low 1 unhealthy d/yr today · 2 by 30 yrs out
Nearby sold comps map
Loading sold comps map…
Walkable amenities ~0.75 mi
Loading nearby amenities…
Taxation est. · year 1
- Rental income
- $54,966
- − Mortgage interest
- −$19,600
- − Property taxes
- −$7,010
- − Insurance
- −$6,868
- − Repairs & maintenance
- −$4,397
- − Management
- −$4,397
- − HOA
- −$11,340
- − Depreciation
- −$10,179
- Taxable loss
- −$8,825
- Est. tax savings @ 24.0%
- +$2,118
- After-tax cash flow
- $-1,696/yr
For passive investors: Depreciation is non-cash, so a rental often shows a tax loss while cash-flowing — sheltering income. Rental losses are passive: they offset passive income freely, and up to $25,000/yr can offset ordinary (W-2) income if you actively participate and your MAGI is under $100k (phasing out to $0 by $150k); unused losses carry forward. On sale, claimed depreciation is recaptured at up to 25%, and gains may owe capital-gains tax (a 1031 exchange can defer both). Figures are a year-1 estimate at your 24.0% rate — not tax advice; consult a CPA.
Schools (NCES district)
- District
- Broward
- NCES district ID
- 1200180
- Math proficiency
- 42% ▼ -18.00%
- Reading proficiency
- 53% ▼ -5.00%
- Median HH income
- $52,139
- Composite
- 40.88/100
- National rank
- #3621
- State rank
- #46 of 73 in FL
Livability — Hallandale Beach
- Score
- 81/100
- State rank
- #86
- US rank
- #1400
Category grades
Schools grade is shown separately in the Schools card above.
Census & demographics
- Census place
- Hallandale Beach, FL
- County
- Broward County · 1,963,430 people
- City population
- 44,021
- Metro
- Miami-Fort Lauderdale-Pompano Beach, FL
- Population (ZIP)
- 44,502
- Household income
- $52,079
- Rent vs Own
- Severe rent burden
- 3293.0
Population outlook (Broward County) Hauer SSP2
- Today (2025)
- 2,207,033 people
- By 2030
- 2,360,704 · +7.0%
- By 2040
- 2,661,208 · +20.6%
- By 2050
- 2,946,698 · +33.5%
- By 2075
- 3,602,273 · +63.2%
- By 2100
- 3,970,984 · +79.9%
Race, ethnicity, and origin ACS 2023
- Neighborhood character
- Diverse neighborhood (Simpson 0.67)
- Race & ethnicity
- Hispanic / Latino 39% White 39% Two or more races 24% Black 17% Asian 1%
- Hispanic origin (detail)
- Mexican 2% Puerto Rican 3% Cuban 9% Dominican 3% Salvadoran 2%
- Common ancestry
- Scotch-Irish 5% Hispanic 5% Subsaharan African 3%
- Foreign-born
- 51% · Canada, Jamaica, Dominican Republic
- Languages at home
- 38% English-only · Spanish 36% Russian/Polish/Slavic 12% French/Haitian/Cajun 7%
Political lean MEDSL · Broward
- 2024 margin
- D (+17.0) · D 58.0% · R 41.0%
- 2008→2024 swing
- -17.8pp toward R · 2008: 34.7pp · 2024: 17.0pp
- All cycles
- 2024: D+17.0 2020: D+29.8 2016: D+35.0 2012: D+34.9 2008: D+34.7
Not yet ingested
- Civics
- —
Market trends
- HPI YoY
- ▼ -299.13%
- Current HPI
- 329.9081
- Rent YoY
- ▲ 0.43%
- Metro
- Miami-Fort Lauderdale-Pompano Beach, FL
- State GDP YoY
- ▲ 3.28%
- F500 in state
- 36
Industry mix (Fortune 500 HQ in FL)
| Industry | F500 HQs | Revenue |
|---|---|---|
| Industrial Technology | 2 | $29B |
|
||
| Insurance | 2 | $17B |
|
||
| Retail | 1 | $60B |
|
||
| Technology Distribution | 1 | $58B |
|
||
| Homebuilding | 1 | $35B |
|
||
| Technology Manufacturing | 1 | $35B |
|
||
Price history
+1072.1% since first listed19 events — show timeline
- 2026-05-19 Price Changed $339,900 Beaches MLS
- 2026-05-14 Price Changed $339,400 Beaches MLS
- 2026-05-02 Price Changed $339,500 Beaches MLS
- 2026-04-20 Price Changed $339,900 Beaches MLS
- 2026-04-14 Price Changed $344,500 Beaches MLS
- 2026-04-09 Price Changed $344,900 Beaches MLS
- 2026-04-06 Price Changed $349,900 Beaches MLS
- 2026-03-23 Price Changed $352,900 Beaches MLS
- 2025-09-04 Listed $349,900 Beaches MLS
- 2025-07-22 Listing Removed — MARMLS
- 2025-06-12 Price Changed $434,900 MARMLS
- 2025-04-24 Price Changed $444,900 MARMLS
- 2025-03-29 Listed $465,000 MARMLS
- 2025-03-28 Listing Removed — MARMLS
- 2025-03-11 Price Changed $465,000 MARMLS
- 2025-02-16 Price Changed $480,000 MARMLS
- 2025-01-30 Listed $495,000 MARMLS
- 2013-02-25 Sold (Public Records) $117,600 Public Records
- 1970-03-01 Sold (Public Records) $29,000 Public Records
Property tax history
+8.2%/yrLatest (2025): $7,010 · +81.4% YoY. Source: county tax records.
Cash-flow waterfall
monthlySold comps — $/sqft
last 12 mo · ≤1 miLoading sold comps…