609 Prairie St · Pepin, WI
Flood risk 3/10 · Minor
- FEMA flood zone
- X (unshaded)
- Chance of flooding over 30 yrs
- 0.12%
- Est. flood insurance / yr
- $473 – $860
Fire risk 1/10 · Minimal
- Est. fire insurance / yr
- $636 – $1,182
Heat risk 2/10 · Minimal
- Hot days now (above 101°F)
- 7 days/yr
- Hot days in 30 yrs
- 15 days/yr
Wind risk 2/10 · Minimal
- Chance of severe wind over 30 yrs
- —
Air-quality risk 1/10 · Minimal
- Unhealthy air days now
- 0 days/yr
- Unhealthy air days in 30 yrs
- 0 days/yr
Risk factors via First Street. Map © Google.
Why this score? — see what drove the D grade
The composite is a weighted blend of 9 inputs, each scored 0–100. Each bar is that input's sub-score; the figure is the points it added to the 100-point composite (weight × sub-score).
- Appreciation +8.4/10.0
- Cash flow +7.9/30.0
- ARV discount +7.5/15.0
- Schools +4.5/10.0
- Livability +3.3/5.0
- Rent growth +2.5/5.0
- Condition / age +2.5/5.0
- DSCR +2.0/10.0
- 1% rule +1.9/10.0
$149,900
🖨 Deal sheet 📄 Offer letter ✓ Due diligence
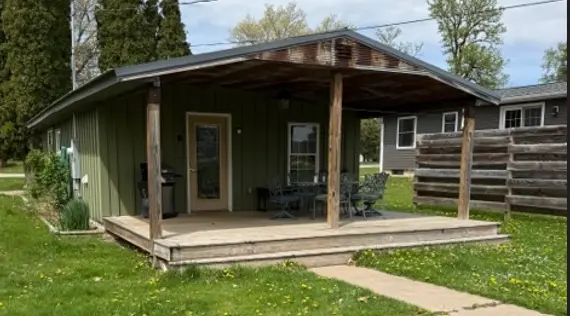
Listing remarks MLS
Totally gutted and remodeled home in walking distance to Lake Pepin provides inexpensive living all on 1 level! Remodeled about 2.5 years ago down to the studs with new electrical, plumbing, siding, roof, windows, doors, insulation, sheetrock, porch - everything! Low maintenance property is ideal for affordable living, rental, weekend retreat and has been successfully used as a VRBO the past 2 years. Single car detached. Convenient location in walking distance to all historic Pepin has to offer!
Key facts
- Spacious yard
- All appliances stay
- 5,662 sq ft lot
Tags
Property features AI
Finance
- Financial info: Annual taxes reported (2025): $1,576
Exterior
- Parking: Other parking
- Utilities: City water connected; City sewer connected; Electric fuel
- Home design: Residential property; Single-story; Slab foundation
- Construction: 640 foundation area
- Exterior features: Lot approximately 0.13 acres (155 x 38); Alley access from 7th Street
Interior
- Bedrooms: 2 bedrooms
- Bathrooms: 1 full bathroom
- Heating & cooling: Baseboard heating; No central cooling
- Interior features: No basement; One level
Neighborhood map
What this means for you Summary
Snapshot
- This is a 2-bed/1.0-bath other listed at $150k.
Deal economics
- At list price, monthly cash flow is $-157 ($-2k/yr) — negative.
- To cash-flow at today's rent, offer at most $122k (18.5% below list).
- To meet the 1% rule (rent ≥ 1% of price), the offer needs to be $104k (30.5% below list).
- Recommended offer: $104k (30.5% below list) — sets the bar for 1% rule.
Location & tenants
- Location reads 66/100 on livability (#468 in WI) — a middle-class / working-renter tenant base. Strengths: cost of living A+, housing A+; Watch: amenities F, commute F, health & safety D-.
- Pepin Area School District (rural): math 50% / reading 50% proficiency, ranked #118 of 426 in WI (top 28%) — acceptable for families but not a draw, mixed tenant base, ~2y average lease.
- Market conditions: 21 active listings in the ZIP; 24 units permitted in Pepin County in 2024 (0 in 5+ unit buildings).
Forward outlook
- In year one you build about $11k of equity ($1k loan paydown + $10k appreciation (6.7% local appreciation)).
- Pepin County population projected at -26% by 2050 — secular population decline; favor cash flow + early exit over multi-decade hold.
- By year 4, paydown + projected appreciation supports a ~$38k cash-out refi (75% LTV) — recoverable capital for the next deal without selling this one.
Negotiation context
- Only 9 days on market — expect competitive offers; lowballing is unlikely to land.
- 2 sale attempts since 8y ago with the ask held roughly flat each time — persistent listings suggest the price (not the market) is what's stuck; bring a comps-based counter.
- Current owner paid $77k; list at $150k implies a 95% gain — meaningful room to come down on a strong offer.
Questions for the listing agent
- What do current leases actually rent for vs. the listed asking? Can we see a recent rent roll and the last 12 months of T-12 income?
- Built in 1960 — when were the roof, HVAC, electrical panel, plumbing, and water heater last replaced?
- Is there a deadline driving the sale (1031 exchange, divorce, estate, relocation)? That informs how much negotiation room exists.
- Schools are B-rated — typically a magnet for longer-tenancy family renters. What's the average tenant stay here, and is there a school-zone premium baked into asking?
- The area grade is low — what's the realistic commute time and amenity access for the typical tenant pool here? Any planned neighborhood developments (good or bad) we should know about?
- What's the average days-on-market for RENTAL listings here right now (not sales)? A rising rental-DOM trend means longer vacancies and softer asking-rent achievability than the comps imply.
- What's the recent tenant-quality profile in this submarket — average credit score on applications, eviction rate, late-payment / NSF rate, and stable-employment percentage? A property-management company in the area should have these aggregated.
- How much new for-sale + rental construction is in the pipeline within 1–3 miles? Heavy new supply typically softens prices + rents 12–24 months out; constrained supply supports both.
Investment metrics
- 1% rule
- 0.69% ✗
- Cap rate
- 5.03%
- Cash-on-cash
- -4.50%
- DSCR
- 0.80
- GRM
- 12.0
CMA / ARV
No comps found within radius.
Projected returns pro-forma
6.73% appreciation · 3.0% rent growth · sell at horizon
- IRR
- 13.5%
- Equity multiple
- 1.95×
- Total profit
- $39,800
- Equity at exit
- $101,205
- IRR
- 13.8%
- Equity multiple
- 3.94×
- Total profit
- $123,437
- Equity at exit
- $189,873
Cash invested: $41,972 (down + closing). Projections, not guarantees.
Landlord ↔ Tenant lean methodology
- Overall (STATE)
- 73 Landlord-Friendly
- State Wisconsin
- 73 Landlord-Friendly · R+2
- County
- — inherits STATE
- City
- — inherits STATE
ZIP-level market 54759
- Home prices YoY
- 2.8%
- Active inventory
- 21
- Price-to-rent
- 12.0×
Monthly cashflow live
- Estimated rent
- $1,041 medium interval (Pro) →
- Mortgage (P&I)
- −$786
- Tax from tax record
- −$131 /mo · $1,576/yr
- Insurance
- −$62
- HOA
- −$0
- Vacancy / Maint / Mgmt
- −$219
- Net cashflow
- $-157
Break-even live
UW: 25.0% down · 7.5% · 30yr · 1.5% tax · 5.0% vac · 8.0% maint · 8.0% mgmt
Financing live
Cash to close
- Down payment
- $37,475
- Closing costs
- $4,497
- Reserves months
- —
- Total cash needed
- —
Loan-product check · same deal, 3 products live
Conventional
25% down · 7.5% · 30yr
- Down + closing
- —
- Monthly P&I
- —
- Monthly cashflow
- —
- DSCR
- —
- Eligible?
- —
Personal DTI + credit; lowest rate.
DSCR
20% down · 8.5% · 30yr
- Down + closing
- —
- Monthly P&I
- —
- Monthly cashflow
- —
- DSCR
- —
- Eligible?
- —
No personal income docs; deal must DSCR.
Hard money
10% down · 12.0% · 12mo
- Down + closing
- —
- Monthly P&I
- —
- Monthly cashflow
- —
- DSCR
- —
- Eligible?
- —
Short-term bridge; refi at stabilization.
Listing history 7 events
-
2026-06-15statusdays on market $149,900 Pending 9 DOM
-
2026-06-13days on market $149,900 Active 8 DOM
-
2026-06-12days on market $149,900 Active 7 DOM
-
2026-06-09days on market $149,900 Active 4 DOM
-
2026-06-08days on market $149,900 Active 3 DOM
-
2026-06-08remarks 198-char remark
-
2026-06-08$149,900 Active 2 DOM
ⓘ Source: listings_history table (triggers on properties + properties_extension) + one-shot
backfill from property_details.listing_events for pre-trigger history.
Tax reassessment forecast WI · Partial reset (capped growth)
- Current annual tax
- $1,576 · $131/mo
- Projected year-2 tax
- $2,175 · $181/mo
- Expected delta
- +$598/yr (+$50/mo · 38.0%)
ⓘ Screening estimate from a state-policy table — verify with the county assessor before closing.
Climate risk First Street
- Flood 3/10 Moderate FEMA zone X (unshaded) · 12% chance over 30 yrs
- Wildfire 1/10 Low
- Heat 2/10 Low 7 d/yr ≥101°F today · 15 d/yr by 30 yrs out
- Wind 2/10 Low
- Air quality 1/10 Low 0 unhealthy d/yr today · 0 by 30 yrs out
Nearby sold comps map
Loading sold comps map…
Walkable amenities ~0.75 mi
Loading nearby amenities…
Taxation est. · year 1
- Rental income
- $12,496
- − Mortgage interest
- −$8,397
- − Property taxes
- −$1,576
- − Insurance
- −$750
- − Repairs & maintenance
- −$1,000
- − Management
- −$1,000
- − Depreciation
- −$4,361
- Taxable loss
- −$4,586
- Est. tax savings @ 24.0%
- +$1,101
- After-tax cash flow
- $-786/yr
For passive investors: Depreciation is non-cash, so a rental often shows a tax loss while cash-flowing — sheltering income. Rental losses are passive: they offset passive income freely, and up to $25,000/yr can offset ordinary (W-2) income if you actively participate and your MAGI is under $100k (phasing out to $0 by $150k); unused losses carry forward. On sale, claimed depreciation is recaptured at up to 25%, and gains may owe capital-gains tax (a 1031 exchange can defer both). Figures are a year-1 estimate at your 24.0% rate — not tax advice; consult a CPA.
Schools (NCES district)
- District
- Pepin Area School District
- NCES district ID
- 5511580
- Math proficiency
- 50% ▲ 5.00%
- Reading proficiency
- 50% ▲ 15.00%
- Median HH income
- $50,585
- Composite
- 44.86/100
- National rank
- #5919
- State rank
- #118 of 426 in WI
Livability — Pepin
- Score
- 66/100
- State rank
- #468
- US rank
- #11870
Category grades
Schools grade is shown separately in the Schools card above.
Census & demographics
- Census place
- Pepin, WI
- Population (ZIP)
- 1,439
Population outlook (Pepin County) Hauer SSP2
- Today (2025)
- 6,829 people
- By 2030
- 6,517 · -4.6%
- By 2040
- 5,781 · -15.3%
- By 2050
- 5,058 · -25.9%
- By 2075
- 3,998 · -41.5%
- By 2100
- 3,218 · -52.9%
Race, ethnicity, and origin ACS 2023
- Neighborhood character
- Predominantly White (96%)
- Race & ethnicity
- White 96% Two or more races 2% Black 1%
- Common ancestry
- Portuguese 14% Romanian 4% Lithuanian 3%
- Foreign-born
- 2% · Canada
- Languages at home
- 98% English-only · Spanish 1% Other Indo-European 1%
Political lean MEDSL · Pepin
- 2024 margin
- Strong R (+29.3) · D 35.0% · R 64.3%
- 2008→2024 swing
- -42.2pp toward R · 2008: 12.9pp · 2024: -29.3pp
- All cycles
- 2024: R+29.3 2020: R+26.4 2016: R+23.6 2012: D+2.2 2008: D+12.9
Not yet ingested
- Civics
- —
Market trends
- HPI YoY
- ▲ 6.73%
- Current HPI
- 245.6875
- Rent YoY
- —
- Metro
- —
- State GDP YoY
- ▲ 2.10%
- F500 in state
- 20
Industry mix (Fortune 500 HQ in WI)
| Industry | F500 HQs | Revenue |
|---|---|---|
| Industrial Machinery | 4 | $23B |
|
||
| Industrial Technology | 2 | $36B |
|
||
| Insurance | 1 | $36B |
|
||
| Professional Services | 1 | $19B |
|
||
| Utilities | 1 | $9B |
|
||
| Consumer Goods | 1 | $3B |
|
||
Price history
+499.6% since first listed6 events — show timeline
- 2026-06-04 Listed $149,900 NORTHSTARMLS as Distributed by MLS Grid
- 2018-05-31 Sold (MLS) $77,000 NORTHSTARMLS as Distributed by MLS Grid
- 2018-05-08 Pending — NORTHSTARMLS as Distributed by MLS Grid
- 2018-03-13 Price Changed $84,900 NORTHSTARMLS as Distributed by MLS Grid
- 2018-02-14 Listed $89,900 NORTHSTARMLS as Distributed by MLS Grid
- 2015-04-30 Sold (Public Records) $25,000 Public Records
Property tax history
+7.4%/yrLatest (2025): $1,576 · +7.0% YoY. Source: county tax records.
Cash-flow waterfall
monthlySold comps — $/sqft
last 12 mo · ≤1 miLoading sold comps…