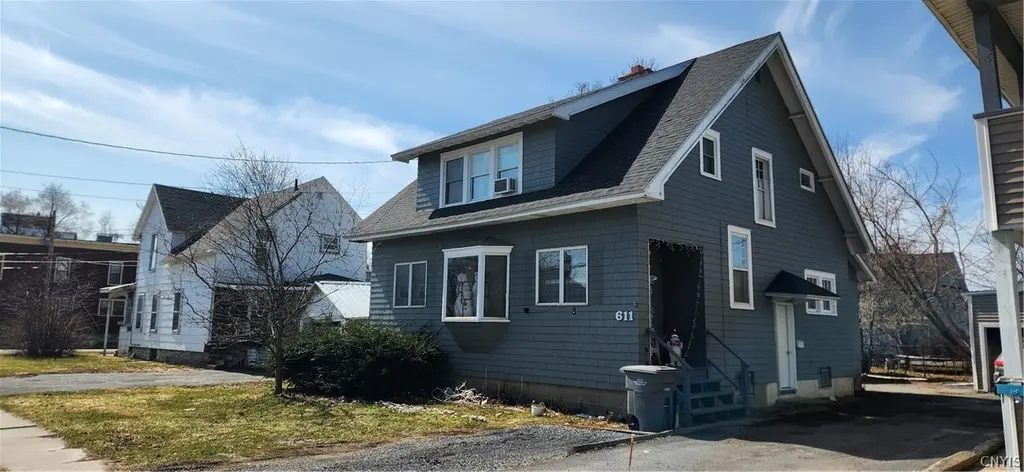
611 Mill St · Watertown, NY
Flood risk 1/10 · Minimal
- FEMA flood zone
- —
- Chance of flooding over 30 yrs
- 0.0%
- Est. flood insurance / yr
- —
Fire risk 2/10 · Minimal
- Est. fire insurance / yr
- $691 – $1,283
Heat risk 2/10 · Minimal
- Hot days now (above 91°F)
- 7 days/yr
- Hot days in 30 yrs
- 15 days/yr
Wind risk 1/10 · Minimal
- Chance of severe wind over 30 yrs
- —
Air-quality risk 2/10 · Minimal
- Unhealthy air days now
- 1 days/yr
- Unhealthy air days in 30 yrs
- 1 days/yr
Risk factors via First Street. Map © Google.
Why this score? — see what drove the C+ grade
The composite is a weighted blend of 9 inputs, each scored 0–100. Each bar is that input's sub-score; the figure is the points it added to the 100-point composite (weight × sub-score).
- Cash flow +21.0/30.0
- ARV discount +15.0/15.0
- DSCR +6.7/10.0
- Rent growth +5.0/5.0
- 1% rule +4.9/10.0
- Schools +3.7/10.0
- Livability +3.4/5.0
- Condition / age +2.5/5.0
- Appreciation +0.0/10.0
$149,900
🖨 Deal sheet 📄 Offer letter ✓ Due diligence
Listing remarks MLS
Discover the perfect blend of historic charm and modern convenience in this delightful 3-bedroom, 1.5-bathroom home. This 1,695 sq. ft. residence, built in 1925, welcomes you with a beautiful wooden staircase and features classic hardwood floors. The spacious layout includes a comfortable living room, a large eat-in kitchen, and the peace of mind that comes with a brand-new furnace. Ideally situated just 15 minutes from Fort Drum and less than 10 minutes from local restaurants and shopping, this property offers an unbeatable combination of character, comfort, and prime location. Don't miss this fantastic opportunity—schedule your showing today
Key facts
- Large eat-in kitchen
- Wooden staircase
- Brand-new furnace
Tags
Neighborhood map
What this means for you Summary
Snapshot
- This is a 3-bed/1.5-bath single-family listed at $150k.
Deal economics
- At list price, monthly cash flow is $212 ($3k/yr) — positive.
- The deal already cash-flows at list — no discount required.
- To meet the 1% rule (rent ≥ 1% of price), the offer needs to be $149k (0.6% below list).
- Recommended offer: $141k (6.0% below list) — sets the bar for market timing.
- Cap rate 8.0% vs local median 6.2% in Watertown — meaningfully above typical; check what's discounted (condition, days-on-market, listing class) to confirm the premium yield is real.
Location & tenants
- Location reads 68/100 on livability (#540 in NY) — a middle-class / working-renter tenant base. Strengths: health & safety A+, cost of living A-, housing A-; Watch: amenities C-, schools D, crime F.
- Watertown City School District (urban): math 34% / reading 54% proficiency, ranked #481 of 590 in NY (top 82%) — families likely to look elsewhere, expect single-tenant / working-renter base with shorter leases.
- Market conditions: Rents rising fast (+10.0%/yr); 223 active listings in the ZIP; 12 comparable units currently listed for rent nearby; rentals lingering (median 44d on market — plan ~5-8 weeks vacancy on turnover, expect pricing pressure); 100% of comp listings sitting > 30 days — soft ceiling on asking rent; 196 units permitted in Jefferson County in 2024 (0 in 5+ unit buildings).
- This rent runs 30% of the median local income ($59k/yr) — at the standard rent-burdened threshold; future hikes will face affordability resistance.
Forward outlook
- Local home prices are declining (-3.0%/yr); year-one equity from $1k of loan paydown is wiped out by about $4k of value loss. Plan a longer hold.
- Jefferson County population projected at -12% by 2050 — secular population decline; favor cash flow + early exit over multi-decade hold.
- At projected returns (-3.0% appreciation + 8.0% rent growth), your $42k cash investment doubles in ~9 years — after that, you're playing with house money.
Negotiation context
- It's been on market 81 days — a 6% lower offer ($141k) is reasonable based on typical stale-listing flexibility.
- 3 sale attempts since 6y ago; this cycle's ask has dropped $15k (9%) from the opening price — seller is motivated, your offer sets the floor, not the list.
- Current owner paid $75k; list at $150k implies a 100% gain — meaningful room to come down on a strong offer.
Risks & watch-outs
- Watch-outs: built in 1925 — expect roof / HVAC / electrical / plumbing capex.
Questions for the listing agent
- It's been on market 81 days. Have you received any prior offers? Is the seller open to a 6% concession, seller financing, or rate buy-down credit?
- Built in 1925 — when were the roof, HVAC, electrical panel, plumbing, and water heater last replaced?
- Why hasn't it sold? Are there any deal-killer items the seller is aware of (foundation, flood, title, zoning, code violations)?
- Is there a deadline driving the sale (1031 exchange, divorce, estate, relocation)? That informs how much negotiation room exists.
- Schools are D-rated, which usually means shorter tenancies and higher turnover. Who's the typical renter profile here, and what's been the actual vacancy rate?
- Crime grade is F in this area — have there been break-ins, vandalism, or insurance claims at this property in the last 3 years? What carrier currently insures it and at what premium?
- What's the average days-on-market for RENTAL listings here right now (not sales)? A rising rental-DOM trend means longer vacancies and softer asking-rent achievability than the comps imply.
- What's the recent tenant-quality profile in this submarket — average credit score on applications, eviction rate, late-payment / NSF rate, and stable-employment percentage? A property-management company in the area should have these aggregated.
- How much new for-sale + rental construction is in the pipeline within 1–3 miles? Heavy new supply typically softens prices + rents 12–24 months out; constrained supply supports both.
Investment metrics
- 1% rule
- 0.99% ✗
- Cap rate
- 7.99%
- Cash-on-cash
- 6.07%
- DSCR
- 1.27
- GRM
- 8.4
CMA / ARV
- ARV (median comp)
- $193,751
- List price
- $149,900
- Delta
- -22.63%
- Verdict
- UNDERPRICED
- Comps
- 20 within 1.0 mi
Show comp detail 12 sales within ~0.75 mi
| Address | Dist | Beds/Ba | Sqft | Sold | Price | $/sf | Match |
|---|---|---|---|---|---|---|---|
| 626 Mill St | 0.04mi | 4/2.0 (+1) | 1,716 (+1%) | 0mo | $75,000 | $44 | 89 |
| 211 W Lynde St | 0.11mi | 3/2.0 | 1,554 (-8%) | 1mo | $190,000 | $122 | 78 |
| 208 Farwell St | 0.25mi | 4/1.5 (+1) | 1,610 (-5%) | 1mo | $162,900 | $101 | 75 |
| 646 Cooper St | 0.11mi | 4/1.0 (+1) | 1,519 (-10%) | 2mo | $195,000 | $128 | 69 |
| 662 Burchard St | 0.57mi | 3/2.0 | 1,668 (-2%) | 2mo | $140,000 | $84 | 67 |
| 244 N Rutland St | 0.66mi | 4/2.5 (+1) | 1,693 (-0%) | 1mo | $233,200 | $138 | 59 |
| 148 E Division St | 0.55mi | 3/2.0 | 1,594 (-6%) | 4mo | $130,000 | $82 | 59 |
| 519 Pearl St | 0.52mi | 4/2.0 (+1) | 1,776 (+5%) | 3mo | $176,000 | $99 | 58 |
| 241 W Main St | 0.20mi | 4/1.0 (+1) | 1,949 (+15%) | 3mo | $126,000 | $65 | 56 |
| 523 Emerson St | 0.50mi | 4/1.0 (+1) | 1,498 (-12%) | 0mo | $47,100 | $31 | 50 |
| 750 Bradley St | 0.64mi | 2/1.0 (-1) | 1,446 (-15%) | 1mo | $173,500 | $120 | 38 |
| 833 W Main St | 0.72mi | 4/2.0 (+1) | 1,865 (+10%) | 6mo | $198,000 | $106 | 38 |
Match score weights: distance 35% · size 25% · config 20% · recency 20%. Top-matched comps best support the ARV.
Projected returns pro-forma
-3.0% appreciation · 8.0% rent growth · sell at horizon
- IRR
- -1.8%
- Equity multiple
- 0.93×
- Total profit
- $-2,927
- Equity at exit
- $22,351
- IRR
- 12.5%
- Equity multiple
- 2.21×
- Total profit
- $50,588
- Equity at exit
- $12,961
Cash invested: $41,972 (down + closing). Projections, not guarantees.
Landlord ↔ Tenant lean methodology
- Overall (STATE)
- 15 Strongly Tenant-Friendly
- State New York
- 15 Strongly Tenant-Friendly · D+10
- County
- — inherits STATE
- City
- — inherits STATE
ZIP-level market 13601
- Home prices YoY
- -5.6%
- Rents YoY
- 10.0%
- Active inventory
- 223
- Price-to-rent
- 8.4×
Monthly cashflow live
- Estimated rent
- $1,489 high interval (Pro) →
- Mortgage (P&I)
- −$786
- Tax from tax record
- −$116 /mo · $1,390/yr
- Insurance
- −$62
- HOA
- −$0
- Vacancy / Maint / Mgmt
- −$313
- Net cashflow
- $212
Break-even live
UW: 25.0% down · 7.5% · 30yr · 1.5% tax · 5.0% vac · 8.0% maint · 8.0% mgmt
Financing live
Cash to close
- Down payment
- $37,475
- Closing costs
- $4,497
- Reserves months
- —
- Total cash needed
- —
Loan-product check · same deal, 3 products live
Conventional
25% down · 7.5% · 30yr
- Down + closing
- —
- Monthly P&I
- —
- Monthly cashflow
- —
- DSCR
- —
- Eligible?
- —
Personal DTI + credit; lowest rate.
DSCR
20% down · 8.5% · 30yr
- Down + closing
- —
- Monthly P&I
- —
- Monthly cashflow
- —
- DSCR
- —
- Eligible?
- —
No personal income docs; deal must DSCR.
Hard money
10% down · 12.0% · 12mo
- Down + closing
- —
- Monthly P&I
- —
- Monthly cashflow
- —
- DSCR
- —
- Eligible?
- —
Short-term bridge; refi at stabilization.
Rent comps 12 comps
| Address | Beds | Baths | Sqft | Rent | $/sqft | DOM | Units | Dist |
|---|---|---|---|---|---|---|---|---|
| 611 Cooper St Watertown, NY | 3.0 | 1.0 | 1190 | $1,495 | $1.26 | 43d | 1 | 0.11mi |
| 377 W Main St Unit 1 Watertown, NY | 3.0 | 1.0 | 1991 | $1,350 | $0.68 | 43d | 1 | 0.34mi |
| 836 Leray St Watertown, NY | 2.0 | 1.0 | 1782 | $1,200 | $0.67 | 43d | 1 | 0.49mi |
| 123 State Pl Watertown, NY | 3.0 | 1.5 | 1500 | $1,750 | $1.17 | 43d | 1 | 0.61mi |
| 328 Clay St Unit 3 Watertown, NY | 3.0 | 2.0 | 1500 | $1,650 | $1.10 | 43d | 1 | 0.68mi |
| 621 Academy St Watertown, NY | 3.0 | 2.0 | 1652 | $1,600 | $0.97 | 43d | 1 | 0.76mi |
| 911 State St Unit 3 Watertown, NY | 3.0 | 1.0 | 1200 | $995 | $0.83 | 43d | 1 | 0.82mi |
| 1029 Gill St Watertown, NY | 3.0 | 1.0 | 1275 | $1,950 | $1.53 | 43d | 1 | 0.85mi |
| 720 Cadwell St Watertown, NY | 2.0 | 1.5 | 1300 | $995 | $0.77 | 43d | 1 | 1.00mi |
| 256 Michigan Ave Watertown, NY | 2.0–4.0 | 1.0–2.5 | 1435 | $1,440 | $1.00 | 43d | 9 | 1.13mi |
| 173 Ely St Watertown, NY | 2.0 | 1.0 | 1940 | $1,150 | $0.59 | 43d | 1 | 1.30mi |
| 207 Wealtha Ave Watertown, NY | 2.0–4.0 | 1.0–2.5 | 1435 | $1,500 | $1.04 | 43d | 9 | 1.49mi |
Listing history 28 events
-
2026-06-19days on market $149,900 Active 81 DOM
-
2026-06-18days on market $149,900 Active 80 DOM
-
2026-06-17days on market $149,900 Active 79 DOM
-
2026-06-16days on market $149,900 Active 78 DOM
-
2026-06-15days on market $149,900 Active 77 DOM
-
2026-06-14days on market $149,900 Active 75 DOM
-
2026-06-12days on market $149,900 Active 74 DOM
-
2026-06-09days on market $149,900 Active 71 DOM
-
2026-06-08days on market $149,900 Active 70 DOM
-
2026-06-07days on market $149,900 Active 69 DOM
-
2026-06-05days on market $149,900 Active 66 DOM
-
2026-06-03days on market $149,900 Active 65 DOM
-
2026-06-03price $149,900 Active 64 DOM
-
2026-06-02days on market $159,900 Active 64 DOM
-
2026-06-01days on market $159,900 Active 63 DOM
-
2026-05-31days on market $159,900 Active 62 DOM
-
2026-05-30days on market $159,900 Active 61 DOM
-
2026-04-24price $159,900 657-char remark
Show marketing remark (657 chars)
Discover the perfect blend of historic charm and modern convenience in this delightful 3-bedroom, 1.5-bathroom home. This 1,695 sq. ft. residence, built in 1925, welcomes you with a beautiful wooden staircase and features classic hardwood floors. The spacious layout includes a comfortable living room, a large eat-in kitchen, and the peace of mind that comes with a brand-new furnace. Ideally situated just 15 minutes from Fort Drum and less than 10 minutes from local restaurants and shopping, this property offers an unbeatable combination of character, comfort, and prime location. Don't miss this fantastic opportunity—schedule your showing today
-
2026-03-30$165,000 Active 657-char remark
Show marketing remark (657 chars)
Discover the perfect blend of historic charm and modern convenience in this delightful 3-bedroom, 1.5-bathroom home. This 1,695 sq. ft. residence, built in 1925, welcomes you with a beautiful wooden staircase and features classic hardwood floors. The spacious layout includes a comfortable living room, a large eat-in kitchen, and the peace of mind that comes with a brand-new furnace. Ideally situated just 15 minutes from Fort Drum and less than 10 minutes from local restaurants and shopping, this property offers an unbeatable combination of character, comfort, and prime location. Don't miss this fantastic opportunity—schedule your showing today
-
2022-05-19soldstatus $75,000
-
2021-12-31historical
-
2021-11-05price $119,000
-
2021-08-02price $139,500
-
2021-06-30$149,500 Active
-
2021-02-23soldstatus $50,000
-
2021-02-19soldstatus $50,000
-
2020-03-09$59,900
-
2002-01-30soldstatus $47,000
ⓘ Source: listings_history table (triggers on properties + properties_extension) + one-shot
backfill from property_details.listing_events for pre-trigger history.
Tax reassessment forecast NY · Partial reset (capped growth)
- Current annual tax
- $1,390 · $116/mo
- Projected year-2 tax
- $1,961 · $163/mo
- Expected delta
- +$572/yr (+$48/mo · 41.2%)
ⓘ Screening estimate from a state-policy table — verify with the county assessor before closing.
Climate risk First Street
- Flood 1/10 Low 0% chance over 30 yrs
- Wildfire 2/10 Low
- Heat 2/10 Low 7 d/yr ≥91°F today · 15 d/yr by 30 yrs out
- Wind 1/10 Low
- Air quality 2/10 Low 1 unhealthy d/yr today · 1 by 30 yrs out
Nearby sold comps map
Loading sold comps map…
Walkable amenities ~0.75 mi
Loading nearby amenities…
Taxation est. · year 1
- Rental income
- $17,871
- − Mortgage interest
- −$8,397
- − Property taxes
- −$1,390
- − Insurance
- −$750
- − Repairs & maintenance
- −$1,430
- − Management
- −$1,430
- − Depreciation
- −$4,361
- Taxable income
- $116
- Est. tax owed @ 24.0%
- −$28
- After-tax cash flow
- $2,519/yr
For passive investors: Depreciation is non-cash, so a rental often shows a tax loss while cash-flowing — sheltering income. Rental losses are passive: they offset passive income freely, and up to $25,000/yr can offset ordinary (W-2) income if you actively participate and your MAGI is under $100k (phasing out to $0 by $150k); unused losses carry forward. On sale, claimed depreciation is recaptured at up to 25%, and gains may owe capital-gains tax (a 1031 exchange can defer both). Figures are a year-1 estimate at your 24.0% rate — not tax advice; consult a CPA.
Schools (NCES district)
- District
- Watertown City School District
- NCES district ID
- 3630120
- Math proficiency
- 34% ▼ -10.00%
- Reading proficiency
- 54% ▲ 12.00%
- Median HH income
- $40,919
- Composite
- 36.86/100
- National rank
- #4551
- State rank
- #481 of 590 in NY
Livability — Watertown
- Score
- 68/100
- State rank
- #540
- US rank
- #9700
Category grades
Schools grade is shown separately in the Schools card above.
Census & demographics
- Census place
- Watertown, NY
- County
- Jefferson County · 47,417 people
- City population
- 36,839
- Metro
- Watertown-Fort Drum, NY
- Population (ZIP)
- 36,839
- Household income
- $58,791
- Rent vs Own
- Severe rent burden
- 1634.0
Population outlook (Jefferson County) Hauer SSP2
- Today (2025)
- 111,748 people
- By 2030
- 109,370 · -2.1%
- By 2040
- 103,828 · -7.1%
- By 2050
- 98,523 · -11.8%
- By 2075
- 91,422 · -18.2%
- By 2100
- 78,214 · -30.0%
Race, ethnicity, and origin ACS 2023
- Neighborhood character
- Predominantly White (82%)
- Race & ethnicity
- White 82% Two or more races 7% Hispanic / Latino 6% Black 4% Asian 2%
- Hispanic origin (detail)
- Mexican 2% Puerto Rican 2%
- Common ancestry
- Lithuanian 7% Romanian 3% Slovak 2%
- Foreign-born
- 4% · Canada
- Languages at home
- 94% English-only · Spanish 3% Other Indo-European 1% German/W. Germanic 1%
Political lean MEDSL · Jefferson
- 2024 margin
- Strong R (+23.6) · D 38.2% · R 61.8%
- 2008→2024 swing
- -18.3pp toward R · 2008: -5.3pp · 2024: -23.6pp
- All cycles
- 2024: R+23.6 2020: R+19.0 2016: R+22.4 2012: R+2.9 2008: R+5.3
Not yet ingested
- Civics
- —
Market trends
- HPI YoY
- ▼ -18.86%
- Current HPI
- 316.636
- Rent YoY
- ▲ 9.96%
- Metro
- Watertown-Fort Drum, NY
- State GDP YoY
- ▲ 2.60%
- F500 in state
- 92
Industry mix (Fortune 500 HQ in NY)
| Industry | F500 HQs | Revenue |
|---|---|---|
| Financial Services | 10 | $950B |
|
||
| Consumer Goods | 9 | $162B |
|
||
| Insurance | 4 | $225B |
|
||
| Telecommunications | 2 | $144B |
|
||
| Pharmaceuticals | 2 | $112B |
|
||
| Media / Entertainment | 2 | $69B |
|
||
Price history
+240.2% since first listed11 events — show timeline
- 2026-04-24 Price Changed $159,900 CNYIS
- 2026-03-30 Listed $165,000 CNYIS
- 2022-05-19 Sold (Public Records) $75,000 Public Records
- 2021-12-31 Listing Removed — CNYIS
- 2021-11-05 Price Changed $119,000 CNYIS
- 2021-08-02 Price Changed $139,500 CNYIS
- 2021-06-30 Listed $149,500 CNYIS
- 2021-02-23 Sold (Public Records) $50,000 Public Records
- 2021-02-19 Sold (MLS) $50,000 CNYIS
- 2020-03-09 Listed $59,900 CNYIS
- 2002-01-30 Sold (Public Records) $47,000 Public Records
Property tax history
+18.2%/yrLatest (2025): $1,390 · +2.0% YoY. Source: county tax records.
Cash-flow waterfall
monthlySold comps — $/sqft
last 12 mo · ≤1 miLoading sold comps…