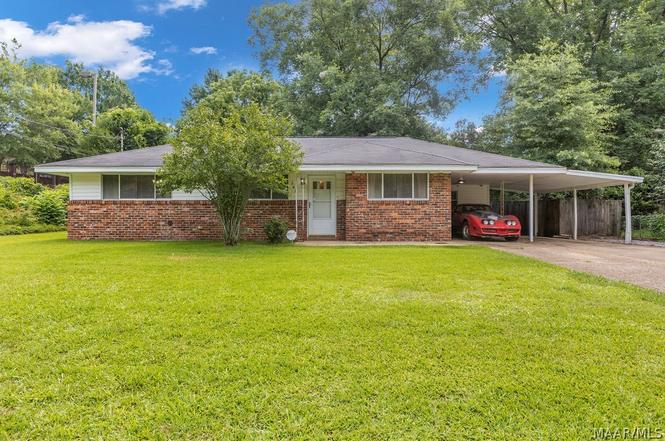
543 Green Ridge Rd · Montgomery, AL
Flood risk 1/10 · Minimal
- FEMA flood zone
- X (unshaded)
- Chance of flooding over 30 yrs
- 0.0%
- Est. flood insurance / yr
- $507 – $1,088
Fire risk 3/10 · Minor
- Est. fire insurance / yr
- $916 – $1,700
Heat risk 7/10 · Major
- Hot days now (above 107°F)
- 7 days/yr
- Hot days in 30 yrs
- 19 days/yr
Wind risk 8/10 · Major
- Chance of severe wind over 30 yrs
- 80.0%
Air-quality risk 3/10 · Minor
- Unhealthy air days now
- 4 days/yr
- Unhealthy air days in 30 yrs
- 4 days/yr
Risk factors via First Street. Map © Google.
Why this score? — see what drove the C- grade
The composite is a weighted blend of 9 inputs, each scored 0–100. Each bar is that input's sub-score; the figure is the points it added to the 100-point composite (weight × sub-score).
- Cash flow +27.4/30.0
- DSCR +9.6/10.0
- 1% rule +6.3/10.0
- Rent growth +3.2/5.0
- Livability +3.2/5.0
- Condition / age +2.5/5.0
- Schools +1.7/10.0
- ARV discount +0.0/15.0
- Appreciation +0.0/10.0
$130,000
🖨 Deal sheet (PDF) 📄 Offer letter ✓ Due diligence
Listing remarks MLS
HUD HOMES SOLD AS IS.
Key facts
- Spacious backyard
- 0.28 acre lot
- 2 parking spots
Tags
Property features AI
Exterior
- Parking: Attached carport and driveway; 2 carport spaces
- Utilities: Electricity available; Public water; Public sewer
- Home design: Single-story brick home; Built by owner (year built source: owner); Slab foundation
- Construction: Brick construction; Slab foundation
- Exterior features: Fully fenced yard; Covered porch; Covered patio; Outdoor storage structure
Interior
- Kitchen: Gas cooktop and gas oven; Electric water heater
- Bedrooms: Total rooms: 7 (includes living spaces)
- Flooring: Carpet; Laminate; Tile
- Bathrooms: 2 full bathrooms
- Heating & cooling: Central heating (gas); Central electric air conditioning
- Interior features: Living room; Carpet, laminate, and tile floors
- Laundry & utility: Electric water heater
Neighborhood map
What this means for you Summary
Snapshot
- This is a 3-bed/2.0-bath single-family listed at $130k.
Deal economics
- At list price, monthly cash flow is $382 ($5k/yr) — positive.
- The deal already cash-flows at list — no discount required.
- Meets the 1% rule at list price ($1k rent vs $130k).
- Cap rate 9.8% vs local median 6.0% in Montgomery — top-decile yield for the area; either an underpriced asset or a hidden risk that comps aren't pricing in. Stress-test before assuming the spread holds.
Location & tenants
- Location reads 65/100 on livability (#138 in AL) — a middle-class / working-renter tenant base. Strengths: cost of living A+, housing A+; Watch: schools C-, employment D, crime F.
- Montgomery County (urban): math 9% / reading 31% proficiency, ranked #106 of 129 in AL (top 82%) — low school quality limits family demand, transient renter base, plan for 1-2y turnover; 70% free/reduced lunch — lower-income household profile, screen leases tightly.
- Market conditions: Rents rising (+2.6%/yr); 207 active listings in the ZIP; 40 comparable units currently listed for rent nearby; rentals at typical pace (median 22d on market — plan ~3-4 weeks tenant-placement turnaround); 42% of comp listings sitting > 30 days — soft ceiling on asking rent; 460 units permitted in Montgomery County in 2024 (37 in 5+ unit buildings).
Forward outlook
- Local home prices are declining (-3.0%/yr); year-one equity from $899 of loan paydown is wiped out by about $4k of value loss. Plan a longer hold.
- Montgomery County population projected to shrink 8% by 2050 — rents likely to lag national; underwrite the cash flow, not the appreciation.
- At projected returns (-3.0% appreciation + 2.6% rent growth), your $36k cash investment doubles in ~10 years — after that, you're playing with house money.
Negotiation context
- Only 8 days on market — expect competitive offers; lowballing is unlikely to land.
- 5 sale attempts since 22y ago with the ask held roughly flat each time — persistent listings suggest the price (not the market) is what's stuck; bring a comps-based counter.
- Current owner paid $80k; list at $130k implies a 62% gain — meaningful room to come down on a strong offer.
Risks & watch-outs
- Watch-outs: built in 1956 — expect roof / HVAC / electrical / plumbing capex.
- Climate carrying-cost: severe wind risk, 80% chance of damaging wind over 30y; extreme-heat days projected 7→19/yr by 2055 (HVAC capex compounding) — expect insurance premiums to compound above CPI over the hold.
Questions for the listing agent
- Built in 1956 — when were the roof, HVAC, electrical panel, plumbing, and water heater last replaced?
- Is there a deadline driving the sale (1031 exchange, divorce, estate, relocation)? That informs how much negotiation room exists.
- Crime grade is F in this area — have there been break-ins, vandalism, or insurance claims at this property in the last 3 years? What carrier currently insures it and at what premium?
- What's the average days-on-market for RENTAL listings here right now (not sales)? A rising rental-DOM trend means longer vacancies and softer asking-rent achievability than the comps imply.
- What's the recent tenant-quality profile in this submarket — average credit score on applications, eviction rate, late-payment / NSF rate, and stable-employment percentage? A property-management company in the area should have these aggregated.
- How much new for-sale + rental construction is in the pipeline within 1–3 miles? Heavy new supply typically softens prices + rents 12–24 months out; constrained supply supports both.
Investment metrics
- 1% rule
- 1.13% ✓
- Cap rate
- 9.82%
- Cash-on-cash
- 12.58%
- DSCR
- 1.56
- GRM
- 7.4
CMA / ARV
- ARV (on-the-fly)
- $105,702
- Comps found
- 12
Show comp detail 12 sales within ~0.75 mi
| Address | Dist | Beds/Ba | Sqft | Sold | Price | $/sf | Match |
|---|---|---|---|---|---|---|---|
| 664 Joryne Dr | 0.43mi | 3/2.0 | 1,363 (+2%) | 1mo | $129,000 | $95 | 76 |
| 3602 Little John Dr | 0.24mi | 3/1.0 | 1,286 (-4%) | 4mo | $65,000 | $51 | 75 |
| 508 Forest Hills Dr | 0.33mi | 3/2.0 | 1,267 (-5%) | 1mo | $55,500 | $44 | 75 |
| 3 Kent St | 0.65mi | 3/2.0 | 1,305 (-2%) | 1mo | $102,750 | $79 | 65 |
| 403 Nottingham Rd | 0.37mi | 3/1.0 | 1,450 (+8%) | 0mo | $39,901 | $28 | 64 |
| 3700 Ramos Ct | 0.51mi | 3/2.0 | 1,232 (-8%) | 3mo | $134,400 | $109 | 60 |
| 45 Kent St | 0.73mi | 3/1.0 | 1,338 (0%) | 3mo | $94,000 | $70 | 60 |
| 47 Salem Dr | 0.69mi | 3/2.0 | 1,419 (+6%) | 3mo | $162,500 | $115 | 56 |
| 3518 N Wareingwood Dr | 0.75mi | 3/1.0 | 1,269 (-5%) | 3mo | $119,500 | $94 | 50 |
| 968 Karen Rd | 0.69mi | 3/2.0 | 1,221 (-9%) | 4mo | $92,000 | $75 | 50 |
| 887 Greg Dr | 0.71mi | 3/2.0 | 1,492 (+12%) | 2mo | $150,000 | $101 | 46 |
| 137 Oak Forest Dr | 0.58mi | 2/1.0 (-1) | 1,183 (-12%) | 0mo | $47,000 | $40 | 44 |
Match score weights: distance 35% · size 25% · config 20% · recency 20%. Top-matched comps best support the ARV.
Projected returns pro-forma
-3.0% appreciation · 2.65% rent growth · sell at horizon
- IRR
- 1.9%
- Equity multiple
- 1.07×
- Total profit
- $2,674
- Equity at exit
- $19,383
- IRR
- 11.2%
- Equity multiple
- 1.86×
- Total profit
- $31,316
- Equity at exit
- $11,240
Cash invested: $36,400 (down + closing). Projections, not guarantees.
Landlord ↔ Tenant lean methodology
- Overall (STATE)
- 90 Strongly Landlord-Friendly
- State Alabama
- 90 Strongly Landlord-Friendly · R+15
- County
- — inherits STATE
- City
- — inherits STATE
ZIP-level market 36109
- Home prices YoY
- -20.1%
- Rents YoY
- 2.6%
- Active inventory
- 207
- Price-to-rent
- 7.4×
Monthly cashflow live
- Estimated rent
- $1,467 high interval (Pro) →
- Mortgage (P&I)
- −$682
- Tax from tax record
- −$41 /mo · $497/yr
- Insurance
- −$54
- HOA
- −$0
- Vacancy / Maint / Mgmt
- −$308
- Net cashflow
- $382
Break-even live
Sensitivity live
| Price | -10% $455 | -5% $418 | +0% $382 | +5% $345 | +10% $308 |
|---|---|---|---|---|---|
| Rent | -10% $266 | -5% $324 | +0% $382 | +5% $440 | +10% $498 |
| Rate | -1.0pp $447 | -0.5pp $415 | base $382 | +0.5pp $348 | +1.0pp $314 |
UW: 25.0% down · 7.5% · 30yr · 1.5% tax · 5.0% vac · 8.0% maint · 8.0% mgmt
Financing live
Cash to close
- Down payment
- $32,500
- Closing costs
- $3,900
- Reserves months
- —
- Total cash needed
- —
Loan-product check · same deal, 3 products live
Conventional
25% down · 7.5% · 30yr
- Down + closing
- —
- Monthly P&I
- —
- Monthly cashflow
- —
- DSCR
- —
- Eligible?
- —
Personal DTI + credit; lowest rate.
DSCR
20% down · 8.5% · 30yr
- Down + closing
- —
- Monthly P&I
- —
- Monthly cashflow
- —
- DSCR
- —
- Eligible?
- —
No personal income docs; deal must DSCR.
Hard money
10% down · 12.0% · 12mo
- Down + closing
- —
- Monthly P&I
- —
- Monthly cashflow
- —
- DSCR
- —
- Eligible?
- —
Short-term bridge; refi at stabilization.
Rent comps 40 comps
| Address | Beds | Baths | Sqft | Rent | $/sqft | DOM | Units | Dist |
|---|---|---|---|---|---|---|---|---|
| 3309 Hillcrest Ln Unit 1043908P Montgomery, AL | 4.0 | 2.0 | 1625 | $2,885 | $1.78 | 22d | 1 | 0.15mi |
| 3233 Hillcrest Ln Montgomery, AL | 3.0 | 2.0 | 1278 | $1,395 | $1.09 | 22d | 1 | 0.20mi |
| 3602 Little John Dr Montgomery, AL | 4.0 | 1.0 | 1286 | $1,400 | $1.09 | 22d | 1 | 0.22mi |
| 3515 Cottonwood Dr Montgomery, AL | 3.0 | 1.5 | 1246 | $1,350 | $1.08 | 44d | 1 | 0.27mi |
| 3334 Cottonwood Dr Montgomery, AL | 3.0 | 2.0 | 1025 | $1,295 | $1.26 | 14d | 1 | 0.29mi |
| 3329 Vermont Dr Montgomery, AL | 3.0 | 1.5 | 1465 | $1,395 | $0.95 | 14d | 1 | 0.30mi |
| 239 Forest Hills Dr Montgomery, AL | 4.0 | 1.5 | 1500 | $1,450 | $0.97 | 22d | 1 | 0.30mi |
| 118 Nottingham Ct Montgomery, AL | 3.0 | 2.0 | 1344 | $1,275 | $0.95 | 44d | 1 | 0.31mi |
| 401 Ridgewood Ln Montgomery, AL | 3.0 | 2.0 | 1513 | $1,195 | $0.79 | 22d | 1 | 0.31mi |
| 3319 Willow Lane Dr Montgomery, AL | 3.0 | 2.0 | 1032 | $1,200 | $1.16 | 44d | 1 | 0.39mi |
| 688 Joryne Dr Montgomery, AL | 3.0 | 2.0 | 1500 | $1,200 | $0.80 | 44d | 1 | 0.42mi |
| 926 Green Ridge Ct Montgomery, AL | 3.0 | 2.0 | 1665 | $1,381 | $0.83 | 14d | 1 | 0.49mi |
| 817 Dumont Dr Montgomery, AL | 3.0 | 2.0 | 1635 | $1,800 | $1.10 | 14d | 1 | 0.52mi |
| 3692 Fairfield Dr Montgomery, AL | 3.0 | 2.0 | 1524 | $1,400 | $0.92 | 22d | 1 | 0.56mi |
| 860 Greg Dr Montgomery, AL | 3.0 | 2.0 | 1400 | $1,295 | $0.93 | 14d | 1 | 0.58mi |
| 844 Sir Michael Dr Montgomery, AL | 4.0 | 2.0 | 1502 | $1,650 | $1.10 | 44d | 1 | 0.59mi |
| 122 Oak Forest Dr Montgomery, AL | 3.0 | 1.0 | 1092 | $975 | $0.89 | 22d | 1 | 0.64mi |
| 311 Bradley Dr Montgomery, AL | 3.0 | 1.0 | 1104 | $825 | $0.75 | 44d | 1 | 0.67mi |
| 895 Greg Dr Montgomery, AL | 3.0 | 2.0 | 1489 | $1,600 | $1.07 | 14d | 1 | 0.69mi |
| 908 Greg Dr Montgomery, AL | 3.0 | 1.0 | 1520 | $1,100 | $0.72 | 22d | 1 | 0.70mi |
| 3456 Harrison Rd Montgomery, AL | 3.0 | 1.0 | 1008 | $1,300 | $1.29 | 44d | 1 | 0.71mi |
| 67 Holliday Dr Montgomery, AL | 3.0 | 1.0 | 1156 | $1,200 | $1.04 | 44d | 1 | 0.72mi |
| 18 Oak Forest Dr Montgomery, AL | 3.0 | 2.0 | 1580 | $1,050 | $0.66 | 22d | 1 | 0.74mi |
| 3323 Bedford Ln Montgomery, AL | 3.0 | 2.0 | 1134 | $1,200 | $1.06 | 22d | 1 | 0.76mi |
| 107 Dalraida Rd Unit A Montgomery, AL | 3.0 | 2.0 | 1237 | $1,200 | $0.97 | 44d | 1 | 0.77mi |
| 15 Bradley Dr Montgomery, AL | 3.0 | 2.0 | 1365 | $1,500 | $1.10 | 22d | 1 | 0.77mi |
| 3359 Bedford Ln Montgomery, AL | 4.0 | 2.0 | 1786 | $1,600 | $0.90 | 14d | 1 | 0.77mi |
| 3346 Bedford Ln Montgomery, AL | 3.0 | 1.0 | 1134 | $1,295 | $1.14 | 14d | 1 | 0.77mi |
| 7 Bradley Dr Montgomery, AL | 3.0 | 2.0 | 1529 | $1,500 | $0.98 | 14d | 1 | 0.79mi |
| 167 E Salem Dr Montgomery, AL | 3.0 | 2.0 | 1700 | $1,050 | $0.62 | 44d | 1 | 0.80mi |
| 7 Calhoun Rd Unit B Montgomery, AL | 2.0 | 1.0 | 961 | $850 | $0.88 | 44d | 1 | 0.80mi |
| 1117 Karen Rd Montgomery, AL | 3.0 | 1.0 | 1308 | $1,195 | $0.91 | 44d | 1 | 0.83mi |
| 186 E Salem Dr Montgomery, AL | 3.0 | 1.0 | 1040 | $1,195 | $1.15 | 22d | 1 | 0.84mi |
| 200 Eton Rd Montgomery, AL | 3.0 | 1.5 | 1500 | $895 | $0.60 | 14d | 1 | 0.85mi |
| 3105 Pelzer Ave Montgomery, AL | 4.0 | 2.0 | 1605 | $1,425 | $0.89 | 44d | 1 | 0.86mi |
| 3136 Harrison Rd Montgomery, AL | 3.0 | 1.5 | 1355 | $1,025 | $0.76 | 44d | 1 | 0.88mi |
| 108 Calhoun Rd Unit 108B Montgomery, AL | 2.0 | 1.0 | 1350 | $750 | $0.56 | 44d | 1 | 0.91mi |
| 1154 Lakewood Dr Montgomery, AL | 3.0 | 2.0 | 1066 | $1,350 | $1.27 | 44d | 1 | 0.91mi |
| 3318 Habersham Rd Montgomery, AL | 3.0 | 2.0 | 1134 | $1,250 | $1.10 | 14d | 1 | 0.96mi |
| 4046 Camellia Dr Unit 1 Montgomery, AL | 3.0 | 2.0 | 1500 | $1,200 | $0.80 | 44d | 1 | 0.98mi |
Listing history 7 events
-
2026-06-18days on market $130,000 Active 8 DOM
-
2026-06-17days on market $130,000 Active 7 DOM
-
2026-06-16days on market $130,000 Active 6 DOM
-
2026-06-15days on market $130,000 Active 5 DOM
-
2026-06-14days on market $130,000 Active 3 DOM
-
2026-06-13remarks 583-char remark
-
2026-06-13$130,000 Active 2 DOM
ⓘ Source: listings_history table (triggers on properties + properties_extension) + one-shot
backfill from property_details.listing_events for pre-trigger history.
Tax reassessment forecast AL · Resets to sale price
- Current annual tax
- $497 · $41/mo
- Projected year-2 tax
- $533 · $44/mo
- Expected delta
- +$36/yr (+$3/mo · 7.2%)
ⓘ Screening estimate from a state-policy table — verify with the county assessor before closing.
Climate risk First Street
- Flood 1/10 Low FEMA zone X (unshaded) · 0% chance over 30 yrs
- Wildfire 3/10 Moderate
- Heat 7/10 Severe 7 d/yr ≥107°F today · 19 d/yr by 30 yrs out
- Wind 8/10 Severe 80% chance of damaging wind over 30 yrs
- Air quality 3/10 Moderate 4 unhealthy d/yr today · 4 by 30 yrs out
Nearby sold comps map
Loading sold comps map…
Walkable amenities ~0.75 mi
Loading nearby amenities…
Taxation est. · year 1
- Rental income
- $17,605
- − Mortgage interest
- −$7,282
- − Property taxes
- −$497
- − Insurance
- −$650
- − Repairs & maintenance
- −$1,408
- − Management
- −$1,408
- − Depreciation
- −$3,782
- Taxable income
- $2,577
- Est. tax owed @ 24.0%
- −$618
- After-tax cash flow
- $3,961/yr
For passive investors: Depreciation is non-cash, so a rental often shows a tax loss while cash-flowing — sheltering income. Rental losses are passive: they offset passive income freely, and up to $25,000/yr can offset ordinary (W-2) income if you actively participate and your MAGI is under $100k (phasing out to $0 by $150k); unused losses carry forward. On sale, claimed depreciation is recaptured at up to 25%, and gains may owe capital-gains tax (a 1031 exchange can defer both). Figures are a year-1 estimate at your 24.0% rate — not tax advice; consult a CPA.
Schools (NCES district)
- District
- Montgomery County
- NCES district ID
- 0102430
- Math proficiency
- 9% ▼ -21.00%
- Reading proficiency
- 31% ▼ -1.00%
- Median HH income
- $43,902
- Composite
- 17.24/100
- National rank
- #9093
- State rank
- #106 of 129 in AL
Livability — Montgomery
- Score
- 65/100
- State rank
- #138
- US rank
- #13416
Category grades
Schools grade is shown separately in the Schools card above.
Census & demographics
- Census place
- Montgomery, AL
- County
- Montgomery County · 190,016 people
- City population
- 175,913
- Metro
- Montgomery, AL
- Population (ZIP)
- 23,581
- Household income
- $59,193
- Rent vs Own
- Severe rent burden
- 1039.0
Population outlook (Montgomery County) Hauer SSP2
- Today (2025)
- 224,008 people
- By 2030
- 221,460 · -1.1%
- By 2040
- 214,179 · -4.4%
- By 2050
- 204,912 · -8.5%
- By 2075
- 177,821 · -20.6%
- By 2100
- 145,134 · -35.2%
Race, ethnicity, and origin ACS 2023
- Neighborhood character
- Diverse neighborhood (Simpson 0.60)
- Race & ethnicity
- White 49% Black 39% Hispanic / Latino 8% Two or more races 4%
- Hispanic origin (detail)
- Mexican 4%
- Common ancestry
- Slovak 2% Lithuanian 1% Serbian 1%
- Foreign-born
- 4% · Canada, South Korea
- Languages at home
- 94% English-only · Spanish 5%
Political lean MEDSL · Montgomery
- 2024 margin
- Solid D (+30.7) · D 64.8% · R 34.1% · Other 1.1%
- 2008→2024 swing
- +11.5pp toward D · 2008: 19.2pp · 2024: 30.7pp
- All cycles
- 2024: D+30.7 2020: D+31.5 2016: D+26.2 2012: D+24.3 2008: D+19.2
Not yet ingested
- Civics
- —
Market trends
- HPI YoY
- ▼ -37.64%
- Current HPI
- 149.3867
- Rent YoY
- ▲ 2.65%
- Metro
- Montgomery, AL
- State GDP YoY
- ▲ 2.94%
- F500 in state
- 4
Industry mix (Fortune 500 HQ in AL)
| Industry | F500 HQs | Revenue |
|---|---|---|
| Financial Services | 1 | $8B |
|
||
| Healthcare | 1 | $5B |
|
||
Price history
+62.7% since first listed9 events — show timeline
- 2026-06-10 Listed $130,000 MAAR
- 2010-05-17 Sold (Public Records) $80,051 Public Records
- 2010-05-11 Sold (MLS) $80,000 MAAR
- 2010-03-03 Listed $82,000 MAAR
- 2009-01-09 Sold (MLS) $85,000 MAAR
- 2008-10-10 Listed $89,900 MAAR
- 2004-10-25 Sold (MLS) $70,000 MAAR
- 2004-09-08 Listed $74,900 MAAR
- 2004-01-06 Listed $79,900 MAAR
Property tax history
+5.0%/yrLatest (2025): $497 · +2.8% YoY. Source: county tax records.
Cash-flow waterfall
monthlySold comps — $/sqft
last 12 mo · ≤1 miLoading sold comps…