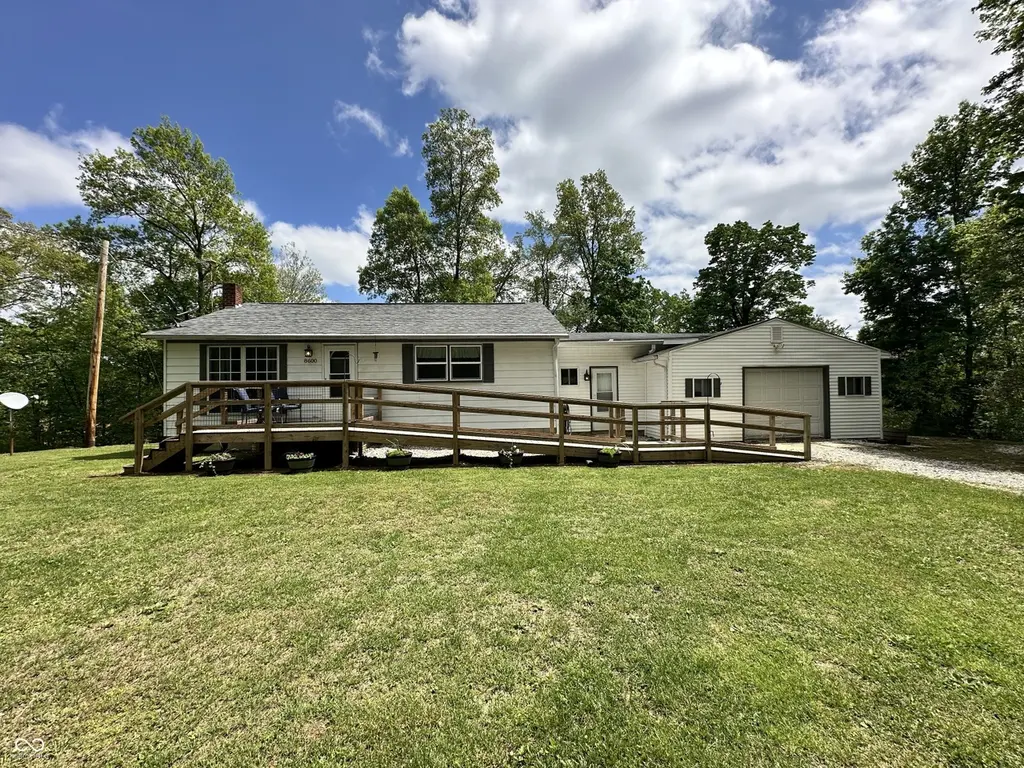
8600 Owl Holw · Poland, IN
Flood risk 1/10 · Minimal
- FEMA flood zone
- X (unshaded)
- Chance of flooding over 30 yrs
- 0.0%
- Est. flood insurance / yr
- $473 – $860
Fire risk 1/10 · Minimal
- Est. fire insurance / yr
- $717 – $1,331
Heat risk 3/10 · Minor
- Hot days now (above 103°F)
- 7 days/yr
- Hot days in 30 yrs
- 18 days/yr
Wind risk 2/10 · Minimal
- Chance of severe wind over 30 yrs
- 1.0%
Air-quality risk 2/10 · Minimal
- Unhealthy air days now
- 1 days/yr
- Unhealthy air days in 30 yrs
- 2 days/yr
Risk factors via First Street. Map © Google.
Why this score? — see what drove the D grade
The composite is a weighted blend of 9 inputs, each scored 0–100. Each bar is that input's sub-score; the figure is the points it added to the 100-point composite (weight × sub-score).
- ARV discount +15.0/15.0
- Appreciation +10.0/10.0
- Cash flow +4.5/30.0
- Schools +3.2/10.0
- Rent growth +2.5/5.0
- Livability +2.5/5.0
- Condition / age +2.5/5.0
- 1% rule +0.0/10.0
- DSCR +0.0/10.0
$215,000
🖨 Deal sheet (PDF) 📄 Offer letter ✓ Due diligence
Listing remarks
Welcome to your own private slice of the countryside, where modern updates meet peaceful surroundings. This beautifully remodeled 2 bedroom, 1 bath home is truly move in ready and packed with upgrades that give you confidence and comfort from day one. Inside, you will find a fresh, updated interior with thoughtful finishes throughout. Nearly everything has been replaced within the last five years, and a brand new furnace adds even more value and peace of mind. The layout is warm and inviting, offering a cozy yet functional space that is easy to maintain and perfect for everyday living or a weekend retreat. One of the standout features of this home is the full unfinished walk-out basement, o
Key facts
- Attached garage
- High-speed internet
- 3.31 acre lot
Tags
Property features AI
Finance
- Other: Property sits on approximately 3.31 acres
Exterior
- Parking: Attached garage with garage door opener (1 garage space)
- Utilities: Private water; Septic
- Home design: Single family residence; One story
- Construction: Aluminum siding; Vinyl siding; Block foundation
- Exterior features: Deck; Porch; Exterior lighting; Fire pit; Exterior handicap accessible
Interior
- Kitchen: Gas oven; Microwave; Refrigerator; Eat-in kitchen layout
- Bedrooms: 2 bedrooms on the main level (sizes approx. 12x13 and 12x13)
- Flooring: Luxury vinyl plank in kitchen
- Bathrooms: 1 full bathroom (on main level)
- Heating & cooling: Forced air heating (Propane); Central air conditioning
- Interior features: Attic access; Eat-in kitchen
- Laundry & utility: Washer; Dryer; Electric water heater
Neighborhood map
What this means for you Summary
Snapshot
- This is a 3-bed/1.5-bath single-family listed at $215k.
Deal economics
- At list price, monthly cash flow is $-553 ($-7k/yr) — negative.
- To cash-flow at today's rent, offer at most $117k (45.4% below list).
- To meet the 1% rule (rent ≥ 1% of price), the offer needs to be $97k (55.1% below list).
- Recommended offer: $97k (55.1% below list) — sets the bar for 1% rule.
Location & tenants
- Location reads: area grade D — affects rentability + tenant quality, not the cash-flow math above.
- Cloverdale Community Schools (rural): math 36% / reading 40% proficiency, ranked #167 of 301 in IN (top 56%) — families likely to look elsewhere, expect single-tenant / working-renter base with shorter leases.
- Market conditions: 29 active listings in the ZIP; 120 units permitted in Owen County in 2024 (0 in 5+ unit buildings).
Forward outlook
- In year one you build about $23k of equity ($1k loan paydown + $22k appreciation (10.0% local appreciation)).
- Owen County population projected at -30% by 2050 — secular population decline; favor cash flow + early exit over multi-decade hold.
- By year 2, paydown + projected appreciation supports a ~$37k cash-out refi (75% LTV) — recoverable capital for the next deal without selling this one.
Negotiation context
- Only 6 days on market — expect competitive offers; lowballing is unlikely to land.
- 5 sale attempts since 23y ago with the ask held roughly flat each time — persistent listings suggest the price (not the market) is what's stuck; bring a comps-based counter.
- Current owner paid $175k; 23% above their basis — modest negotiation headroom, anchor on the comps not their cost.
Questions for the listing agent
- What do current leases actually rent for vs. the listed asking? Can we see a recent rent roll and the last 12 months of T-12 income?
- Built in 1974 — when were the roof, HVAC, electrical panel, plumbing, and water heater last replaced?
- Is there a deadline driving the sale (1031 exchange, divorce, estate, relocation)? That informs how much negotiation room exists.
- The area grade is low — what's the realistic commute time and amenity access for the typical tenant pool here? Any planned neighborhood developments (good or bad) we should know about?
- What's the average days-on-market for RENTAL listings here right now (not sales)? A rising rental-DOM trend means longer vacancies and softer asking-rent achievability than the comps imply.
- What's the recent tenant-quality profile in this submarket — average credit score on applications, eviction rate, late-payment / NSF rate, and stable-employment percentage? A property-management company in the area should have these aggregated.
- How much new for-sale + rental construction is in the pipeline within 1–3 miles? Heavy new supply typically softens prices + rents 12–24 months out; constrained supply supports both.
Investment metrics
- 1% rule
- 0.45% ✗
- Cap rate
- 3.21%
- Cash-on-cash
- -11.02%
- DSCR
- 0.51
- GRM
- 18.5
CMA / ARV
- ARV (median comp)
- $403,735
- List price
- $215,000
- Delta
- -45.53%
- Verdict
- UNDERPRICED
- Comps
- 3 within 2.0 mi
Projected returns pro-forma
10.0% appreciation · 3.0% rent growth · sell at horizon
- IRR
- 16.5%
- Equity multiple
- 2.36×
- Total profit
- $81,800
- Equity at exit
- $193,689
- IRR
- 15.8%
- Equity multiple
- 5.46×
- Total profit
- $268,395
- Equity at exit
- $417,698
Cash invested: $60,200 (down + closing). Projections, not guarantees.
Landlord ↔ Tenant lean methodology
- Overall (STATE)
- 90 Strongly Landlord-Friendly
- State Indiana
- 90 Strongly Landlord-Friendly · R+11
- County
- — inherits STATE
- City
- — inherits STATE
ZIP-level market 47868
- Home prices YoY
- 9.8%
- Active inventory
- 29
- Price-to-rent
- 18.5×
Monthly cashflow live
- Estimated rent
- $966 medium interval (Pro) →
- Mortgage (P&I)
- −$1,127
- Tax from tax record
- −$99 /mo · $1,185/yr
- Insurance
- −$90
- HOA
- −$0
- Vacancy / Maint / Mgmt
- −$203
- Net cashflow
- $-553
Break-even live
Sensitivity live
| Price | -10% $-431 | -5% $-492 | +0% $-553 | +5% $-614 | +10% $-674 |
|---|---|---|---|---|---|
| Rent | -10% $-629 | -5% $-591 | +0% $-553 | +5% $-515 | +10% $-476 |
| Rate | -1.0pp $-444 | -0.5pp $-498 | base $-553 | +0.5pp $-608 | +1.0pp $-665 |
UW: 25.0% down · 7.5% · 30yr · 1.5% tax · 5.0% vac · 8.0% maint · 8.0% mgmt
Financing live
Cash to close
- Down payment
- $53,750
- Closing costs
- $6,450
- Reserves months
- —
- Total cash needed
- —
Loan-product check · same deal, 3 products live
Conventional
25% down · 7.5% · 30yr
- Down + closing
- —
- Monthly P&I
- —
- Monthly cashflow
- —
- DSCR
- —
- Eligible?
- —
Personal DTI + credit; lowest rate.
DSCR
20% down · 8.5% · 30yr
- Down + closing
- —
- Monthly P&I
- —
- Monthly cashflow
- —
- DSCR
- —
- Eligible?
- —
No personal income docs; deal must DSCR.
Hard money
10% down · 12.0% · 12mo
- Down + closing
- —
- Monthly P&I
- —
- Monthly cashflow
- —
- DSCR
- —
- Eligible?
- —
Short-term bridge; refi at stabilization.
Listing history 12 events
-
2026-06-18days on market $215,000 Active 6 DOM
-
2026-06-17days on market $215,000 Active 5 DOM
-
2026-06-16days on market $215,000 Active 4 DOM
-
2026-06-15days on market $215,000 Active 3 DOM
-
2026-06-13pricestatusdays on market $215,000 Active 1 DOM
-
2026-05-05status Pending 1871-char remark
-
2026-04-29$219,900 Active 1871-char remark
-
2024-05-14soldstatus $175,000
-
2013-12-31historical
-
2013-09-05$75,000
-
2003-10-15soldstatus $86,000
-
2003-08-14$90,500
ⓘ Source: listings_history table (triggers on properties + properties_extension) + one-shot
backfill from property_details.listing_events for pre-trigger history.
Tax reassessment forecast IN · Partial reset (capped growth)
- Current annual tax
- $1,185 · $99/mo
- Projected year-2 tax
- $1,506 · $126/mo
- Expected delta
- +$321/yr (+$27/mo · 27.1%)
ⓘ Screening estimate from a state-policy table — verify with the county assessor before closing.
Climate risk First Street
- Flood 1/10 Low FEMA zone X (unshaded) · 0% chance over 30 yrs
- Wildfire 1/10 Low
- Heat 3/10 Moderate 7 d/yr ≥103°F today · 18 d/yr by 30 yrs out
- Wind 2/10 Low 100% chance of damaging wind over 30 yrs
- Air quality 2/10 Low 1 unhealthy d/yr today · 2 by 30 yrs out
Nearby sold comps map
Loading sold comps map…
Walkable amenities ~0.75 mi
Loading nearby amenities…
Taxation est. · year 1
- Rental income
- $11,592
- − Mortgage interest
- −$12,043
- − Property taxes
- −$1,185
- − Insurance
- −$1,075
- − Repairs & maintenance
- −$927
- − Management
- −$927
- − Depreciation
- −$6,255
- Taxable loss
- −$10,821
- Est. tax savings @ 24.0%
- +$2,597
- After-tax cash flow
- $-4,036/yr
For passive investors: Depreciation is non-cash, so a rental often shows a tax loss while cash-flowing — sheltering income. Rental losses are passive: they offset passive income freely, and up to $25,000/yr can offset ordinary (W-2) income if you actively participate and your MAGI is under $100k (phasing out to $0 by $150k); unused losses carry forward. On sale, claimed depreciation is recaptured at up to 25%, and gains may owe capital-gains tax (a 1031 exchange can defer both). Figures are a year-1 estimate at your 24.0% rate — not tax advice; consult a CPA.
Schools (NCES district)
- District
- Cloverdale Community Schools
- NCES district ID
- 1802220
- Math proficiency
- 36% ▼ -16.00%
- Reading proficiency
- 40% ▼ -14.00%
- Median HH income
- $44,267
- Composite
- 32.28/100
- National rank
- #5753
- State rank
- #167 of 301 in IN
Livability — Poland
No livability data for this city. (Only ~50 U.S. cities are tracked.)
Census & demographics
- Population (ZIP)
- 2,870
Population outlook (Owen County) Hauer SSP2
- Today (2025)
- 19,045 people
- By 2030
- 17,930 · -5.9%
- By 2040
- 15,507 · -18.6%
- By 2050
- 13,253 · -30.4%
- By 2075
- 9,364 · -50.8%
- By 2100
- 6,686 · -64.9%
Race, ethnicity, and origin ACS 2023
- Neighborhood character
- Predominantly White (95%)
- Race & ethnicity
- White 95% Black 3% Two or more races 1%
- Common ancestry
- Iranian 2% Slovak 2% Lithuanian 1%
- Foreign-born
- 1%
- Languages at home
- 99% English-only · Tagalog/Filipino 1%
Political lean MEDSL · Owen
- 2024 margin
- Solid R (+50.7) · D 23.8% · R 74.5% · Other 1.6%
- 2008→2024 swing
- -40.3pp toward R · 2008: -10.3pp · 2024: -50.7pp
- All cycles
- 2024: R+50.7 2020: R+49.1 2016: R+49.4 2012: R+27.6 2008: R+10.3
Not yet ingested
- Civics
- —
Market trends
- HPI YoY
- ▲ 21.99%
- Current HPI
- 246.3509
- Rent YoY
- —
- Metro
- —
- State GDP YoY
- ▲ 2.90%
- F500 in state
- 18
Industry mix (Fortune 500 HQ in IN)
| Industry | F500 HQs | Revenue |
|---|---|---|
| Industrial Machinery | 2 | $37B |
|
||
| Healthcare | 1 | $177B |
|
||
| Pharmaceuticals | 1 | $45B |
|
||
| Metals / Steel | 1 | $18B |
|
||
| Agriculture | 1 | $17B |
|
||
| Packaging | 1 | $12B |
|
||
Price history
+137.6% since first listed11 events — show timeline
- 2026-06-12 Listed $215,000 MIBOR as Distributed by MLS Grid
- 2026-05-26 Pending — MIBOR as Distributed by MLS Grid
- 2026-05-26 Listing Removed — MIBOR as Distributed by MLS Grid
- 2026-05-19 Relisted — MIBOR as Distributed by MLS Grid
- 2026-05-05 Pending — MIBOR as Distributed by MLS Grid
- 2026-04-29 Listed $219,900 MIBOR as Distributed by MLS Grid
- 2024-05-14 Sold (Public Records) $175,000 Public Records
- 2013-12-31 Listing Removed — MIBOR as Distributed by MLS Grid
- 2013-09-05 Listed $75,000 MIBOR as Distributed by MLS Grid
- 2003-10-15 Sold (MLS) $86,000 MIBOR as Distributed by MLS Grid
- 2003-08-14 Listed $90,500 MIBOR as Distributed by MLS Grid
Property tax history
+9.7%/yrLatest (2024): $1,185 · -56.0% YoY. Source: county tax records.
Cash-flow waterfall
monthlySold comps — $/sqft
last 12 mo · ≤1 miLoading sold comps…