 Multi-family
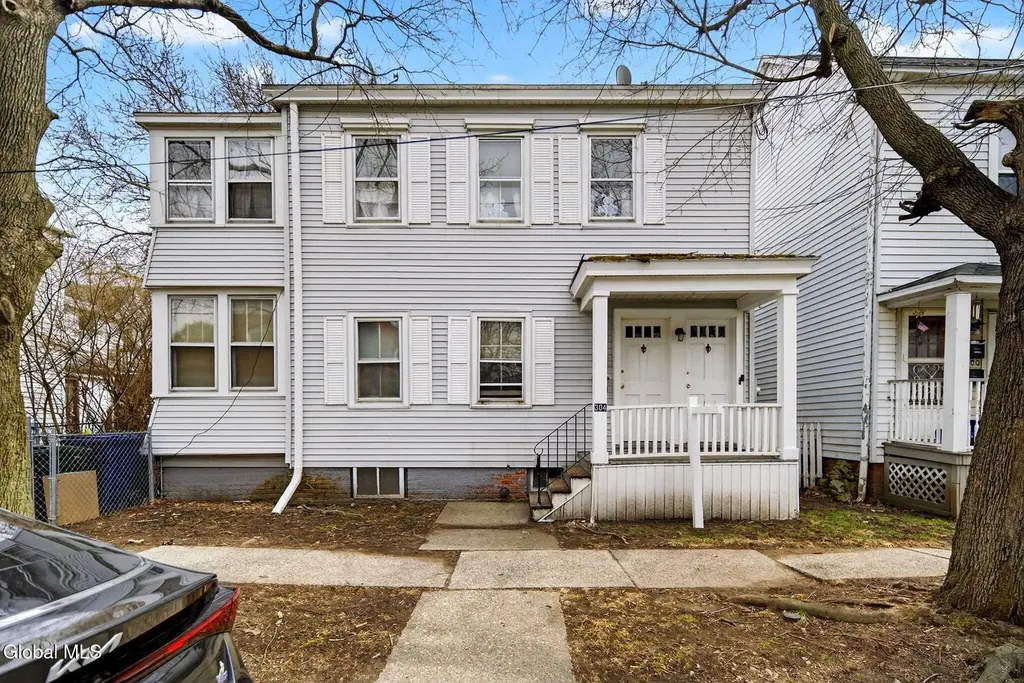
304 2nd Ave · Watervliet, NY
Flood risk 8/10 · Major
- FEMA flood zone
- X (shaded)
- Chance of flooding over 30 yrs
- 0.78%
- Est. flood insurance / yr
- $473 – $860
Fire risk 3/10 · Minor
- Est. fire insurance / yr
- $691 – $1,283
Heat risk 4/10 · Minor
- Hot days now (above 96°F)
- 7 days/yr
- Hot days in 30 yrs
- 17 days/yr
Wind risk 3/10 · Minor
- Chance of severe wind over 30 yrs
- 6.0%
Air-quality risk 2/10 · Minimal
- Unhealthy air days now
- 0 days/yr
- Unhealthy air days in 30 yrs
- 1 days/yr
Risk factors via First Street. Map © Google.
Why this score? — see what drove the B+ grade
The composite is a weighted blend of 9 inputs, each scored 0–100. Each bar is that input's sub-score; the figure is the points it added to the 100-point composite (weight × sub-score).
- Cash flow +30.0/30.0
- ARV discount +14.2/15.0
- 1% rule +10.0/10.0
- DSCR +10.0/10.0
- Rent growth +4.2/5.0
- Livability +4.2/5.0
- Schools +3.4/10.0
- Condition / age +2.5/5.0
- Appreciation +0.0/10.0
$220,000
🖨 Deal sheet 📄 Offer letter ✓ Due diligence
Multi-family units
County records classify this as Multi-Family (2-4 Unit). Listing-text estimate: 1 unit. estimate disagrees with records
Listing remarks
* Multiple Offers- Highest and Best due Wednesday, April 1st at 12pm * Great opportuntiy to owner occupy or add to your real esate portfolio in Port Schuyler. First floor features 3 Bedrooms and 1 Bathroom. Second Floor features 3 Bedroom and 1.5 Baths with many upgrades. Minutes from Broadway in Menands, 787, I90.
Key facts
- 2,613 sq ft lot
- Built 1960
- Listed 12 days
Property features AI
Finance
- Other:
- Financial info: Two-unit property; Tenants pay hot water, heat, internet, cable TV, electricity and gas; Owner pays sewer and water
- HOA & community:
Exterior
- Parking:
- Security:
- Utilities: Public sewer; Cable available
- Home design: Duplex; Vinyl siding exterior; Rubber and shingle roof; Concrete perimeter foundation
- Construction: Vinyl siding construction; Rubber roof; Shingle roof; Concrete perimeter foundation
- Exterior features: Rear porch; Back yard fencing; Chain link fence; Road frontage
Interior
- Kitchen: Solid surface counters (kitchen surfaces)
- Bedrooms: Two units each with 3 bedrooms (Unit 1: 3 bedrooms, Unit 2: 3 bedrooms)
- Flooring: Carpet; Hardwood; Laminate
- Bathrooms: Total of 3 bathrooms (2 full, 1 half); Full bath on 1st floor; Full bath on 2nd floor; Half bath on 2nd floor
- Heating & cooling: Has heating; Baseboard heating; Hot water heating; Natural gas heating
- Interior features: Solid surface counters; Wood window frames
- Laundry & utility: Washer hookup; Electric dryer hookup
Neighborhood map
What this means for you Summary
Snapshot
- This is a 6-bed/3.0-bath multifamily listed at $220k.
Deal economics
- At list price, monthly cash flow is $4k ($45k/yr) — positive.
- The deal already cash-flows at list — no discount required.
- Meets the 1% rule at list price ($7k rent vs $220k).
- Cap rate 26.9% vs local median 5.9% in Watervliet — top-decile yield for the area; either an underpriced asset or a hidden risk that comps aren't pricing in. Stress-test before assuming the spread holds.
Location & tenants
- Location reads 84/100 on livability (#51 in NY, #786 nationally) — a professional / high-income tenant draw. Strengths: amenities A+, housing A+, health & safety A+; Watch: crime D+, schools D.
- Watervliet City School District (suburban): math 36% / reading 45% proficiency, ranked #524 of 590 in NY (top 89%) — families likely to look elsewhere, expect single-tenant / working-renter base with shorter leases.
- Market conditions: Rents rising fast (+6.6%/yr); 72 active listings in the ZIP; 675 units permitted in Albany County in 2024 (451 in 5+ unit buildings).
- At $6,870/mo this rent would consume 126% of the median local household income ($65k/yr) (locally 1224% of renters already pay >50% of income on rent) — very limited rent-growth headroom before tenants either downsize or default.
Forward outlook
- Local home prices are declining (-3.0%/yr); year-one equity from $2k of loan paydown is wiped out by about $7k of value loss. Plan a longer hold.
- Albany County population projected at +9% by 2050 — modest demand growth; plan on rents tracking national, not racing it.
- At projected returns (-3.0% appreciation + 6.6% rent growth), your $62k cash investment doubles in ~2 years — after that, you're playing with house money.
Negotiation context
- Only 12 days on market — expect competitive offers; lowballing is unlikely to land.
- 4 sale attempts since 16y ago with the ask held roughly flat each time — persistent listings suggest the price (not the market) is what's stuck; bring a comps-based counter.
Risks & watch-outs
- Watch-outs: flood insurance adds $56/mo.
- Climate carrying-cost: severe flood risk — expect insurance premiums to compound above CPI over the hold.
Questions for the listing agent
- Built in 1960 — when were the roof, HVAC, electrical panel, plumbing, and water heater last replaced?
- What's the actual annual flood-insurance premium (NFIP or private), and is the property in a SFHA with mandatory coverage?
- Is there a deadline driving the sale (1031 exchange, divorce, estate, relocation)? That informs how much negotiation room exists.
- Schools are D-rated, which usually means shorter tenancies and higher turnover. Who's the typical renter profile here, and what's been the actual vacancy rate?
- Crime grade is D in this area — have there been break-ins, vandalism, or insurance claims at this property in the last 3 years? What carrier currently insures it and at what premium?
- What's the average days-on-market for RENTAL listings here right now (not sales)? A rising rental-DOM trend means longer vacancies and softer asking-rent achievability than the comps imply.
- What's the recent tenant-quality profile in this submarket — average credit score on applications, eviction rate, late-payment / NSF rate, and stable-employment percentage? A property-management company in the area should have these aggregated.
- How much new apartment / multifamily construction is in the pipeline within 1–3 miles? Heavy new supply (>2% of stock underway) typically softens rents 12–24 months out; light construction supports rent growth.
Investment metrics
- 1% rule
- 3.12% ✓
- Cap rate
- 26.92%
- Cash-on-cash
- 73.67%
- DSCR
- 4.28
- GRM
- 2.7
CMA / ARV
- ARV (on-the-fly)
- $258,672
- Comps found
- 12
Show comp detail 12 sales within ~0.75 mi
| Address | Dist | Beds/Ba | Sqft | Sold | Price | $/sf | Match |
|---|---|---|---|---|---|---|---|
| 508 2nd St | 0.17mi | 5/3.0 (-1) | 2,584 (+2%) | 11mo | $220,000 | $85 | 74 |
| 504 Second St | 0.16mi | 5/2.0 (-1) | 2,392 (-6%) | 2mo | $255,000 | $107 | 73 |
| 585 6th Ave | 0.26mi | 6/2.0 | 2,384 (-6%) | 2mo | $256,000 | $107 | 72 |
| 612 7th St | 0.40mi | 6/2.0 | 2,316 (-9%) | 7mo | $225,000 | $97 | 57 |
| 527 2nd Street St | 0.64mi | 5/3.0 (-1) | 2,464 (-3%) | 8mo | $160,000 | $65 | 54 |
| 544 1st St | 0.61mi | 5/4.0 (-1) | 2,551 (+1%) | 14mo | $370,000 | $145 | 50 |
| 462 1st St | 0.67mi | 6/2.0 | 2,376 (-6%) | 9mo | $319,500 | $134 | 46 |
| 542 1st St | 0.61mi | 6/2.0 | 2,300 (-9%) | 13mo | $197,000 | $86 | 42 |
| 565 1st St | 0.58mi | 7/4.0 (+1) | 2,818 (+11%) | 8mo | $310,000 | $110 | 39 |
| 508 2nd St | 0.68mi | 6/2.0 | 2,244 (-12%) | 11mo | $230,000 | $102 | 36 |
| 3 Winslow Ave | 0.60mi | 6/3.0 | 2,200 (-13%) | 18mo | $162,000 | $74 | 34 |
| 632 4th St | 0.65mi | 5/3.0 (-1) | 2,205 (-13%) | 12mo | $210,000 | $95 | 33 |
Match score weights: distance 35% · size 25% · config 20% · recency 20%. Top-matched comps best support the ARV.
Projected returns pro-forma
-3.0% appreciation · 6.61% rent growth · sell at horizon
- IRR
- 76.5%
- Equity multiple
- 4.70×
- Total profit
- $227,741
- Equity at exit
- $32,803
- IRR
- 81.2%
- Equity multiple
- 11.05×
- Total profit
- $619,067
- Equity at exit
- $19,022
Cash invested: $61,600 (down + closing). Projections, not guarantees.
Landlord ↔ Tenant lean methodology
- Overall (STATE)
- 15 Strongly Tenant-Friendly
- State New York
- 15 Strongly Tenant-Friendly · D+10
- County
- — inherits STATE
- City
- — inherits STATE
ZIP-level market 12189
- Home prices YoY
- -28.7%
- Rents YoY
- 6.6%
- Active inventory
- 72
- Price-to-rent
- 10.7×
Monthly cashflow live
- Estimated rent
- $6,870 high interval (Pro) →
- Mortgage (P&I)
- −$1,154
- Tax from tax record
- −$400 /mo · $4,803/yr
- Insurance
- −$92
- Flood insurance flood zone
- −$56 /mo · $666/yr
- HOA
- −$0
- Vacancy / Maint / Mgmt
- −$1,443
- Net cashflow
- $3,726
Break-even live
4-unit breakdown (identical units grouped — click to expand)
| Units | Beds | Baths | Est. rent |
|---|---|---|---|
| 4× units | 3 | 1.5 | $6,872 |
| #1 | 3 | 1.5 | $1,718 |
| #2 | 3 | 1.5 | $1,718 |
| #3 | 3 | 1.5 | $1,718 |
| #4 | 3 | 1.5 | $1,718 |
| Total (4 units) | $6,870 | ||
UW: 25.0% down · 7.5% · 30yr · 1.5% tax · 5.0% vac · 8.0% maint · 8.0% mgmt
Financing live
Cash to close
- Down payment
- $55,000
- Closing costs
- $6,600
- Reserves months
- —
- Total cash needed
- —
Loan-product check · same deal, 3 products live
Conventional
25% down · 7.5% · 30yr
- Down + closing
- —
- Monthly P&I
- —
- Monthly cashflow
- —
- DSCR
- —
- Eligible?
- —
Personal DTI + credit; lowest rate.
DSCR
20% down · 8.5% · 30yr
- Down + closing
- —
- Monthly P&I
- —
- Monthly cashflow
- —
- DSCR
- —
- Eligible?
- —
No personal income docs; deal must DSCR.
Hard money
10% down · 12.0% · 12mo
- Down + closing
- —
- Monthly P&I
- —
- Monthly cashflow
- —
- DSCR
- —
- Eligible?
- —
Short-term bridge; refi at stabilization.
Listing history 8 events
-
2026-04-30status Pending
-
2026-04-23status Active
-
2026-04-01status Pending
-
2026-03-27$220,000 Active
-
2010-12-01historical
-
2010-06-15$125,000
-
2010-06-15historical
-
2010-04-13$125,000
ⓘ Source: listings_history table (triggers on properties + properties_extension) + one-shot
backfill from property_details.listing_events for pre-trigger history.
Tax reassessment forecast NY · Partial reset (capped growth)
- Current annual tax
- $4,803 · $400/mo
- Projected year-2 tax
- $4,803 · $400/mo
- Expected delta
- $0/yr ($0/mo · 0.0%)
ⓘ Screening estimate from a state-policy table — verify with the county assessor before closing.
Climate risk First Street
- Flood 8/10 Severe FEMA zone X (shaded) · 78% chance over 30 yrs
- Wildfire 3/10 Moderate
- Heat 4/10 Moderate 7 d/yr ≥96°F today · 17 d/yr by 30 yrs out
- Wind 3/10 Moderate 6% chance of damaging wind over 30 yrs
- Air quality 2/10 Low 0 unhealthy d/yr today · 1 by 30 yrs out
Nearby sold comps map
Loading sold comps map…
Walkable amenities ~0.75 mi
Loading nearby amenities…
Taxation est. · year 1
- Rental income
- $82,440
- − Mortgage interest
- −$12,323
- − Property taxes
- −$4,803
- − Insurance
- −$1,766
- − Repairs & maintenance
- −$6,595
- − Management
- −$6,595
- − Depreciation
- −$6,400
- Taxable income
- $43,957
- Est. tax owed @ 24.0%
- −$10,550
- After-tax cash flow
- $34,164/yr
For passive investors: Depreciation is non-cash, so a rental often shows a tax loss while cash-flowing — sheltering income. Rental losses are passive: they offset passive income freely, and up to $25,000/yr can offset ordinary (W-2) income if you actively participate and your MAGI is under $100k (phasing out to $0 by $150k); unused losses carry forward. On sale, claimed depreciation is recaptured at up to 25%, and gains may owe capital-gains tax (a 1031 exchange can defer both). Figures are a year-1 estimate at your 24.0% rate — not tax advice; consult a CPA.
Schools (NCES district)
- District
- Watervliet City School District
- NCES district ID
- 3630210
- Math proficiency
- 36% ▼ -2.00%
- Reading proficiency
- 45% ▬ 0.00%
- Median HH income
- $43,276
- Composite
- 34.23/100
- National rank
- #5261
- State rank
- #524 of 590 in NY
Livability — Watervliet
- Score
- 84/100
- State rank
- #51
- US rank
- #786
Category grades
Schools grade is shown separately in the Schools card above.
Census & demographics
- Census place
- Watervliet, NY
- County
- Albany County · 196,626 people
- City population
- 18,656
- Metro
- Albany-Schenectady-Troy, NY
- Population (ZIP)
- 18,656
- Household income
- $65,276
- Rent vs Own
- Severe rent burden
- 1224.0
Population outlook (Albany County) Hauer SSP2
- Today (2025)
- 320,794 people
- By 2030
- 327,401 · +2.1%
- By 2040
- 338,218 · +5.4%
- By 2050
- 348,467 · +8.6%
- By 2075
- 381,693 · +19.0%
- By 2100
- 393,809 · +22.8%
Race, ethnicity, and origin ACS 2023
- Neighborhood character
- Predominantly White (72%)
- Race & ethnicity
- White 72% Two or more races 8% Asian 8% Black 8% Hispanic / Latino 6%
- Hispanic origin (detail)
- Mexican 2% Puerto Rican 2% Dominican 1%
- Common ancestry
- Lithuanian 6% Romanian 5% Scotch-Irish 4%
- Foreign-born
- 11% · Canada, China, South Korea
- Languages at home
- 88% English-only · Other Indo-European 4% Spanish 2% Other Asian/Pacific 2%
Political lean MEDSL · Albany
- 2024 margin
- Strong D (+25.8) · D 62.9% · R 37.1%
- 2008→2024 swing
- -3.6pp toward R · 2008: 29.4pp · 2024: 25.8pp
- All cycles
- 2024: D+25.8 2020: D+31.4 2016: D+24.3 2012: D+31.0 2008: D+29.4
Not yet ingested
- Civics
- —
Market trends
- HPI YoY
- ▼ -110.16%
- Current HPI
- 273.8109
- Rent YoY
- ▲ 6.61%
- Metro
- Albany-Schenectady-Troy, NY
- State GDP YoY
- ▲ 2.60%
- F500 in state
- 92
Industry mix (Fortune 500 HQ in NY)
| Industry | F500 HQs | Revenue |
|---|---|---|
| Financial Services | 10 | $950B |
|
||
| Consumer Goods | 9 | $162B |
|
||
| Insurance | 4 | $225B |
|
||
| Telecommunications | 2 | $144B |
|
||
| Pharmaceuticals | 2 | $112B |
|
||
| Media / Entertainment | 2 | $69B |
|
||
Price history
+76.0% since first listed8 events — show timeline
- 2026-04-30 Pending — Global MLS
- 2026-04-23 Relisted — Global MLS
- 2026-04-01 Pending — Global MLS
- 2026-03-27 Listed $220,000 Global MLS
- 2010-12-01 Listing Removed — Global MLS
- 2010-06-15 Listing Removed — Global MLS
- 2010-06-15 Listed $125,000 Global MLS
- 2010-04-13 Listed $125,000 Global MLS
Property tax history
+2.7%/yrLatest (2025): $4,803 · +2.8% YoY. Source: county tax records.
Cash-flow waterfall
monthlySold comps — $/sqft
last 12 mo · ≤1 miLoading sold comps…