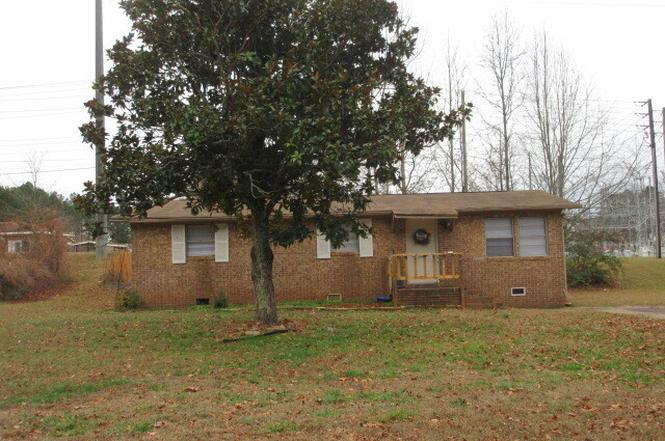
75 Greenway Ct · McDonough, GA
Flood risk 1/10 · Minimal
- FEMA flood zone
- X (unshaded)
- Chance of flooding over 30 yrs
- 0.0%
- Est. flood insurance / yr
- $507 – $1,088
Fire risk 2/10 · Minimal
- Est. fire insurance / yr
- $963 – $1,789
Heat risk 6/10 · Moderate
- Hot days now (above 106°F)
- 7 days/yr
- Hot days in 30 yrs
- 18 days/yr
Wind risk 6/10 · Moderate
- Chance of severe wind over 30 yrs
- 27.0%
Air-quality risk 4/10 · Minor
- Unhealthy air days now
- 4 days/yr
- Unhealthy air days in 30 yrs
- 8 days/yr
Risk factors via First Street. Map © Google.
Why this score? — see what drove the B+ grade
The composite is a weighted blend of 9 inputs, each scored 0–100. Each bar is that input's sub-score; the figure is the points it added to the 100-point composite (weight × sub-score).
- Cash flow +30.0/30.0
- ARV discount +15.0/15.0
- DSCR +10.0/10.0
- 1% rule +9.5/10.0
- Livability +3.2/5.0
- Schools +2.6/10.0
- Condition / age +2.5/5.0
- Rent growth +2.4/5.0
- Appreciation +0.0/10.0
$129,000
🖨 Deal sheet (PDF) 📄 Offer letter ✓ Due diligence
Listing remarks
This 3 bedroom, 1 bath single-family home built in 1971 offers approximately 1,056 square feet on approximately 0.45 acres. Suitable for an owner-occupant or investor. Home is being sold as-is. Home may be purchased individually or as part of a multi-property package. Additional locations available. Purchase options may be available for individual homes. Located in the Oakland and McDonough school districts. All information is believed to be accurate but not guaranteed and should be independently verified. What was removed, correctly: No mobile language No title status No "no park / no lot rent" No mobile framing at all Next step when you're ready: Private remark
Key facts
- 0.45 acre lot
- Built 1971
- Listed 97 days
Neighborhood map
What this means for you Summary
Snapshot
- This is a 3-bed/1.0-bath single-family listed at $129k.
Deal economics
- At list price, monthly cash flow is $571 ($7k/yr) — positive.
- The deal already cash-flows at list — no discount required.
- Meets the 1% rule at list price ($2k rent vs $129k).
- Recommended offer: $117k (9.0% below list) — sets the bar for market timing.
- Cap rate 11.6% vs local median 3.9% in McDonough — top-decile yield for the area; either an underpriced asset or a hidden risk that comps aren't pricing in. Stress-test before assuming the spread holds.
Location & tenants
- Location reads 63/100 on livability (#279 in GA) — a middle-class / working-renter tenant base. Strengths: cost of living A+, housing A+, employment B; Watch: crime D, amenities F, commute F.
- Henry County (rural): math 24% / reading 33% proficiency, ranked #89 of 174 in GA (top 51%) — low school quality limits family demand, transient renter base, plan for 1-2y turnover.
- Zoned schools: Oakland Elementary School (math 8% / reading 17%, grade F, #1,032 of 1,228 statewide, top 85%, 931 students, 70% FRL); Mcdonough Middle School (math 22% / reading 32%, grade F, #271 of 470 statewide, top 60%, 954 students, 66% FRL); Mcdonough High School (math 4% / reading 27%, grade F, #290 of 424 statewide, top 69%, 1,288 students, 62% FRL) — zoned schools average 66% FRL vs 43% district-wide (23 pts higher); higher-poverty schools than district average — tighter screening recommended.
- Market conditions: Rents soft (-0.3%/yr); 682 active listings in the ZIP; 40 comparable units currently listed for rent nearby; rentals at typical pace (median 19d on market — plan ~3-4 weeks tenant-placement turnaround); solid renter incomes; 1,989 units permitted in Henry County in 2024 (92 in 5+ unit buildings).
Forward outlook
- Local home prices are declining (-3.0%/yr); year-one equity from $892 of loan paydown is wiped out by about $4k of value loss. Plan a longer hold.
- Henry County population projected at +29% by 2050 — long-run rental-demand tailwind backs the buy-and-hold thesis.
- At projected returns (-3.0% appreciation + 0.0% rent growth), your $36k cash investment doubles in ~9 years — after that, you're playing with house money.
Negotiation context
- It's been on market 97 days — a 9% lower offer ($117k) is reasonable based on typical stale-listing flexibility.
- Current owner paid $46k; list at $129k implies a 180% gain — meaningful room to come down on a strong offer.
Risks & watch-outs
- Climate carrying-cost: major wind risk, 27% chance of damaging wind over 30y; extreme-heat days projected 7→18/yr by 2055 (HVAC capex compounding) — expect insurance premiums to compound above CPI over the hold.
Questions for the listing agent
- It's been on market 97 days. Have you received any prior offers? Is the seller open to a 9% concession, seller financing, or rate buy-down credit?
- Built in 1971 — when were the roof, HVAC, electrical panel, plumbing, and water heater last replaced?
- Why hasn't it sold? Are there any deal-killer items the seller is aware of (foundation, flood, title, zoning, code violations)?
- Is there a deadline driving the sale (1031 exchange, divorce, estate, relocation)? That informs how much negotiation room exists.
- Schools are D-rated, which usually means shorter tenancies and higher turnover. Who's the typical renter profile here, and what's been the actual vacancy rate?
- Crime grade is D in this area — have there been break-ins, vandalism, or insurance claims at this property in the last 3 years? What carrier currently insures it and at what premium?
- What's the average days-on-market for RENTAL listings here right now (not sales)? A rising rental-DOM trend means longer vacancies and softer asking-rent achievability than the comps imply.
- What's the recent tenant-quality profile in this submarket — average credit score on applications, eviction rate, late-payment / NSF rate, and stable-employment percentage? A property-management company in the area should have these aggregated.
- How much new for-sale + rental construction is in the pipeline within 1–3 miles? Heavy new supply typically softens prices + rents 12–24 months out; constrained supply supports both.
Investment metrics
- 1% rule
- 1.45% ✓
- Cap rate
- 11.61%
- Cash-on-cash
- 18.98%
- DSCR
- 1.84
- GRM
- 5.7
CMA / ARV
- ARV (on-the-fly)
- $168,960
- Comps found
- 5
Show comp detail 5 sales within ~0.75 mi
| Address | Dist | Beds/Ba | Sqft | Sold | Price | $/sf | Match |
|---|---|---|---|---|---|---|---|
| 75 Greenway Ct | 0.00mi | 3/1.0 | 1,056 (0%) | 1mo | $129,000 | $122 | 99 |
| 30 Lemon Pl | 0.25mi | 3/1.0 | 960 (-9%) | 8mo | $154,000 | $160 | 67 |
| 117 Tillman Ct | 0.58mi | 3/2.0 | 1,118 (+6%) | 6mo | $233,000 | $208 | 54 |
| 48 Washington St | 0.53mi | 3/1.0 | 1,168 (+11%) | 15mo | $73,000 | $63 | 45 |
| 205 Old Griffin Rd | 0.39mi | 2/1.0 (-1) | 924 (-12%) | 24mo | $210,000 | $227 | 36 |
Match score weights: distance 35% · size 25% · config 20% · recency 20%. Top-matched comps best support the ARV.
Projected returns pro-forma
-3.0% appreciation · 0.0% rent growth · sell at horizon
- IRR
- 7.4%
- Equity multiple
- 1.28×
- Total profit
- $10,032
- Equity at exit
- $19,234
- IRR
- 13.9%
- Equity multiple
- 1.96×
- Total profit
- $34,544
- Equity at exit
- $11,154
Cash invested: $36,120 (down + closing). Projections, not guarantees.
Landlord ↔ Tenant lean methodology
- Overall (STATE)
- 90 Strongly Landlord-Friendly
- State Georgia
- 90 Strongly Landlord-Friendly · R+3
- County
- — inherits STATE
- City
- — inherits STATE
ZIP-level market 30253
- Home prices YoY
- -29.4%
- Rents YoY
- -0.3%
- Active inventory
- 682
- Price-to-rent
- 5.7×
Monthly cashflow live
- Estimated rent
- $1,871 high interval (Pro) →
- Mortgage (P&I)
- −$676
- Tax from tax record
- −$177 /mo · $2,122/yr
- Insurance
- −$54
- HOA
- −$0
- Vacancy / Maint / Mgmt
- −$393
- Net cashflow
- $571
Break-even live
Sensitivity live
| Price | -10% $644 | -5% $608 | +0% $571 | +5% $535 | +10% $498 |
|---|---|---|---|---|---|
| Rent | -10% $423 | -5% $497 | +0% $571 | +5% $645 | +10% $719 |
| Rate | -1.0pp $636 | -0.5pp $604 | base $571 | +0.5pp $538 | +1.0pp $504 |
UW: 25.0% down · 7.5% · 30yr · 1.5% tax · 5.0% vac · 8.0% maint · 8.0% mgmt
Financing live
Cash to close
- Down payment
- $32,250
- Closing costs
- $3,870
- Reserves months
- —
- Total cash needed
- —
Loan-product check · same deal, 3 products live
Conventional
25% down · 7.5% · 30yr
- Down + closing
- —
- Monthly P&I
- —
- Monthly cashflow
- —
- DSCR
- —
- Eligible?
- —
Personal DTI + credit; lowest rate.
DSCR
20% down · 8.5% · 30yr
- Down + closing
- —
- Monthly P&I
- —
- Monthly cashflow
- —
- DSCR
- —
- Eligible?
- —
No personal income docs; deal must DSCR.
Hard money
10% down · 12.0% · 12mo
- Down + closing
- —
- Monthly P&I
- —
- Monthly cashflow
- —
- DSCR
- —
- Eligible?
- —
Short-term bridge; refi at stabilization.
Rent comps 40 comps
| Address | Beds | Baths | Sqft | Rent | $/sqft | DOM | Units | Dist |
|---|---|---|---|---|---|---|---|---|
| 100 Crossing Blvd McDonough, GA | 2.0–3.0 | 2.0 | 1271 | $2,245 | $1.77 | 21d | 15 | 0.40mi |
| 100 Crossing Blvd #1403 McDonough, GA | 1.0–2.0 | 1.0–2.0 | 1030 | $2,042 | $1.98 | 20d | 10 | 0.40mi |
| 1010 Labonte Pkwy #1 McDonough, GA | 3.0 | 2.5 | 1220 | $1,800 | $1.48 | 20d | 1 | 0.55mi |
| 1550 Labonte Pkwy McDonough, GA | 3.0 | 2.5 | 1219 | $1,550 | $1.27 | 17d | 1 | 0.59mi |
| 2125 Marlin Dr McDonough, GA | 2.0 | 2.0 | 1400 | $1,831 | $1.31 | 1d | 1 | 0.61mi |
| 2105 Marlin Dr McDonough, GA | 3.0 | 2.0 | 1400 | $1,781 | $1.27 | 6d | 1 | 0.61mi |
| 2205 Marlin Dr McDonough, GA | 3.0 | 2.0 | 1334 | $1,831 | $1.37 | 14d | 1 | 0.61mi |
| 2435 Marlin Dr McDonough, GA | 3.0 | 2.5 | 1386 | $1,781 | $1.28 | 6d | 1 | 0.62mi |
| 2835 Marlin Dr McDonough, GA | 3.0 | 2.5 | 1334 | $1,831 | $1.37 | 26d | 1 | 0.65mi |
| 2845 Marlin Dr McDonough, GA | 3.0 | 2.5 | 1334 | $1,781 | $1.34 | 6d | 1 | 0.65mi |
| 135 Tillman Ct McDonough, GA | 3.0 | 2.0 | 1206 | $1,769 | $1.47 | 4d | 1 | 0.66mi |
| 141 R L Stewart Ct McDonough, GA | 2.0 | 2.0 | 1440 | $1,200 | $0.83 | 45d | 1 | 0.76mi |
| 745 Georgia 42 McDonough, GA | 2.0 | 2.0 | 1320 | $1,712 | $1.30 | 45d | 1 | 0.77mi |
| 102 Sable Chase Blvd McDonough, GA | 1.0–3.0 | 1.0–2.0 | 980 | $1,734 | $1.77 | 1d | 20 | 0.88mi |
| 6035 Creekerton Blvd McDonough, GA | 3.0 | 2.5 | 1323 | $1,550 | $1.17 | 26d | 1 | 0.98mi |
| 420 Autumn Lake Ct McDonough, GA | 3.0 | 2.0 | 1238 | $1,626 | $1.31 | 23d | 1 | 0.99mi |
| 1445 Lafayette Sq McDonough, GA | 3.0 | 2.0 | 1386 | $1,724 | $1.24 | 18d | 1 | 1.00mi |
| 1445 Lafayette Sq McDonough, GA | 3.0 | 2.0 | 1386 | $1,724 | $1.24 | 14d | 1 | 1.00mi |
| 300 Rogers St McDonough, GA | 2.0 | 1.0 | 730 | $1,350 | $1.85 | 6d | 1 | 1.04mi |
| 300 Rogers St McDonough, GA | 2.0 | 1.0 | 730 | $1,350 | $1.85 | 45d | 1 | 1.04mi |
| 1810 Midcourt Way McDonough, GA | 3.0 | 2.0 | 1409 | $1,840 | $1.31 | 5d | 1 | 1.05mi |
| 337 Autumn Lake Dr McDonough, GA | 3.0 | 2.0 | 1225 | $1,795 | $1.47 | 45d | 1 | 1.07mi |
| 172 Regency Park Dr McDonough, GA | 3.0 | 2.0 | 1283 | $1,875 | $1.46 | 26d | 1 | 1.08mi |
| 205 Bridges Rd McDonough, GA | 1.0–3.0 | 1.0–2.0 | 1083 | $2,166 | $2.00 | 1d | 31 | 1.09mi |
| 6004 Creekerton Blvd McDonough, GA | 3.0 | 2.5 | 1461 | $1,800 | $1.23 | 20d | 1 | 1.10mi |
| 257 Rogers St McDonough, GA | 2.0 | 1.0 | 780 | $1,299 | $1.67 | 1d | 1 | 1.10mi |
| 1025 City Park Dr McDonough, GA | 2.0 | 2.0 | 1500 | $1,900 | $1.27 | 45d | 1 | 1.10mi |
| 5295 Tussahaw Xing McDonough, GA | 3.0 | 2.5 | 1437 | $1,765 | $1.23 | 45d | 1 | 1.13mi |
| 4115 Mission Way McDonough, GA | 3.0 | 2.5 | 1282 | $1,745 | $1.36 | 6d | 1 | 1.14mi |
| 5160 Tussahaw Xing McDonough, GA | 3.0 | 2.5 | 1313 | $1,649 | $1.26 | 18d | 1 | 1.19mi |
| 132 Samanthas Way McDonough, GA | 3.0 | 2.0 | 1139 | $1,600 | $1.40 | 45d | 1 | 1.20mi |
| 348 Coral Cir McDonough, GA | 3.0 | 2.5 | 1296 | $1,880 | $1.45 | 45d | 1 | 1.20mi |
| 1785 Neighborhood Walk McDonough, GA | 3.0 | 2.0 | 1369 | $1,880 | $1.37 | 3d | 1 | 1.22mi |
| 122 Samanthas Way McDonough, GA | 3.0 | 2.0 | 1118 | $1,600 | $1.43 | 45d | 1 | 1.24mi |
| 241 Coral Cir McDonough, GA | 3.0 | 2.5 | 1440 | $1,950 | $1.35 | 26d | 1 | 1.25mi |
| 155 Cola Welch Pkwy McDonough, GA | 2.0–3.0 | 2.0 | 1038 | $1,643 | $1.58 | 1d | 8 | 1.29mi |
| 311 Coral Cir McDonough, GA | 3.0 | 2.5 | 1421 | $1,595 | $1.12 | 1d | 1 | 1.29mi |
| 311 Coral Cir McDonough, GA | 3.0 | 2.5 | 1421 | $1,595 | $1.12 | 4d | 1 | 1.29mi |
| 449 Kara Ln McDonough, GA | 3.0 | 2.5 | 1299 | $800 | $0.62 | 20d | 1 | 1.30mi |
| 570 McDonough Pkwy McDonough, GA | 1.0–3.0 | 1.0–2.0 | 1066 | $1,955 | $1.83 | 1d | 28 | 1.32mi |
Listing history 7 events
-
2026-04-28status Under Contract
-
2026-01-19$129,000 New
-
2011-11-10price $14,000 Reduced
-
2011-10-13price $15,000 Reduced
-
2011-09-14price $18,000 Reduced
-
2000-10-23soldstatus $46,000
-
1972-02-01soldstatus $15,900
ⓘ Source: listings_history table (triggers on properties + properties_extension) + one-shot
backfill from property_details.listing_events for pre-trigger history.
Tax reassessment forecast GA · Resets to sale price
- Current annual tax
- $2,122 · $177/mo
- Projected year-2 tax
- $2,122 · $177/mo
- Expected delta
- $0/yr ($0/mo · 0.0%)
ⓘ Screening estimate from a state-policy table — verify with the county assessor before closing.
Climate risk First Street
- Flood 1/10 Low FEMA zone X (unshaded) · 0% chance over 30 yrs
- Wildfire 2/10 Low
- Heat 6/10 Major 7 d/yr ≥106°F today · 18 d/yr by 30 yrs out
- Wind 6/10 Major 27% chance of damaging wind over 30 yrs
- Air quality 4/10 Moderate 4 unhealthy d/yr today · 8 by 30 yrs out
Nearby sold comps map
Loading sold comps map…
Walkable amenities ~0.75 mi
Loading nearby amenities…
Taxation est. · year 1
- Rental income
- $22,455
- − Mortgage interest
- −$7,226
- − Property taxes
- −$2,122
- − Insurance
- −$645
- − Repairs & maintenance
- −$1,796
- − Management
- −$1,796
- − Depreciation
- −$3,753
- Taxable income
- $5,117
- Est. tax owed @ 24.0%
- −$1,228
- After-tax cash flow
- $5,627/yr
For passive investors: Depreciation is non-cash, so a rental often shows a tax loss while cash-flowing — sheltering income. Rental losses are passive: they offset passive income freely, and up to $25,000/yr can offset ordinary (W-2) income if you actively participate and your MAGI is under $100k (phasing out to $0 by $150k); unused losses carry forward. On sale, claimed depreciation is recaptured at up to 25%, and gains may owe capital-gains tax (a 1031 exchange can defer both). Figures are a year-1 estimate at your 24.0% rate — not tax advice; consult a CPA.
Schools (NCES district)
- District
- Henry County
- NCES district ID
- 1302820
- Math proficiency
- 24% ▼ -9.00%
- Reading proficiency
- 33% ▼ -7.00%
- Median HH income
- $62,594
- Composite
- 26.13/100
- National rank
- #7279
- State rank
- #89 of 174 in GA
Livability — McDonough
- Score
- 63/100
- State rank
- #279
- US rank
- #14962
Category grades
Schools grade is shown separately in the Schools card above.
Census & demographics
- Census place
- McDonough, GA
- County
- Henry County · 316,359 people
- City population
- 114,333
- Metro
- Atlanta-Sandy Springs-Alpharetta, GA
- Population (ZIP)
- 64,779
- Household income
- $81,892
- Rent vs Own
- Severe rent burden
- 2591.0
Population outlook (Henry County) Hauer SSP2
- Today (2025)
- 249,041 people
- By 2030
- 264,369 · +6.2%
- By 2040
- 294,459 · +18.2%
- By 2050
- 322,249 · +29.4%
- By 2075
- 392,310 · +57.5%
- By 2100
- 437,836 · +75.8%
Race, ethnicity, and origin ACS 2023
- Neighborhood character
- Diverse neighborhood (Simpson 0.57)
- Race & ethnicity
- Black 61% White 22% Two or more races 7% Hispanic / Latino 7% Asian 3%
- Hispanic origin (detail)
- Mexican 3%
- Common ancestry
- Hispanic 1% Lithuanian 1% Slovak 1%
- Foreign-born
- 10% · Canada, China, Vietnam
- Languages at home
- 89% English-only · Spanish 5% French/Haitian/Cajun 1% Vietnamese 1%
Political lean MEDSL · Henry
- 2024 margin
- Strong D (+29.7) · D 64.5% · R 34.9%
- 2008→2024 swing
- +37.1pp toward D · 2008: -7.5pp · 2024: 29.7pp
- All cycles
- 2024: D+29.7 2020: D+20.5 2016: D+4.3 2012: R+3.2 2008: R+7.5
Not yet ingested
- Civics
- —
Market trends
- HPI YoY
- ▼ -87.51%
- Current HPI
- 210.679
- Rent YoY
- ▼ -0.35%
- Metro
- Atlanta-Sandy Springs-Alpharetta, GA
- State GDP YoY
- ▲ 2.66%
- F500 in state
- 28
Industry mix (Fortune 500 HQ in GA)
| Industry | F500 HQs | Revenue |
|---|---|---|
| Paper / Packaging | 2 | $29B |
|
||
| Retail | 1 | $160B |
|
||
| Transportation / Logistics | 1 | $91B |
|
||
| Airlines | 1 | $62B |
|
||
| Consumer Goods | 1 | $47B |
|
||
| Utilities | 1 | $25B |
|
||
Price history
+711.3% since first listed7 events — show timeline
- 2026-04-28 Pending — GAMLS
- 2026-01-19 Listed $129,000 GAMLS
- 2011-11-10 Price Changed $14,000 GAMLS
- 2011-10-13 Price Changed $15,000 GAMLS
- 2011-09-14 Price Changed $18,000 GAMLS
- 2000-10-23 Sold (Public Records) $46,000 Public Records
- 1972-02-01 Sold (Public Records) $15,900 Public Records
Property tax history
+4.2%/yrLatest (2025): $2,122 · +16.0% YoY. Source: county tax records.
Cash-flow waterfall
monthlySold comps — $/sqft
last 12 mo · ≤1 miLoading sold comps…