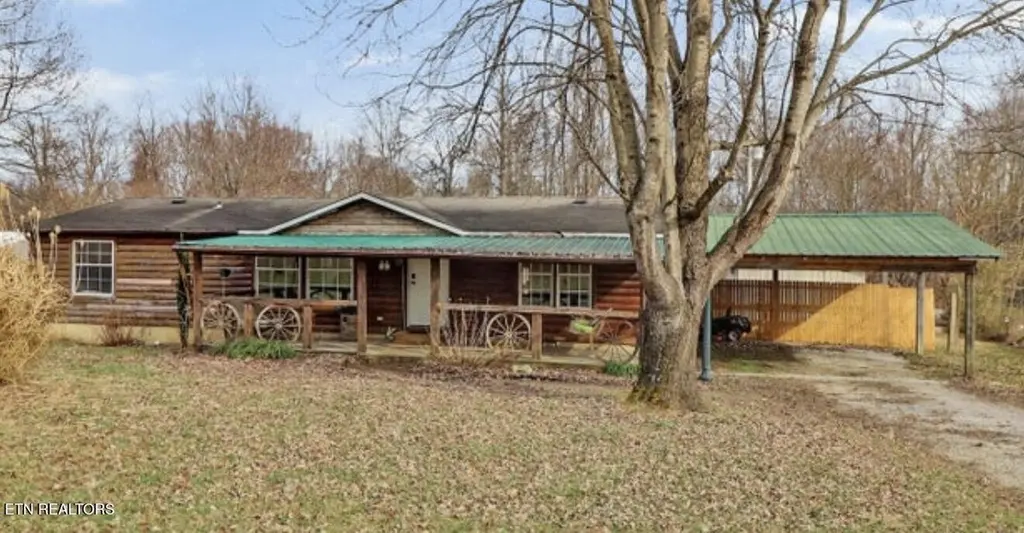
315 Wheeler Ln · Jamestown, TN
Flood risk 1/10 · Minimal
- FEMA flood zone
- X (unshaded)
- Chance of flooding over 30 yrs
- 0.0%
- Est. flood insurance / yr
- $507 – $1,088
Fire risk 6/10 · Moderate
- Est. fire insurance / yr
- $949 – $1,763
Heat risk 3/10 · Minor
- Hot days now (above 100°F)
- 7 days/yr
- Hot days in 30 yrs
- 20 days/yr
Wind risk 3/10 · Minor
- Chance of severe wind over 30 yrs
- 6.0%
Air-quality risk 2/10 · Minimal
- Unhealthy air days now
- 2 days/yr
- Unhealthy air days in 30 yrs
- 2 days/yr
Risk factors via First Street. Map © Google.
Why this score? — see what drove the D grade
The composite is a weighted blend of 9 inputs, each scored 0–100. Each bar is that input's sub-score; the figure is the points it added to the 100-point composite (weight × sub-score).
- Appreciation +10.0/10.0
- Cash flow +9.0/30.0
- ARV discount +7.5/15.0
- Livability +3.1/5.0
- 1% rule +2.7/10.0
- DSCR +2.5/10.0
- Rent growth +2.5/5.0
- Condition / age +2.5/5.0
- Schools +2.1/10.0
$200,000
🖨 Deal sheet (PDF) 📄 Offer letter ✓ Due diligence
Listing remarks MLS
Updated and remodeled 3 bedroom 2 bath modular that looks like a stick built home with carport and extra storage shed. New flooring, new electrical and lights in the kitchen and totally painted in 2025. Bath remodeled. Laundry room with washer/ dryer hookup. Large yard partially fenced. Will be resurveyed to have 1.7 acres approximately.
Key facts
- Laundry room
- Extra storage shed
- New flooring
Tags
Neighborhood map
What this means for you Summary
Snapshot
- This is a 3-bed/2.0-bath manufactured listed at $200k.
Deal economics
- At list price, monthly cash flow is $-158 ($-2k/yr) — negative.
- To cash-flow at today's rent, offer at most $177k (11.4% below list).
- To meet the 1% rule (rent ≥ 1% of price), the offer needs to be $155k (22.5% below list).
- Recommended offer: $155k (22.5% below list) — sets the bar for 1% rule.
Location & tenants
- Location reads 61/100 on livability (#250 in TN) — a middle-class / working-renter tenant base. Strengths: cost of living A+, health & safety A+; Watch: housing D, crime F, amenities F.
- Fentress County (rural): math 24% / reading 27% proficiency, ranked #91 of 139 in TN (top 66%) — low school quality limits family demand, transient renter base, plan for 1-2y turnover; 65% free/reduced lunch — lower-income household profile, screen leases tightly.
- Zoned schools: South Fentress Elementary School (math 19% / reading 25%, grade F, #601 of 952 statewide, top 66%, 632 students, 0% FRL); Clarkrange High School (math 17% / reading 44%, grade F, #73 of 332 statewide, top 22%, 260 students, 0% FRL) — zoned schools average 0% FRL vs 65% district-wide (65 pts lower); this property's tenant base skews higher-income than the district average.
- Market conditions: 325 active listings in the ZIP.
Forward outlook
- In year one you build about $21k of equity ($1k loan paydown + $20k appreciation (10.0% local appreciation)).
- Fentress County population projected at -19% by 2050 — secular population decline; favor cash flow + early exit over multi-decade hold.
- By year 2, paydown + projected appreciation supports a ~$34k cash-out refi (75% LTV) — recoverable capital for the next deal without selling this one.
Negotiation context
- It's been on market 122 days — a 12% lower offer ($176k) is reasonable based on typical stale-listing flexibility.
- 6 sale attempts since 20y ago with the ask held roughly flat each time — persistent listings suggest the price (not the market) is what's stuck; bring a comps-based counter.
- Current owner paid $125k; list at $200k implies a 60% gain — meaningful room to come down on a strong offer.
Risks & watch-outs
- Climate carrying-cost: major wildfire risk — expect insurance premiums to compound above CPI over the hold.
Questions for the listing agent
- What do current leases actually rent for vs. the listed asking? Can we see a recent rent roll and the last 12 months of T-12 income?
- It's been on market 122 days. Have you received any prior offers? Is the seller open to a 23% concession, seller financing, or rate buy-down credit?
- Why hasn't it sold? Are there any deal-killer items the seller is aware of (foundation, flood, title, zoning, code violations)?
- Is there a deadline driving the sale (1031 exchange, divorce, estate, relocation)? That informs how much negotiation room exists.
- Schools are F-rated, which usually means shorter tenancies and higher turnover. Who's the typical renter profile here, and what's been the actual vacancy rate?
- Crime grade is F in this area — have there been break-ins, vandalism, or insurance claims at this property in the last 3 years? What carrier currently insures it and at what premium?
- The area grade is low — what's the realistic commute time and amenity access for the typical tenant pool here? Any planned neighborhood developments (good or bad) we should know about?
- What's the average days-on-market for RENTAL listings here right now (not sales)? A rising rental-DOM trend means longer vacancies and softer asking-rent achievability than the comps imply.
- What's the recent tenant-quality profile in this submarket — average credit score on applications, eviction rate, late-payment / NSF rate, and stable-employment percentage? A property-management company in the area should have these aggregated.
- How much new for-sale + rental construction is in the pipeline within 1–3 miles? Heavy new supply typically softens prices + rents 12–24 months out; constrained supply supports both.
Investment metrics
- 1% rule
- 0.77% ✗
- Cap rate
- 5.35%
- Cash-on-cash
- -3.38%
- DSCR
- 0.85
- GRM
- 10.8
CMA / ARV
- ARV (on-the-fly)
- $428,220
- Comps found
- 1
Show comp detail 1 sale within ~0.75 mi
| Address | Dist | Beds/Ba | Sqft | Sold | Price | $/sf | Match |
|---|---|---|---|---|---|---|---|
| 384 Wheeler Ln | 0.28mi | 3/2.0 | 1,296 (-8%) | 17mo | $395,000 | $305 | 60 |
Match score weights: distance 35% · size 25% · config 20% · recency 20%. Top-matched comps best support the ARV.
Projected returns pro-forma
10.0% appreciation · 3.0% rent growth · sell at horizon
- IRR
- 21.9%
- Equity multiple
- 2.77×
- Total profit
- $98,893
- Equity at exit
- $180,176
- IRR
- 19.7%
- Equity multiple
- 6.34×
- Total profit
- $299,179
- Equity at exit
- $388,556
Cash invested: $56,000 (down + closing). Projections, not guarantees.
Landlord ↔ Tenant lean methodology
- Overall (STATE)
- 87 Strongly Landlord-Friendly
- State Tennessee
- 87 Strongly Landlord-Friendly · R+13
- County
- — inherits STATE
- City
- — inherits STATE
ZIP-level market 38556
- Home prices YoY
- 13.5%
- Active inventory
- 325
- Price-to-rent
- 10.8×
Monthly cashflow live
- Estimated rent
- $1,550 medium interval (Pro) →
- Mortgage (P&I)
- −$1,049
- Tax est. 1.5%
- −$250 /mo · $3,000/yr
- Insurance
- −$83
- HOA
- −$0
- Vacancy / Maint / Mgmt
- −$325
- Net cashflow
- $-158
Break-even live
Sensitivity live
| Price | -10% $-20 | -5% $-89 | +0% $-158 | +5% $-227 | +10% $-296 |
|---|---|---|---|---|---|
| Rent | -10% $-280 | -5% $-219 | +0% $-158 | +5% $-97 | +10% $-35 |
| Rate | -1.0pp $-57 | -0.5pp $-107 | base $-158 | +0.5pp $-210 | +1.0pp $-262 |
UW: 25.0% down · 7.5% · 30yr · 1.5% tax · 5.0% vac · 8.0% maint · 8.0% mgmt
Financing live
Cash to close
- Down payment
- $50,000
- Closing costs
- $6,000
- Reserves months
- —
- Total cash needed
- —
Loan-product check · same deal, 3 products live
Conventional
25% down · 7.5% · 30yr
- Down + closing
- —
- Monthly P&I
- —
- Monthly cashflow
- —
- DSCR
- —
- Eligible?
- —
Personal DTI + credit; lowest rate.
DSCR
20% down · 8.5% · 30yr
- Down + closing
- —
- Monthly P&I
- —
- Monthly cashflow
- —
- DSCR
- —
- Eligible?
- —
No personal income docs; deal must DSCR.
Hard money
10% down · 12.0% · 12mo
- Down + closing
- —
- Monthly P&I
- —
- Monthly cashflow
- —
- DSCR
- —
- Eligible?
- —
Short-term bridge; refi at stabilization.
Listing history 13 events
-
2026-05-16status Pending 340-char remark
Show marketing remark (340 chars)
Updated and remodeled 3 bedroom 2 bath modular that looks like a stick built home with carport and extra storage shed. New flooring, new electrical and lights in the kitchen and totally painted in 2025. Bath remodeled. Laundry room with washer/ dryer hookup. Large yard partially fenced. Will be resurveyed to have 1.7 acres approximately.
-
2026-01-13$200,000 Active 340-char remark
Show marketing remark (340 chars)
Updated and remodeled 3 bedroom 2 bath modular that looks like a stick built home with carport and extra storage shed. New flooring, new electrical and lights in the kitchen and totally painted in 2025. Bath remodeled. Laundry room with washer/ dryer hookup. Large yard partially fenced. Will be resurveyed to have 1.7 acres approximately.
-
2026-01-10$200,000 Active 340-char remark
Show marketing remark (340 chars)
Updated and remodeled 3 bedroom 2 bath modular that looks like a stick built home with carport and extra storage shed. New flooring, new electrical and lights in the kitchen and totally painted in 2025. Bath remodeled. Laundry room with washer/ dryer hookup. Large yard partially fenced. Will be resurveyed to have 1.7 acres approximately.
-
2024-07-15soldstatus $125,000 Closed
-
2024-07-15soldstatus $125,000
-
2024-05-23status Pending
-
2024-05-21$125,000 Active
-
2007-04-23$85,000
-
2006-10-23$79,000
-
2006-08-14soldstatus $75,000
-
2006-08-11soldstatus $75,000
-
2006-06-08$79,000
ⓘ Source: listings_history table (triggers on properties + properties_extension) + one-shot
backfill from property_details.listing_events for pre-trigger history.
Climate risk First Street
- Flood 1/10 Low FEMA zone X (unshaded) · 0% chance over 30 yrs
- Wildfire 6/10 Major
- Heat 3/10 Moderate 7 d/yr ≥100°F today · 20 d/yr by 30 yrs out
- Wind 3/10 Moderate 6% chance of damaging wind over 30 yrs
- Air quality 2/10 Low 2 unhealthy d/yr today · 2 by 30 yrs out
Nearby sold comps map
Loading sold comps map…
Walkable amenities ~0.75 mi
Loading nearby amenities…
Taxation est. · year 1
- Rental income
- $18,597
- − Mortgage interest
- −$11,203
- − Property taxes
- −$3,000
- − Insurance
- −$1,000
- − Repairs & maintenance
- −$1,488
- − Management
- −$1,488
- − Depreciation
- −$5,818
- Taxable loss
- −$5,400
- Est. tax savings @ 24.0%
- +$1,296
- After-tax cash flow
- $-598/yr
For passive investors: Depreciation is non-cash, so a rental often shows a tax loss while cash-flowing — sheltering income. Rental losses are passive: they offset passive income freely, and up to $25,000/yr can offset ordinary (W-2) income if you actively participate and your MAGI is under $100k (phasing out to $0 by $150k); unused losses carry forward. On sale, claimed depreciation is recaptured at up to 25%, and gains may owe capital-gains tax (a 1031 exchange can defer both). Figures are a year-1 estimate at your 24.0% rate — not tax advice; consult a CPA.
Schools (NCES district)
- District
- Fentress County
- NCES district ID
- 4701230
- Math proficiency
- 24% ▼ -13.00%
- Reading proficiency
- 27% ▼ -8.00%
- Median HH income
- $30,419
- Composite
- 20.6/100
- National rank
- #8552
- State rank
- #91 of 139 in TN
Livability — Jamestown
- Score
- 61/100
- State rank
- #250
- US rank
- #17976
Category grades
Schools grade is shown separately in the Schools card above.
Census & demographics
- Population (ZIP)
- 12,531
Population outlook (Fentress County) Hauer SSP2
- Today (2025)
- 17,295 people
- By 2030
- 16,749 · -3.2%
- By 2040
- 15,443 · -10.7%
- By 2050
- 14,077 · -18.6%
- By 2075
- 11,482 · -33.6%
- By 2100
- 9,658 · -44.2%
Race, ethnicity, and origin ACS 2023
- Neighborhood character
- Predominantly White (96%)
- Race & ethnicity
- White 96% Two or more races 3% Hispanic / Latino 1%
- Common ancestry
- Serbian 3% Lithuanian 2% Iranian 1%
- Foreign-born
- 1% · Canada
- Languages at home
- 99% English-only · Spanish 1%
Political lean MEDSL · Fentress
- 2024 margin
- Solid R (+75.8) · D 11.8% · R 87.6%
- 2008→2024 swing
- -31.9pp toward R · 2008: -43.9pp · 2024: -75.8pp
- All cycles
- 2024: R+75.8 2020: R+71.3 2016: R+67.5 2012: R+53.4 2008: R+43.9
Not yet ingested
- Civics
- —
Market trends
- HPI YoY
- ▲ 44.31%
- Current HPI
- 372.5676
- Rent YoY
- —
- Metro
- —
- State GDP YoY
- ▲ 2.78%
- F500 in state
- 22
Industry mix (Fortune 500 HQ in TN)
| Industry | F500 HQs | Revenue |
|---|---|---|
| Healthcare | 3 | $91B |
|
||
| Retail | 3 | $72B |
|
||
| Transportation / Logistics | 1 | $88B |
|
||
| Paper / Packaging | 1 | $19B |
|
||
| Insurance | 1 | $13B |
|
||
| Energy | 1 | $12B |
|
||
Price history
+153.2% since first listed13 events — show timeline
- 2026-05-16 Pending — REALTRACS as Distributed by MLS Grid
- 2026-05-16 Pending — Knoxville MLS
- 2026-01-13 Listed $200,000 REALTRACS as Distributed by MLS Grid
- 2026-01-10 Listed $200,000 Knoxville MLS
- 2024-07-15 Sold (Public Records) $125,000 Public Records
- 2024-07-15 Sold (MLS) $125,000 Knoxville MLS
- 2024-05-23 Pending — Knoxville MLS
- 2024-05-21 Listed $125,000 Knoxville MLS
- 2007-04-23 Listed $85,000 Knoxville MLS
- 2006-10-23 Listed $79,000 Knoxville MLS
- 2006-08-14 Sold (Public Records) $75,000 Public Records
- 2006-08-11 Sold (MLS) $75,000 Knoxville MLS
- 2006-06-08 Listed $79,000 Knoxville MLS
Property tax history
-3.3%/yrLatest (2025): $248 · +0.0% YoY. Source: county tax records.
Cash-flow waterfall
monthlySold comps — $/sqft
last 12 mo · ≤1 miLoading sold comps…