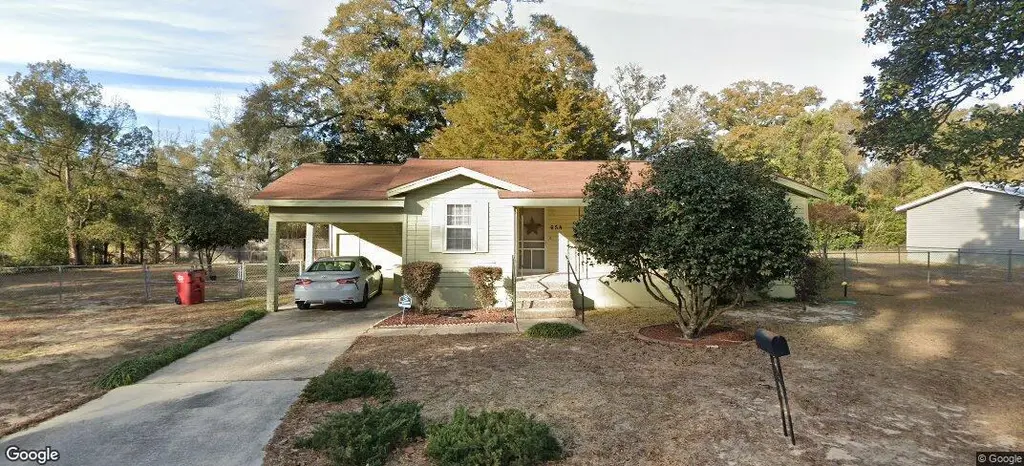
658 W Griffith Ave · Crestview, FL
Flood risk 1/10 · Minimal
- FEMA flood zone
- X (unshaded)
- Chance of flooding over 30 yrs
- 0.0%
- Est. flood insurance / yr
- $507 – $1,088
Fire risk 2/10 · Minimal
- Est. fire insurance / yr
- $947 – $1,759
Heat risk 9/10 · Severe
- Hot days now (above 107°F)
- 7 days/yr
- Hot days in 30 yrs
- 20 days/yr
Wind risk 9/10 · Severe
- Chance of severe wind over 30 yrs
- 99.0%
Air-quality risk 2/10 · Minimal
- Unhealthy air days now
- 1 days/yr
- Unhealthy air days in 30 yrs
- 1 days/yr
Risk factors via First Street. Map © Google.
Why this score? — see what drove the C grade
The composite is a weighted blend of 9 inputs, each scored 0–100. Each bar is that input's sub-score; the figure is the points it added to the 100-point composite (weight × sub-score).
- Cash flow +27.3/30.0
- DSCR +9.5/10.0
- 1% rule +6.2/10.0
- Schools +5.2/10.0
- Livability +3.8/5.0
- Rent growth +2.8/5.0
- Condition / age +2.5/5.0
- ARV discount +0.0/15.0
- Appreciation +0.0/10.0
$125,000
🖨 Deal sheet (PDF) 📄 Offer letter ✓ Due diligence
Listing remarks MLS
This cozy home is a diamond in the rough, full of character and waiting for someone with a vision to make it shine. While it needs repairs and updates, it offers a welcoming layout, generous room sizes, a solid foundation, and the added comfort of central AC and heat. Enjoy a spacious backyard perfect for future outdoor living, all in a convenient location near downtown, schools, and local amenities. Whether you're a DIY enthusiast or looking to create your dream space, this home is ready for its next chapter.
Key facts
- Central ac
- Spacious backyard
- Convenient location
Tags
Neighborhood map
What this means for you Summary
Snapshot
- This is a 2-bed/2.0-bath single-family listed at $125k.
Deal economics
- At list price, monthly cash flow is $360 ($4k/yr) — positive.
- The deal already cash-flows at list — no discount required.
- Meets the 1% rule at list price ($1k rent vs $125k).
- Recommended offer: $110k (12.0% below list) — sets the bar for market timing.
- Cap rate 9.7% vs local median 4.4% in Crestview — top-decile yield for the area; either an underpriced asset or a hidden risk that comps aren't pricing in. Stress-test before assuming the spread holds.
Location & tenants
- Location reads 75/100 on livability (#252 in FL, #3,858 nationally) — a middle-class / working-renter tenant base. Strengths: cost of living A+, housing A+, health & safety A+; Watch: employment D, amenities F, commute F.
- Okaloosa (other): math 60% / reading 60% proficiency, ranked #12 of 73 in FL (top 16%) — acceptable for families but not a draw, mixed tenant base, ~2y average lease.
- Market conditions: Rents rising (+1.2%/yr); 351 active listings in the ZIP; 14 comparable units currently listed for rent nearby; rentals lingering (median 45d on market — plan ~5-8 weeks vacancy on turnover, expect pricing pressure); 57% of comp listings sitting > 30 days — soft ceiling on asking rent; solid renter incomes; 1,268 units permitted in Okaloosa County in 2024 (175 in 5+ unit buildings).
Forward outlook
- Local home prices are declining (-3.0%/yr); year-one equity from $864 of loan paydown is wiped out by about $4k of value loss. Plan a longer hold.
- Okaloosa County population projected at +37% by 2050 — long-run rental-demand tailwind backs the buy-and-hold thesis.
Negotiation context
- It's been on market 134 days — a 12% lower offer ($110k) is reasonable based on typical stale-listing flexibility.
Risks & watch-outs
- Watch-outs: built in 1944 — expect roof / HVAC / electrical / plumbing capex.
- Climate carrying-cost: severe wind risk, 99% chance of damaging wind over 30y; extreme-heat days projected 7→20/yr by 2055 (HVAC capex compounding) — expect insurance premiums to compound above CPI over the hold.
Questions for the listing agent
- It's been on market 134 days. Have you received any prior offers? Is the seller open to a 12% concession, seller financing, or rate buy-down credit?
- Built in 1944 — when were the roof, HVAC, electrical panel, plumbing, and water heater last replaced?
- Why hasn't it sold? Are there any deal-killer items the seller is aware of (foundation, flood, title, zoning, code violations)?
- Is there a deadline driving the sale (1031 exchange, divorce, estate, relocation)? That informs how much negotiation room exists.
- Schools are B-rated — typically a magnet for longer-tenancy family renters. What's the average tenant stay here, and is there a school-zone premium baked into asking?
- What's the average days-on-market for RENTAL listings here right now (not sales)? A rising rental-DOM trend means longer vacancies and softer asking-rent achievability than the comps imply.
- What's the recent tenant-quality profile in this submarket — average credit score on applications, eviction rate, late-payment / NSF rate, and stable-employment percentage? A property-management company in the area should have these aggregated.
- How much new for-sale + rental construction is in the pipeline within 1–3 miles? Heavy new supply typically softens prices + rents 12–24 months out; constrained supply supports both.
Investment metrics
- 1% rule
- 1.12% ✓
- Cap rate
- 9.75%
- Cash-on-cash
- 12.34%
- DSCR
- 1.55
- GRM
- 7.5
CMA / ARV
- ARV (median comp)
- $90,382
- List price
- $125,000
- Delta
- 38.30%
- Verdict
- OVERPRICED
- Comps
- 20 within 1.0 mi
Show comp detail 7 sales within ~0.75 mi
| Address | Dist | Beds/Ba | Sqft | Sold | Price | $/sf | Match |
|---|---|---|---|---|---|---|---|
| 228 Cross Dr | 0.40mi | 3/1.0 (+1) | 888 (-3%) | 2mo | $37,500 | $42 | 66 |
| 271 N Booker St | 0.33mi | 2/1.0 | 884 (-4%) | 20mo | $54,900 | $62 | 58 |
| 705 School Ave | 0.21mi | 2/1.0 | 1,026 (+12%) | 12mo | $90,000 | $88 | 56 |
| 725 School Ave Ave | 0.25mi | 3/1.0 (+1) | 792 (-14%) | 4mo | $145,000 | $183 | 54 |
| 1018 S Wilson St | 0.46mi | 3/1.0 (+1) | 1,032 (+13%) | 11mo | $60,000 | $58 | 39 |
| 396 E Cobb Ave | 0.59mi | 2/1.0 | 972 (+6%) | 24mo | $126,500 | $130 | 38 |
| 133 Cabana Way | 0.75mi | 3/2.0 (+1) | 1,032 (+13%) | 15mo | $210,000 | $203 | 27 |
Match score weights: distance 35% · size 25% · config 20% · recency 20%. Top-matched comps best support the ARV.
Projected returns pro-forma
-3.0% appreciation · 1.17% rent growth · sell at horizon
- IRR
- 0.1%
- Equity multiple
- 1.00×
- Total profit
- $93
- Equity at exit
- $18,638
- IRR
- 7.9%
- Equity multiple
- 1.55×
- Total profit
- $19,407
- Equity at exit
- $10,808
Cash invested: $35,000 (down + closing). Projections, not guarantees.
Landlord ↔ Tenant lean methodology
- Overall (STATE)
- 87 Strongly Landlord-Friendly
- State Florida
- 87 Strongly Landlord-Friendly · R+3
- County
- — inherits STATE
- City
- — inherits STATE
ZIP-level market 32536
- Home prices YoY
- -16.2%
- Rents YoY
- 1.2%
- Active inventory
- 351
- Price-to-rent
- 7.5×
Monthly cashflow live
- Estimated rent
- $1,394 high interval (Pro) →
- Mortgage (P&I)
- −$656
- Tax from tax record
- −$34 /mo · $409/yr
- Insurance
- −$52
- HOA
- −$0
- Vacancy / Maint / Mgmt
- −$293
- Net cashflow
- $360
Break-even live
Sensitivity live
| Price | -10% $431 | -5% $395 | +0% $360 | +5% $325 | +10% $289 |
|---|---|---|---|---|---|
| Rent | -10% $250 | -5% $305 | +0% $360 | +5% $415 | +10% $470 |
| Rate | -1.0pp $423 | -0.5pp $392 | base $360 | +0.5pp $328 | +1.0pp $295 |
UW: 25.0% down · 7.5% · 30yr · 1.5% tax · 5.0% vac · 8.0% maint · 8.0% mgmt
Financing live
Cash to close
- Down payment
- $31,250
- Closing costs
- $3,750
- Reserves months
- —
- Total cash needed
- —
Loan-product check · same deal, 3 products live
Conventional
25% down · 7.5% · 30yr
- Down + closing
- —
- Monthly P&I
- —
- Monthly cashflow
- —
- DSCR
- —
- Eligible?
- —
Personal DTI + credit; lowest rate.
DSCR
20% down · 8.5% · 30yr
- Down + closing
- —
- Monthly P&I
- —
- Monthly cashflow
- —
- DSCR
- —
- Eligible?
- —
No personal income docs; deal must DSCR.
Hard money
10% down · 12.0% · 12mo
- Down + closing
- —
- Monthly P&I
- —
- Monthly cashflow
- —
- DSCR
- —
- Eligible?
- —
Short-term bridge; refi at stabilization.
Rent comps 14 comps
| Address | Beds | Baths | Sqft | Rent | $/sqft | DOM | Units | Dist |
|---|---|---|---|---|---|---|---|---|
| 503 W Griffith Ave Crestview, FL | 3.0 | 1.0 | 962 | $1,395 | $1.45 | 45d | 1 | 0.14mi |
| 401 S Booker St Crestview, FL | 3.0 | 1.5 | 1040 | $1,225 | $1.18 | 45d | 1 | 0.17mi |
| 650 Blakely Ave Crestview, FL | 2.0 | 1.0 | 648 | $1,000 | $1.54 | 15d | 1 | 0.29mi |
| 168 Cabana Way Crestview, FL | 3.0 | 2.0 | 1100 | $1,700 | $1.55 | 22d | 1 | 0.66mi |
| 408 Church St Crestview, FL | 2.0 | 2.0 | 1086 | $1,200 | $1.10 | 45d | 1 | 0.75mi |
| 475 Aplin Rd Crestview, FL | 1.0–2.0 | 1.0–2.0 | 764 | $999 | $1.31 | 45d | 5 | 1.14mi |
| 498 North Ave E Unit A Crestview, FL | 2.0 | 2.0 | 1081 | $1,450 | $1.34 | 45d | 1 | 1.21mi |
| 812 E Edney Ave Crestview, FL | 2.0 | 2.0 | 1024 | $1,400 | $1.37 | 46d | 1 | 1.23mi |
| 812 E Edney Ave Crestview, FL | 2.0 | 2.0 | 1024 | $1,400 | $1.37 | 22d | 1 | 1.23mi |
| 720 Arbor Lake Dr Crestview, FL | 2.0 | 2.5 | 1100 | $1,400 | $1.27 | 45d | 1 | 1.28mi |
| 720 Arbor Lake Dr Crestview, FL | 2.0 | 2.5 | 1100 | $1,375 | $1.25 | 22d | 1 | 1.28mi |
| 257 Lindberg St Crestview, FL | 2.0 | 1.0 | 832 | $1,100 | $1.32 | 45d | 1 | 1.29mi |
| 301 E Redstone Ave Crestview, FL | 1.0–3.0 | 1.0–2.0 | 1100 | $1,731 | $1.57 | 15d | 20 | 1.38mi |
| 800 Spring Creek Blvd Crestview, FL | 1.0–3.0 | 1.0–2.0 | 1009 | $1,538 | $1.52 | 15d | 28 | 1.40mi |
Listing history 3 events
-
2026-05-18status Pending 515-char remark
Show marketing remark (515 chars)
This cozy home is a diamond in the rough, full of character and waiting for someone with a vision to make it shine. While it needs repairs and updates, it offers a welcoming layout, generous room sizes, a solid foundation, and the added comfort of central AC and heat. Enjoy a spacious backyard perfect for future outdoor living, all in a convenient location near downtown, schools, and local amenities. Whether you're a DIY enthusiast or looking to create your dream space, this home is ready for its next chapter.
-
2026-02-26price $125,000 515-char remark
Show marketing remark (515 chars)
This cozy home is a diamond in the rough, full of character and waiting for someone with a vision to make it shine. While it needs repairs and updates, it offers a welcoming layout, generous room sizes, a solid foundation, and the added comfort of central AC and heat. Enjoy a spacious backyard perfect for future outdoor living, all in a convenient location near downtown, schools, and local amenities. Whether you're a DIY enthusiast or looking to create your dream space, this home is ready for its next chapter.
-
2025-12-15$130,000 Active 515-char remark
Show marketing remark (515 chars)
This cozy home is a diamond in the rough, full of character and waiting for someone with a vision to make it shine. While it needs repairs and updates, it offers a welcoming layout, generous room sizes, a solid foundation, and the added comfort of central AC and heat. Enjoy a spacious backyard perfect for future outdoor living, all in a convenient location near downtown, schools, and local amenities. Whether you're a DIY enthusiast or looking to create your dream space, this home is ready for its next chapter.
ⓘ Source: listings_history table (triggers on properties + properties_extension) + one-shot
backfill from property_details.listing_events for pre-trigger history.
Tax reassessment forecast FL · Resets to sale price
- Current annual tax
- $409 · $34/mo
- Projected year-2 tax
- $1,038 · $86/mo
- Expected delta
- +$629/yr (+$52/mo · 153.8%)
ⓘ Screening estimate from a state-policy table — verify with the county assessor before closing.
Climate risk First Street
- Flood 1/10 Low FEMA zone X (unshaded) · 0% chance over 30 yrs
- Wildfire 2/10 Low
- Heat 9/10 Extreme 7 d/yr ≥107°F today · 20 d/yr by 30 yrs out
- Wind 9/10 Extreme 99% chance of damaging wind over 30 yrs
- Air quality 2/10 Low 1 unhealthy d/yr today · 1 by 30 yrs out
Nearby sold comps map
Loading sold comps map…
Walkable amenities ~0.75 mi
Loading nearby amenities…
Taxation est. · year 1
- Rental income
- $16,733
- − Mortgage interest
- −$7,002
- − Property taxes
- −$409
- − Insurance
- −$625
- − Repairs & maintenance
- −$1,339
- − Management
- −$1,339
- − Depreciation
- −$3,636
- Taxable income
- $2,384
- Est. tax owed @ 24.0%
- −$572
- After-tax cash flow
- $3,747/yr
For passive investors: Depreciation is non-cash, so a rental often shows a tax loss while cash-flowing — sheltering income. Rental losses are passive: they offset passive income freely, and up to $25,000/yr can offset ordinary (W-2) income if you actively participate and your MAGI is under $100k (phasing out to $0 by $150k); unused losses carry forward. On sale, claimed depreciation is recaptured at up to 25%, and gains may owe capital-gains tax (a 1031 exchange can defer both). Figures are a year-1 estimate at your 24.0% rate — not tax advice; consult a CPA.
Schools (NCES district)
- District
- Okaloosa
- NCES district ID
- 1201380
- Math proficiency
- 60% ▼ -12.00%
- Reading proficiency
- 60% ▼ -4.00%
- Median HH income
- $55,601
- Composite
- 51.62/100
- National rank
- #1705
- State rank
- #12 of 73 in FL
Livability — Crestview
- Score
- 75/100
- State rank
- #252
- US rank
- #3858
Category grades
Schools grade is shown separately in the Schools card above.
Census & demographics
- Census place
- Crestview, FL
- County
- Okaloosa County · 194,352 people
- City population
- 58,889
- Metro
- Crestview-Fort Walton Beach-Destin, FL
- Population (ZIP)
- 25,599
- Household income
- $78,119
- Rent vs Own
- Severe rent burden
- 634.0
Population outlook (Okaloosa County) Hauer SSP2
- Today (2025)
- 235,133 people
- By 2030
- 253,483 · +7.8%
- By 2040
- 289,537 · +23.1%
- By 2050
- 322,954 · +37.3%
- By 2075
- 399,624 · +70.0%
- By 2100
- 425,311 · +80.9%
Race, ethnicity, and origin ACS 2023
- Neighborhood character
- Diverse neighborhood (Simpson 0.56)
- Race & ethnicity
- White 64% Black 16% Hispanic / Latino 12% Two or more races 9% Asian 3%
- Hispanic origin (detail)
- Mexican 4% Puerto Rican 2% Dominican 1%
- Common ancestry
- Lithuanian 2% Slovak 2% Italian 2%
- Foreign-born
- 6% · Canada, South Korea
- Languages at home
- 91% English-only · Spanish 7% Tagalog/Filipino 1%
Political lean MEDSL · Okaloosa
- 2024 margin
- Solid R (+42.4) · D 28.2% · R 70.7% · Other 1.1%
- 2008→2024 swing
- +2.5pp toward D · 2008: -44.9pp · 2024: -42.4pp
- All cycles
- 2024: R+42.4 2020: R+39.1 2016: R+47.8 2012: R+49.4 2008: R+44.9
Not yet ingested
- Civics
- —
Market trends
- HPI YoY
- ▼ -51.48%
- Current HPI
- 265.9926
- Rent YoY
- ▲ 1.17%
- Metro
- Crestview-Fort Walton Beach-Destin, FL
- State GDP YoY
- ▲ 3.28%
- F500 in state
- 36
Industry mix (Fortune 500 HQ in FL)
| Industry | F500 HQs | Revenue |
|---|---|---|
| Industrial Technology | 2 | $29B |
|
||
| Insurance | 2 | $17B |
|
||
| Retail | 1 | $60B |
|
||
| Technology Distribution | 1 | $58B |
|
||
| Homebuilding | 1 | $35B |
|
||
| Technology Manufacturing | 1 | $35B |
|
||
Price history
-3.8% since first listed3 events — show timeline
- 2026-05-18 Pending — ECAR
- 2026-02-26 Price Changed $125,000 ECAR
- 2025-12-15 Listed $130,000 ECAR
Property tax history
-4.3%/yrLatest (2025): $409 · +1.3% YoY. Source: county tax records.
Cash-flow waterfall
monthlySold comps — $/sqft
last 12 mo · ≤1 miLoading sold comps…