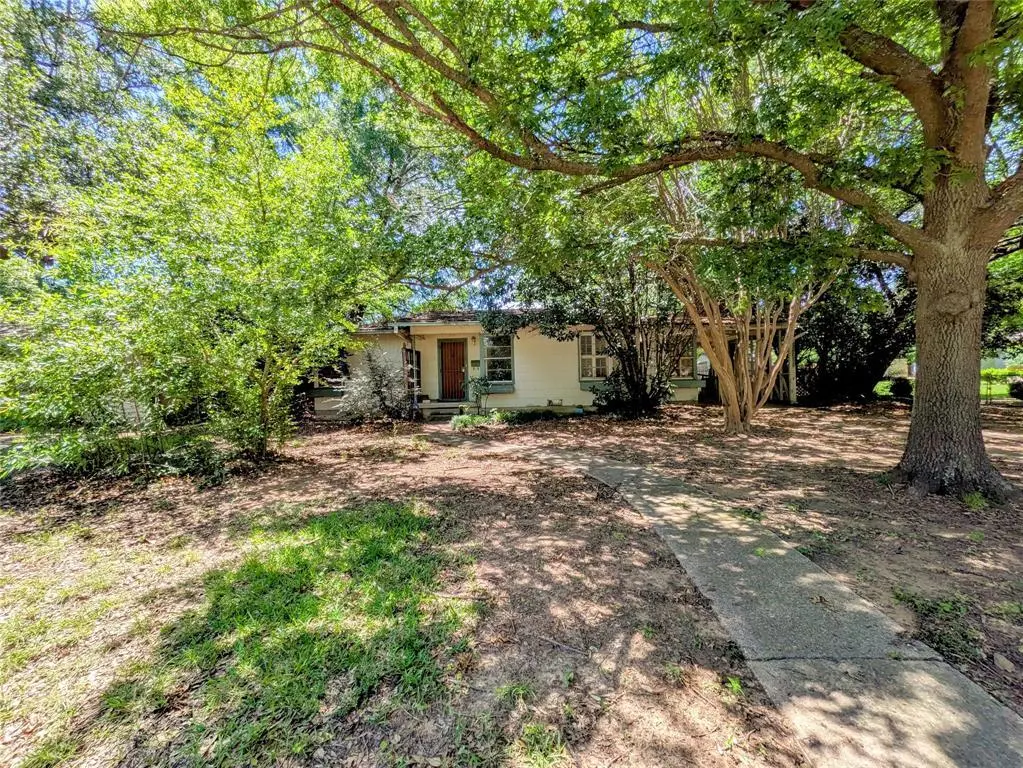
108 Varsity Cir · Arlington, TX
Flood risk 1/10 · Minimal
- FEMA flood zone
- X (unshaded)
- Chance of flooding over 30 yrs
- 0.0%
- Est. flood insurance / yr
- $507 – $1,088
Fire risk 1/10 · Minimal
- Est. fire insurance / yr
- $1,222 – $2,270
Heat risk 7/10 · Major
- Hot days now (above 109°F)
- 7 days/yr
- Hot days in 30 yrs
- 23 days/yr
Wind risk 6/10 · Moderate
- Chance of severe wind over 30 yrs
- 27.0%
Air-quality risk 3/10 · Minor
- Unhealthy air days now
- 2 days/yr
- Unhealthy air days in 30 yrs
- 4 days/yr
Risk factors via First Street. Map © Google.
Why this score? — see what drove the C- grade
The composite is a weighted blend of 9 inputs, each scored 0–100. Each bar is that input's sub-score; the figure is the points it added to the 100-point composite (weight × sub-score).
- Cash flow +15.0/30.0
- ARV discount +15.0/15.0
- 1% rule +5.2/10.0
- DSCR +4.6/10.0
- Livability +3.9/5.0
- Rent growth +2.5/5.0
- Schools +2.5/10.0
- Condition / age +2.5/5.0
- Appreciation +0.0/10.0
$175,000
🖨 Deal sheet (PDF) 📄 Offer letter ✓ Due diligence
Listing remarks
Handyman or investor special in central Arlington on a generous . 306 acre lot with huge shade trees, original hardwood flooring and tons of potential within walking distance to the University of Texas-Arlington!!! Cash or Conventional offers ONLY & expect multiple offers - HOME BEING SOLD AS IS-NO REPAIRS.
Key facts
- Generous lot
- 0.31 acre lot
- Parking
Tags
Property features AI
Finance
- Other: Parcel number: 00570605; Subdivision: College Hills Arlington
- Financial info: Treat as clear loan type; No second mortgage indicated
- HOA & community: No HOA (Association type: None)
Exterior
- Parking: Attached carport; 1 carport space (covered)
- Utilities: City sewer; City water; Electricity available; Natural gas available
- Home design: Single family residence; Residential property; One story; Not attached to another property
- Construction: Built in 1951; Pillar/post/pier foundation
- Exterior features: Large backyard with grass; Many trees; Accessible approach with ramp
Interior
- Kitchen: Gas range
- Bedrooms: 2 bedrooms (both on main level)
- Bathrooms: 1 full bathroom
- Heating & cooling: Central heating (natural gas); Central air conditioning (electric)
- Interior features: Cable TV available; 6 total rooms; Two living areas; One dining area; Single-level (One)
- Laundry & utility: No specific laundry details provided
Neighborhood map
What this means for you Summary
Snapshot
- This is a 3-bed/1.0-bath single-family listed at $175k.
Deal economics
- At list price, monthly cash flow is $55 ($663/yr) — positive.
- The deal already cash-flows at list — no discount required.
- Meets the 1% rule at list price ($2k rent vs $175k).
- Cap rate 6.7% vs local median 3.6% in Arlington — top-decile yield for the area; either an underpriced asset or a hidden risk that comps aren't pricing in. Stress-test before assuming the spread holds.
Location & tenants
- Location reads 78/100 on livability (#75 in TX, #2,697 nationally) — a middle-class / working-renter tenant base. Strengths: amenities A+, cost of living A+, housing A+; Watch: crime F, commute F.
- Arlington ISD (urban): math 24% / reading 34% proficiency, ranked #629 of 826 in TX (top 76%) — low school quality limits family demand, transient renter base, plan for 1-2y turnover.
- Zoned schools: Swift El (math 16% / reading 20%, grade F, #3,785 of 4,322 statewide, top 88%, 552 students, 82% FRL); Bailey J H (math 26% / reading 40%, grade F, #930 of 1,662 statewide, top 57%, 762 students, 66% FRL); Arlington H S (math 24% / reading 48%, grade F, #930 of 1,632 statewide, top 57%, 2,538 students, 67% FRL).
- Market conditions: Rents soft (-0.1%/yr); 148 active listings in the ZIP; 40 comparable units currently listed for rent nearby; rentals at typical pace (median 27d on market — plan ~3-4 weeks tenant-placement turnaround); 42% of comp listings sitting > 30 days — soft ceiling on asking rent; 18,938 units permitted in Tarrant County in 2024 (8,336 in 5+ unit buildings).
- This rent runs 30% of the median local income ($70k/yr) — at the standard rent-burdened threshold; future hikes will face affordability resistance.
Forward outlook
- Local home prices are declining (-3.0%/yr); year-one equity from $1k of loan paydown is wiped out by about $5k of value loss. Plan a longer hold.
- Tarrant County population projected at +41% by 2050 — long-run rental-demand tailwind backs the buy-and-hold thesis.
Negotiation context
- Only 5 days on market — expect competitive offers; lowballing is unlikely to land.
Risks & watch-outs
- Watch-outs: property tax is 2.5% of price; built in 1951 — expect roof / HVAC / electrical / plumbing capex.
- Climate carrying-cost: major wind risk, 27% chance of damaging wind over 30y; extreme-heat days projected 7→23/yr by 2055 (HVAC capex compounding) — expect insurance premiums to compound above CPI over the hold.
Questions for the listing agent
- Built in 1951 — when were the roof, HVAC, electrical panel, plumbing, and water heater last replaced?
- Property tax is high relative to price — has the assessment been appealed recently, and will the sale trigger a re-assessment?
- Is there a deadline driving the sale (1031 exchange, divorce, estate, relocation)? That informs how much negotiation room exists.
- Schools are D-rated, which usually means shorter tenancies and higher turnover. Who's the typical renter profile here, and what's been the actual vacancy rate?
- Crime grade is F in this area — have there been break-ins, vandalism, or insurance claims at this property in the last 3 years? What carrier currently insures it and at what premium?
- What's the average days-on-market for RENTAL listings here right now (not sales)? A rising rental-DOM trend means longer vacancies and softer asking-rent achievability than the comps imply.
- What's the recent tenant-quality profile in this submarket — average credit score on applications, eviction rate, late-payment / NSF rate, and stable-employment percentage? A property-management company in the area should have these aggregated.
- How much new for-sale + rental construction is in the pipeline within 1–3 miles? Heavy new supply typically softens prices + rents 12–24 months out; constrained supply supports both.
Investment metrics
- 1% rule
- 1.02% ✓
- Cap rate
- 6.67%
- Cash-on-cash
- 1.35%
- DSCR
- 1.06
- GRM
- 8.2
CMA / ARV
- ARV (on-the-fly)
- $260,690
- Comps found
- 12
Show comp detail 12 sales within ~0.75 mi
| Address | Dist | Beds/Ba | Sqft | Sold | Price | $/sf | Match |
|---|---|---|---|---|---|---|---|
| 108 Varsity Cir | 0.00mi | 2/1.0 (-1) | 1,310 (0%) | 0mo | $175,000 | $134 | 95 |
| 203 Sunset Ct | 0.59mi | 3/2.0 | 1,350 (+3%) | 0mo | $295,000 | $219 | 63 |
| 1307 Paxton Ave | 0.21mi | 3/2.0 | 1,450 (+11%) | 13mo | $350,000 | $241 | 58 |
| 1205 Marshalldale Dr | 0.72mi | 4/1.0 (+1) | 1,364 (+4%) | 2mo | $239,000 | $175 | 53 |
| 1202 Marydale Dr | 0.72mi | 3/2.0 | 1,335 (+2%) | 15mo | $253,000 | $190 | 47 |
| 1511 Elizabeth St | 0.60mi | 3/2.0 | 1,437 (+10%) | 9mo | $350,000 | $244 | 45 |
| 1127 W Inwood Dr | 0.71mi | 3/1.5 | 1,232 (-6%) | 14mo | $245,000 | $199 | 43 |
| 1517 Larkspur Dr | 0.74mi | 3/2.0 | 1,384 (+6%) | 13mo | $200,000 | $145 | 41 |
| 1210 Britt Dr | 0.61mi | 4/2.0 (+1) | 1,446 (+10%) | 12mo | $275,000 | $190 | 35 |
| 1717 W 2nd St | 0.74mi | 3/2.0 | 1,473 (+12%) | 7mo | $300,000 | $204 | 34 |
| 1512 Larkspur Dr | 0.74mi | 3/2.0 | 1,469 (+12%) | 9mo | $285,000 | $194 | 34 |
| 1215 Marydale Dr | 0.65mi | 3/1.0 | 1,122 (-14%) | 19mo | $230,000 | $205 | 30 |
Match score weights: distance 35% · size 25% · config 20% · recency 20%. Top-matched comps best support the ARV.
Projected returns pro-forma
-3.0% appreciation · 0.0% rent growth · sell at horizon
- IRR
- -17.9%
- Equity multiple
- 0.39×
- Total profit
- $-29,958
- Equity at exit
- $26,093
- IRR
- -18.4%
- Equity multiple
- 0.16×
- Total profit
- $-41,321
- Equity at exit
- $15,131
Cash invested: $49,000 (down + closing). Projections, not guarantees.
Landlord ↔ Tenant lean methodology
- Overall (STATE)
- 87 Strongly Landlord-Friendly
- State Texas
- 87 Strongly Landlord-Friendly · R+5
- County
- — inherits STATE
- City
- — inherits STATE
ZIP-level market 76013
- Rents YoY
- -0.1%
- Active inventory
- 148
- Price-to-rent
- 8.2×
Monthly cashflow live
- Estimated rent
- $1,788 high interval (Pro) →
- Mortgage (P&I)
- −$918
- Tax from tax record
- −$366 /mo · $4,395/yr
- Insurance
- −$73
- HOA
- −$0
- Vacancy / Maint / Mgmt
- −$375
- Net cashflow
- $55
Break-even live
Sensitivity live
| Price | -10% $154 | -5% $105 | +0% $55 | +5% $6 | +10% $-44 |
|---|---|---|---|---|---|
| Rent | -10% $-86 | -5% $-15 | +0% $55 | +5% $126 | +10% $196 |
| Rate | -1.0pp $143 | -0.5pp $100 | base $55 | +0.5pp $10 | +1.0pp $-36 |
UW: 25.0% down · 7.5% · 30yr · 1.5% tax · 5.0% vac · 8.0% maint · 8.0% mgmt
Financing live
Cash to close
- Down payment
- $43,750
- Closing costs
- $5,250
- Reserves months
- —
- Total cash needed
- —
Loan-product check · same deal, 3 products live
Conventional
25% down · 7.5% · 30yr
- Down + closing
- —
- Monthly P&I
- —
- Monthly cashflow
- —
- DSCR
- —
- Eligible?
- —
Personal DTI + credit; lowest rate.
DSCR
20% down · 8.5% · 30yr
- Down + closing
- —
- Monthly P&I
- —
- Monthly cashflow
- —
- DSCR
- —
- Eligible?
- —
No personal income docs; deal must DSCR.
Hard money
10% down · 12.0% · 12mo
- Down + closing
- —
- Monthly P&I
- —
- Monthly cashflow
- —
- DSCR
- —
- Eligible?
- —
Short-term bridge; refi at stabilization.
Rent comps 40 comps
| Address | Beds | Baths | Sqft | Rent | $/sqft | DOM | Units | Dist |
|---|---|---|---|---|---|---|---|---|
| 1000 W Mitchell St Arlington, TX | 1.0–2.0 | 1.0–1.5 | 865 | $1,250 | $1.45 | 0d | 22 | 0.13mi |
| 1119 W Park Row Dr Arlington, TX | 2.0 | 1.0 | 1243 | $1,649 | $1.33 | 5d | 1 | 0.38mi |
| 710 Benge Dr Unit 712-G Arlington, TX | 2.0 | 2.5 | 1308 | $2,100 | $1.61 | 26d | 1 | 0.42mi |
| 710 Benge Dr Unit 712-D Arlington, TX | 2.0 | 2.5 | 1280 | $1,975 | $1.54 | 26d | 1 | 0.42mi |
| 710 Benge Dr Arlington, TX | 2.0 | 3.0 | 1280 | $2,100 | $1.64 | 45d | 1 | 0.42mi |
| 710 Benge Dr Unit 712-C Arlington, TX | 2.0 | 2.5 | 1280 | $1,975 | $1.54 | 24d | 1 | 0.42mi |
| 710 Benge Dr Unit C Arlington, TX | 2.0 | 2.5 | 1280 | $1,975 | $1.54 | 45d | 1 | 0.42mi |
| 710 Benge Dr Unit 710-E Arlington, TX | 2.0 | 2.5 | 1308 | $2,100 | $1.61 | 45d | 1 | 0.42mi |
| 412 Summit Ave Arlington, TX | 1.0–2.0 | 1.0–1.5 | 962 | $1,250 | $1.30 | 0d | 8 | 0.43mi |
| 412 Summit Ave Arlington, TX | 1.0–2.0 | 1.0 | 830 | $1,375 | $1.66 | 45d | 4 | 0.43mi |
| 1121 Uta Blvd Arlington, TX | 2.0–4.0 | 2.0–4.0 | 1185 | $820 | $0.69 | 0d | 76 | 0.52mi |
| 600 Grand Ave Unit 112 Arlington, TX | 2.0 | 1.0 | 1100 | $1,275 | $1.16 | 45d | 1 | 0.60mi |
| 600 Grand Ave Unit 112 Arlington, TX | 2.0 | 1.0 | 1100 | $1,275 | $1.16 | 3d | 1 | 0.60mi |
| 600 Grand Ave #107 Arlington, TX | 2.0 | 1.0 | 1108 | $1,275 | $1.15 | 15d | 1 | 0.60mi |
| 1409 College St Arlington, TX | 3.0 | 1.0 | 1008 | $1,485 | $1.47 | 45d | 1 | 0.67mi |
| 129 Garden Ct E Arlington, TX | 3.0 | 2.5 | 1558 | $2,500 | $1.60 | 15d | 1 | 0.75mi |
| 308 College St Unit B Arlington, TX | 2.0 | 1.0 | 912 | $1,349 | $1.48 | 45d | 1 | 0.75mi |
| 1808 Donna St Arlington, TX | 3.0 | 1.0 | 1277 | $2,800 | $2.19 | 26d | 1 | 0.78mi |
| 420 W Park Row Dr Arlington, TX | 3.0 | 1.0–2.0 | 759 | $1,665 | $2.19 | 3d | 50 | 0.80mi |
| 376 Westview Ter Arlington, TX | 3.0 | 2.5 | 1518 | $2,000 | $1.32 | 45d | 1 | 0.82mi |
| 1600 Jones Dr Arlington, TX | 1.0–2.0 | 1.0–2.0 | 840 | $1,275 | $1.52 | 45d | 10 | 0.88mi |
| 509 Baylor Dr Arlington, TX | 3.0 | 2.0 | 1390 | $1,995 | $1.44 | 45d | 1 | 0.89mi |
| 1727 Westview Ter Arlington, TX | 1.0–2.0 | 1.5 | 859 | $1,746 | $2.03 | 0d | 9 | 0.89mi |
| 915 W Lovers Ln Arlington, TX | 4.0 | 2.0 | 1860 | $2,195 | $1.18 | 45d | 1 | 0.90mi |
| 903 Love Wood Ln Arlington, TX | 3.0 | 2.0 | 1461 | $2,000 | $1.37 | 45d | 1 | 0.91mi |
| 426 Westview Ter Arlington, TX | 3.0 | 2.5 | 1872 | $2,100 | $1.12 | 4d | 1 | 0.92mi |
| 424 Westview Ter Arlington, TX | 3.0 | 2.5 | 1728 | $2,150 | $1.24 | 13d | 1 | 0.92mi |
| 1905 S Cooper St Arlington, TX | 3.0 | 2.5 | 968 | $1,700 | $1.76 | 9d | 1 | 0.95mi |
| 1413 W Tucker Blvd Arlington, TX | 4.0 | 2.0 | 1679 | $2,070 | $1.23 | 45d | 1 | 0.96mi |
| 1700 Justin Lyn St Arlington, TX | 2.0 | 1.0 | 1650 | $1,300 | $0.79 | 45d | 1 | 0.97mi |
| 510 Magnolia St Arlington, TX | 3.0 | 2.0 | 1170 | $1,850 | $1.58 | 45d | 1 | 1.04mi |
| 307 Rose St Unit 307-D Arlington, TX | 2.0 | 1.0 | 880 | $1,095 | $1.24 | 16d | 1 | 1.05mi |
| 307 Rose St Unit 311-C Arlington, TX | 2.0 | 1.0 | 880 | $1,095 | $1.24 | 45d | 1 | 1.05mi |
| 313 Rose St Unit 317-B Arlington, TX | 2.0 | 1.0 | 880 | $1,095 | $1.24 | 16d | 1 | 1.08mi |
| 812 Cooper Square Cir Arlington, TX | 1.0–3.0 | 1.0–2.0 | 1046 | $1,750 | $1.67 | 0d | 30 | 1.08mi |
| 1905 Brookview Dr Arlington, TX | 3.0 | 2.0 | 1011 | $1,880 | $1.86 | 21d | 1 | 1.08mi |
| 320 E 4th St Unit 204 Arlington, TX | 2.0 | 2.0 | 989 | $1,149 | $1.16 | 45d | 1 | 1.10mi |
| 101 S Center St Unit 533 Arlington, TX | 2.0 | 2.0 | 1104 | $3,001 | $2.72 | 22d | 1 | 1.11mi |
| 101 S Center St Arlington, TX | 2.0 | 2.0 | 1012 | $2,947 | $2.91 | 22d | 15 | 1.11mi |
| 101 S Center St Unit 447 Arlington, TX | 2.0 | 2.0 | 1104 | $2,967 | $2.69 | 5d | 1 | 1.11mi |
Listing history 6 events
-
2026-06-07statusdays on market $175,000 Pending 5 DOM
-
2026-06-04days on market $175,000 Active 4 DOM
-
2026-06-03days on market $175,000 Active 3 DOM
-
2026-06-02days on market $175,000 Active 2 DOM
-
2026-06-01remarks 310-char remark
-
2026-06-01$175,000 Active 1 DOM
ⓘ Source: listings_history table (triggers on properties + properties_extension) + one-shot
backfill from property_details.listing_events for pre-trigger history.
Tax reassessment forecast TX · Resets to sale price
- Current annual tax
- $4,395 · $366/mo
- Projected year-2 tax
- $4,395 · $366/mo
- Expected delta
- $0/yr ($0/mo · 0.0%)
ⓘ Screening estimate from a state-policy table — verify with the county assessor before closing.
Climate risk First Street
- Flood 1/10 Low FEMA zone X (unshaded) · 0% chance over 30 yrs
- Wildfire 1/10 Low
- Heat 7/10 Severe 7 d/yr ≥109°F today · 23 d/yr by 30 yrs out
- Wind 6/10 Major 27% chance of damaging wind over 30 yrs
- Air quality 3/10 Moderate 2 unhealthy d/yr today · 4 by 30 yrs out
Nearby sold comps map
Loading sold comps map…
Walkable amenities ~0.75 mi
Loading nearby amenities…
Taxation est. · year 1
- Rental income
- $21,450
- − Mortgage interest
- −$9,803
- − Property taxes
- −$4,395
- − Insurance
- −$875
- − Repairs & maintenance
- −$1,716
- − Management
- −$1,716
- − Depreciation
- −$5,091
- Taxable loss
- −$2,145
- Est. tax savings @ 24.0%
- +$515
- After-tax cash flow
- $1,178/yr
For passive investors: Depreciation is non-cash, so a rental often shows a tax loss while cash-flowing — sheltering income. Rental losses are passive: they offset passive income freely, and up to $25,000/yr can offset ordinary (W-2) income if you actively participate and your MAGI is under $100k (phasing out to $0 by $150k); unused losses carry forward. On sale, claimed depreciation is recaptured at up to 25%, and gains may owe capital-gains tax (a 1031 exchange can defer both). Figures are a year-1 estimate at your 24.0% rate — not tax advice; consult a CPA.
Schools (NCES district)
- District
- Arlington ISD
- NCES district ID
- 4808700
- Math proficiency
- 24% ▼ -21.00%
- Reading proficiency
- 34% ▼ -8.00%
- Median HH income
- $50,873
- Composite
- 25.42/100
- National rank
- #7458
- State rank
- #629 of 826 in TX
Livability — Arlington
- Score
- 78/100
- State rank
- #75
- US rank
- #2697
Category grades
Schools grade is shown separately in the Schools card above.
Census & demographics
- Census place
- Arlington, TX
- County
- Tarrant County · 2,033,669 people
- City population
- 366,588
- Metro
- Dallas-Fort Worth-Arlington, TX
- Population (ZIP)
- 35,715
- Household income
- $70,471
- Rent vs Own
- Severe rent burden
- 1683.0
Population outlook (Tarrant County) Hauer SSP2
- Today (2025)
- 2,380,417 people
- By 2030
- 2,578,900 · +8.3%
- By 2040
- 2,974,995 · +25.0%
- By 2050
- 3,350,489 · +40.8%
- By 2075
- 4,216,909 · +77.2%
- By 2100
- 4,741,527 · +99.2%
Race, ethnicity, and origin ACS 2023
- Neighborhood character
- Diverse neighborhood (Simpson 0.63)
- Race & ethnicity
- White 55% Hispanic / Latino 18% Black 14% Two or more races 11% Asian 10%
- Hispanic origin (detail)
- Mexican 13% Puerto Rican 2%
- Common ancestry
- Italian 2% Lithuanian 2% Slovak 2%
- Foreign-born
- 17% · Canada, China, Vietnam
- Languages at home
- 76% English-only · Spanish 12% Other Indo-European 5% Other Asian/Pacific 2%
Political lean MEDSL · Tarrant
- 2024 margin
- Lean R (+5.1) · D 46.7% · R 51.9% · Other 1.4%
- 2008→2024 swing
- +6.6pp toward D · 2008: -11.7pp · 2024: -5.1pp
- All cycles
- 2024: R+5.1 2020: D+0.2 2016: R+8.7 2012: R+15.7 2008: R+11.7
Not yet ingested
- Civics
- —
Market trends
- HPI YoY
- ▼ -256.90%
- Current HPI
- 257.252
- Rent YoY
- ▼ -0.08%
- Metro
- Dallas-Fort Worth-Arlington, TX
- State GDP YoY
- ▲ 3.95%
- F500 in state
- 110
Industry mix (Fortune 500 HQ in TX)
| Industry | F500 HQs | Revenue |
|---|---|---|
| Energy | 16 | $1,198B |
|
||
| Technology | 5 | $198B |
|
||
| Engineering / Construction | 4 | $72B |
|
||
| Energy Services | 3 | $60B |
|
||
| Utilities | 3 | $41B |
|
||
| Healthcare | 2 | $330B |
|
||
Price history
2 events — show timeline
- 2026-05-31 Listed $175,000 NTREIS
- 1991-12-13 Sold (Public Records) — Public Records
Property tax history
+5.5%/yrLatest (2025): $4,395 · +10.0% YoY. Source: county tax records.
Cash-flow waterfall
monthlySold comps — $/sqft
last 12 mo · ≤1 miLoading sold comps…