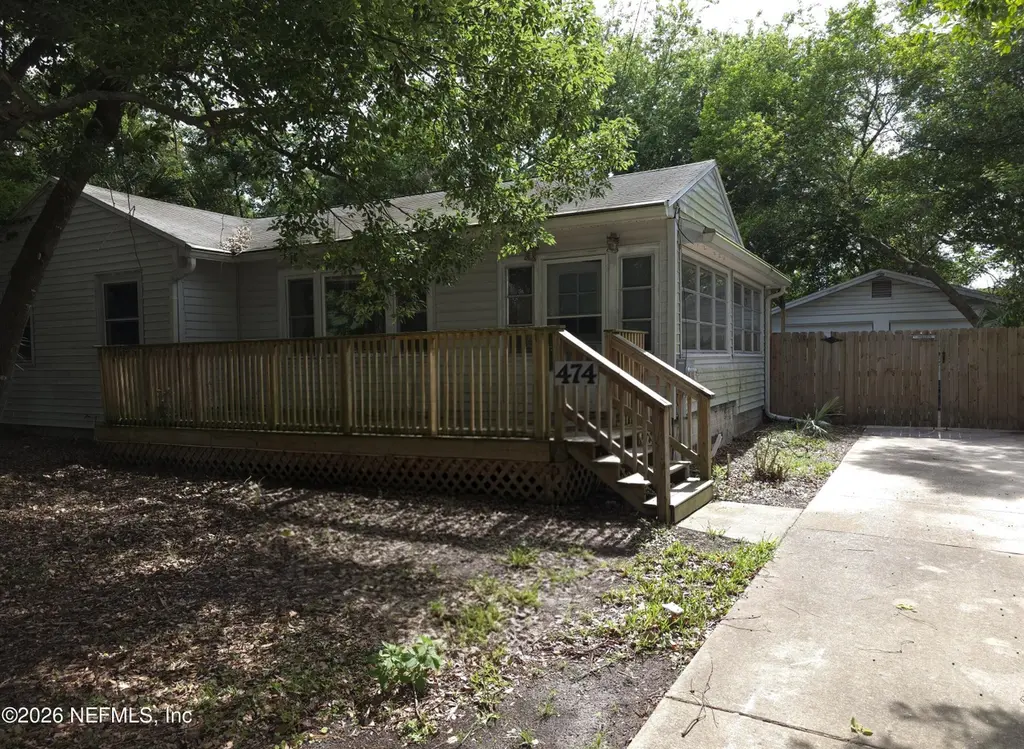
474 Laurina St · Jacksonville, FL
Flood risk 1/10 · Minimal
- FEMA flood zone
- X (unshaded)
- Chance of flooding over 30 yrs
- 0.0%
- Est. flood insurance / yr
- $507 – $1,088
Fire risk 2/10 · Minimal
- Est. fire insurance / yr
- $947 – $1,759
Heat risk 9/10 · Severe
- Hot days now (above 107°F)
- 7 days/yr
- Hot days in 30 yrs
- 20 days/yr
Wind risk 10/10 · Severe
- Chance of severe wind over 30 yrs
- 99.0%
Air-quality risk 4/10 · Minor
- Unhealthy air days now
- 6 days/yr
- Unhealthy air days in 30 yrs
- 6 days/yr
Risk factors via First Street. Map © Google.
Why this score? — see what drove the C- grade
The composite is a weighted blend of 9 inputs, each scored 0–100. Each bar is that input's sub-score; the figure is the points it added to the 100-point composite (weight × sub-score).
- Cash flow +16.9/30.0
- ARV discount +15.0/15.0
- DSCR +5.2/10.0
- Livability +4.2/5.0
- Schools +3.9/10.0
- 1% rule +3.5/10.0
- Condition / age +2.5/5.0
- Rent growth +2.4/5.0
- Appreciation +0.0/10.0
$190,000
🖨 Deal sheet (PDF) 📄 Offer letter ✓ Due diligence
Listing remarks
Charming 3 bedroom home featuring hardwood floors in the bedrooms, new carpet in the living and dining areas, and a bright enclosed sunroom perfect for a home office, hobby room, or additional living space. The functional layout offers comfortable living with plenty of flexibility to make the space your own. Step outside to enjoy the spacious, fully fenced backyard complete with a large pergola covered deck, ideal for entertaining or relaxing. A detached two car garage and storage shed provide additional convenience and versatility. Situated on a generously sized lot, this property offers plenty of outdoor space while remaining conveniently located near shopping, dining, and major roadways.
Key facts
- New carpet
- Enclosed sunroom
- Hardwood floors
Tags
Property features AI
Finance
- HOA & community: Not a senior community
Exterior
- Parking: Detached garage; 2-car garage
- Utilities: Public sewer; Electricity available; Water available; Sewer available
- Home design: Single family residence; One story
- Construction: Shingle roof
- Exterior features: Fenced backyard with wood fencing; City street frontage; Paved road access
Interior
- Kitchen: Electric range; Refrigerator
- Bedrooms: 3 bedrooms
- Flooring: Carpet; Wood
- Bathrooms: 1 full bathroom
- Heating & cooling: Central heating; Central air
- Interior features: Ceiling fan(s)
- Laundry & utility: Washer included
Neighborhood map
What this means for you Summary
Snapshot
- This is a 2-bed/1.0-bath single-family listed at $190k.
Deal economics
- At list price, monthly cash flow is $125 ($1k/yr) — positive.
- The deal already cash-flows at list — no discount required.
- To meet the 1% rule (rent ≥ 1% of price), the offer needs to be $162k (14.5% below list).
- Recommended offer: $162k (14.5% below list) — sets the bar for 1% rule.
- Cap rate 7.1% vs local median 3.9% in Jacksonville — top-decile yield for the area; either an underpriced asset or a hidden risk that comps aren't pricing in. Stress-test before assuming the spread holds.
Location & tenants
- Location reads 83/100 on livability (#50 in FL, #911 nationally) — a professional / high-income tenant draw. Strengths: amenities A+, commute A+, housing A+.
- Duval (urban): math 46% / reading 45% proficiency, ranked #48 of 73 in FL (top 66%) — families likely to look elsewhere, expect single-tenant / working-renter base with shorter leases.
- Zoned schools: Holiday Hill Elementary School (math 57% / reading 53%, grade C, #872 of 2,144 statewide, top 42%, 489 students, 47% FRL); Arlington Middle School (math 23% / reading 21%, grade F, #549 of 571 statewide, top 97%, 798 students, 74% FRL); Englewood High School (math 21% / reading 21%, grade F, #551 of 667 statewide, top 83%, 1,741 students, 58% FRL).
- Zoned-school proficiency averages 33% at this address vs 46% district-wide (-13 pts) — the specific schools serving this property underperform the Duval average; the district grade overstates school quality for this exact location.
- Market conditions: Rents soft (-0.2%/yr); 223 active listings in the ZIP; 40 comparable units currently listed for rent nearby; rentals at typical pace (median 16d on market — plan ~3-4 weeks tenant-placement turnaround); 6,503 units permitted in Duval County in 2024 (1,131 in 5+ unit buildings).
- This rent runs 32% of the median local income ($62k/yr) — at the standard rent-burdened threshold; future hikes will face affordability resistance.
Forward outlook
- Local home prices are declining (-3.0%/yr); year-one equity from $1k of loan paydown is wiped out by about $6k of value loss. Plan a longer hold.
- Duval County population projected at +19% by 2050 — long-run rental-demand tailwind backs the buy-and-hold thesis.
Negotiation context
- It's been on market 16 days — a 2% lower offer ($187k) is reasonable based on typical stale-listing flexibility.
Risks & watch-outs
- Watch-outs: built in 1949 — expect roof / HVAC / electrical / plumbing capex.
- Climate carrying-cost: severe wind risk, 99% chance of damaging wind over 30y; extreme-heat days projected 7→20/yr by 2055 (HVAC capex compounding) — expect insurance premiums to compound above CPI over the hold.
Questions for the listing agent
- Built in 1949 — when were the roof, HVAC, electrical panel, plumbing, and water heater last replaced?
- Is there a deadline driving the sale (1031 exchange, divorce, estate, relocation)? That informs how much negotiation room exists.
- Schools are B-rated — typically a magnet for longer-tenancy family renters. What's the average tenant stay here, and is there a school-zone premium baked into asking?
- What's the average days-on-market for RENTAL listings here right now (not sales)? A rising rental-DOM trend means longer vacancies and softer asking-rent achievability than the comps imply.
- What's the recent tenant-quality profile in this submarket — average credit score on applications, eviction rate, late-payment / NSF rate, and stable-employment percentage? A property-management company in the area should have these aggregated.
- How much new for-sale + rental construction is in the pipeline within 1–3 miles? Heavy new supply typically softens prices + rents 12–24 months out; constrained supply supports both.
Investment metrics
- 1% rule
- 0.85% ✗
- Cap rate
- 7.08%
- Cash-on-cash
- 2.81%
- DSCR
- 1.12
- GRM
- 9.8
CMA / ARV
- ARV (on-the-fly)
- $230,010
- Comps found
- 12
Show comp detail 12 sales within ~0.75 mi
| Address | Dist | Beds/Ba | Sqft | Sold | Price | $/sf | Match |
|---|---|---|---|---|---|---|---|
| 6500 Altama Rd | 0.18mi | 2/1.0 | 1,085 (-3%) | 3mo | $225,000 | $207 | 83 |
| 773 Wren Rd | 0.32mi | 2/1.0 | 1,170 (+4%) | 2mo | $239,900 | $205 | 76 |
| 442 Tabor Dr W | 0.21mi | 2/1.0 | 1,209 (+8%) | 8mo | $176,000 | $146 | 71 |
| 780 Leafy Ln | 0.32mi | 3/1.0 (+1) | 1,150 (+2%) | 7mo | $245,000 | $213 | 70 |
| 455 Aiken Rd | 0.09mi | 3/1.0 (+1) | 1,242 (+11%) | 7mo | $217,500 | $175 | 67 |
| 723 Leafy Ln | 0.24mi | 2/1.0 | 1,034 (-8%) | 12mo | $197,000 | $191 | 66 |
| 910 Nightingale Rd | 0.36mi | 3/1.0 (+1) | 1,264 (+13%) | 2mo | $260,000 | $206 | 55 |
| 6868 Crane Ave | 0.20mi | 3/2.0 (+1) | 1,236 (+10%) | 13mo | $290,000 | $235 | 54 |
| 41 Agnue Ave | 0.47mi | 3/1.0 (+1) | 1,046 (-7%) | 13mo | $190,500 | $182 | 52 |
| 306 Brunswick Rd | 0.29mi | 3/2.0 (+1) | 1,264 (+13%) | 8mo | $252,750 | $200 | 50 |
| 7125 Silver Lake Ter | 0.55mi | 3/2.0 (+1) | 1,184 (+6%) | 8mo | $194,000 | $164 | 49 |
| 7110 Waikiki Rd | 0.54mi | 3/2.0 (+1) | 1,240 (+10%) | 3mo | $270,000 | $218 | 46 |
Match score weights: distance 35% · size 25% · config 20% · recency 20%. Top-matched comps best support the ARV.
Projected returns pro-forma
-3.0% appreciation · 0.0% rent growth · sell at horizon
- IRR
- -15.0%
- Equity multiple
- 0.48×
- Total profit
- $-27,686
- Equity at exit
- $28,330
- IRR
- -11.7%
- Equity multiple
- 0.39×
- Total profit
- $-32,573
- Equity at exit
- $16,428
Cash invested: $53,200 (down + closing). Projections, not guarantees.
Landlord ↔ Tenant lean methodology
- Overall (STATE)
- 87 Strongly Landlord-Friendly
- State Florida
- 87 Strongly Landlord-Friendly · R+3
- County
- — inherits STATE
- City
- — inherits STATE
ZIP-level market 32216
- Rents YoY
- -0.2%
- Active inventory
- 223
- Price-to-rent
- 9.8×
Monthly cashflow live
- Estimated rent
- $1,624 high interval (Pro) →
- Mortgage (P&I)
- −$996
- Tax from tax record
- −$83 /mo · $994/yr
- Insurance
- −$79
- HOA
- −$0
- Vacancy / Maint / Mgmt
- −$341
- Net cashflow
- $125
Break-even live
Sensitivity live
| Price | -10% $232 | -5% $178 | +0% $125 | +5% $71 | +10% $17 |
|---|---|---|---|---|---|
| Rent | -10% $-4 | -5% $60 | +0% $125 | +5% $189 | +10% $253 |
| Rate | -1.0pp $220 | -0.5pp $173 | base $125 | +0.5pp $75 | +1.0pp $25 |
UW: 25.0% down · 7.5% · 30yr · 1.5% tax · 5.0% vac · 8.0% maint · 8.0% mgmt
Financing live
Cash to close
- Down payment
- $47,500
- Closing costs
- $5,700
- Reserves months
- —
- Total cash needed
- —
Loan-product check · same deal, 3 products live
Conventional
25% down · 7.5% · 30yr
- Down + closing
- —
- Monthly P&I
- —
- Monthly cashflow
- —
- DSCR
- —
- Eligible?
- —
Personal DTI + credit; lowest rate.
DSCR
20% down · 8.5% · 30yr
- Down + closing
- —
- Monthly P&I
- —
- Monthly cashflow
- —
- DSCR
- —
- Eligible?
- —
No personal income docs; deal must DSCR.
Hard money
10% down · 12.0% · 12mo
- Down + closing
- —
- Monthly P&I
- —
- Monthly cashflow
- —
- DSCR
- —
- Eligible?
- —
Short-term bridge; refi at stabilization.
Rent comps 40 comps
| Address | Beds | Baths | Sqft | Rent | $/sqft | DOM | Units | Dist |
|---|---|---|---|---|---|---|---|---|
| 7811 Aquarius Cir S Jacksonville, FL | 3.0 | 2.0 | 1298 | $1,760 | $1.36 | 25d | 1 | 0.79mi |
| 421 Aralia Ln Jacksonville, FL | 3.0 | 2.5 | 1492 | $1,681 | $1.13 | 22d | 1 | 0.91mi |
| 1620 Bartram Rd Jacksonville, FL | 1.0–3.0 | 1.0–2.0 | 1259 | $1,659 | $1.32 | 4d | 14 | 0.92mi |
| 5811 Atlantic Blvd Jacksonville, FL | 1.0–2.0 | 1.0–1.5 | 888 | $1,375 | $1.55 | 5d | 2 | 0.92mi |
| 1515 Pullen Rd Unit 4 Jacksonville, FL | 2.0 | 1.0 | 800 | $1,100 | $1.38 | 25d | 1 | 0.92mi |
| 7346 El Barco Rd #8 Jacksonville, FL | 2.0 | 2.0 | 992 | $1,295 | $1.31 | 25d | 1 | 1.07mi |
| 7346 El Barco Rd #8 Jacksonville, FL | 2.0 | 2.0 | 992 | $1,295 | $1.31 | 15d | 1 | 1.07mi |
| 7600 Free Ave Jacksonville, FL | 3.0 | 2.0 | 1229 | $1,745 | $1.42 | 25d | 1 | 1.08mi |
| 8232 Rigel Rd Jacksonville, FL | 3.0 | 2.5 | 1372 | $1,610 | $1.17 | 15d | 1 | 1.08mi |
| 3000 Coronet Ln Jacksonville, FL | 1.0–3.0 | 1.0–2.0 | 1017 | $1,369 | $1.35 | 25d | 5 | 1.08mi |
| 8236 Rigel Rd Jacksonville, FL | 3.0 | 2.5 | 1358 | $1,585 | $1.17 | 25d | 1 | 1.08mi |
| 551 Eiseman Way Jacksonville, FL | 3.0 | 2.5 | 1358 | $1,620 | $1.19 | 25d | 1 | 1.09mi |
| 8252 Rigel Rd Jacksonville, FL | 3.0 | 2.5 | 1358 | $1,625 | $1.20 | 25d | 1 | 1.10mi |
| 8290 Rigel Rd Jacksonville, FL | 3.0 | 2.5 | 1358 | $1,595 | $1.17 | 25d | 1 | 1.15mi |
| 7632 Hare Ave Jacksonville, FL | 3.0 | 2.0 | 1169 | $1,690 | $1.45 | 25d | 1 | 1.19mi |
| 8000 Dandy Ave Jacksonville, FL | 3.0 | 2.0 | 1330 | $1,761 | $1.32 | 9d | 1 | 1.22mi |
| 7505 Beach Blvd Jacksonville, FL | 3.0 | 1.0–2.0 | 900 | $1,417 | $1.57 | 25d | 20 | 1.24mi |
| 7703 Hare Ave Jacksonville, FL | 2.0 | 1.0 | 700 | $1,099 | $1.57 | 4d | 1 | 1.26mi |
| 5201 Atlantic Blvd Jacksonville, FL | 1.0–3.0 | 1.0–2.0 | 1140 | $1,480 | $1.30 | 3d | 3 | 1.26mi |
| 5201 Atlantic Blvd Jacksonville, FL | 1.0 | 1.0 | 830 | $1,075 | $1.30 | 9d | 2 | 1.26mi |
| 5201 Atlantic Blvd Jacksonville, FL | 1.0 | 1.0–1.5 | 830 | $1,075 | $1.30 | 12d | 3 | 1.26mi |
| 6650 Corporate Center Pkwy Jacksonville, FL | 1.0–3.0 | 1.0–2.0 | 990 | $2,304 | $2.33 | 3d | 12 | 1.31mi |
| 514 Narnia Ct Jacksonville, FL | 3.0 | 2.5 | 1480 | $1,845 | $1.25 | 25d | 1 | 1.37mi |
| 514 Narnia Ct Jacksonville, FL | 3.0 | 2.5 | 1480 | $1,845 | $1.25 | 16d | 1 | 1.37mi |
| 513 Narnia Ct Jacksonville, FL | 3.0 | 2.5 | 1480 | $1,845 | $1.25 | 5d | 1 | 1.41mi |
| 514 Kit St Jacksonville, FL | 3.0 | 2.5 | 1480 | $1,845 | $1.25 | 25d | 1 | 1.43mi |
| 514 Kit St Jacksonville, FL | 3.0 | 2.5 | 1480 | $1,845 | $1.25 | 16d | 1 | 1.43mi |
| 558 Kit St Jacksonville, FL | 3.0 | 2.5 | 1480 | $1,845 | $1.25 | 16d | 1 | 1.43mi |
| 558 Kit St Jacksonville, FL | 3.0 | 2.5 | 1480 | $1,845 | $1.25 | 22d | 1 | 1.43mi |
| 471 Matilda Ln Jacksonville, FL | 3.0 | 2.5 | 1480 | $1,845 | $1.25 | 18d | 1 | 1.43mi |
| 471 Matilda Ln Jacksonville, FL | 3.0 | 2.5 | 1480 | $1,845 | $1.25 | 16d | 1 | 1.43mi |
| 574 Kit St Jacksonville, FL | 3.0 | 2.5 | 1480 | $1,845 | $1.25 | 25d | 1 | 1.43mi |
| 574 Kit St Jacksonville, FL | 3.0 | 2.5 | 1480 | $1,845 | $1.25 | 16d | 1 | 1.43mi |
| 451 Matilda Ln Jacksonville, FL | 3.0 | 2.5 | 1480 | $1,845 | $1.25 | 16d | 1 | 1.43mi |
| 451 Matilda Ln Jacksonville, FL | 3.0 | 2.5 | 1480 | $1,845 | $1.25 | 9d | 1 | 1.43mi |
| 8319 Dandy Ave Jacksonville, FL | 2.0 | 1.0 | 883 | $1,650 | $1.87 | 25d | 1 | 1.43mi |
| 8778 Buzz Ct Jacksonville, FL | 3.0 | 2.0 | 1212 | $1,800 | $1.49 | 25d | 1 | 1.44mi |
| 4800 Atlantic Blvd Jacksonville, FL | 1.0–2.0 | 1.0–1.5 | 750 | $1,269 | $1.69 | 3d | 12 | 1.45mi |
| 454 Terabithia Way Jacksonville, FL | 3.0 | 2.5 | 1480 | $1,845 | $1.25 | 5d | 1 | 1.45mi |
| 535 Kit St Jacksonville, FL | 3.0 | 2.5 | 1480 | $1,845 | $1.25 | 16d | 1 | 1.46mi |
Listing history 12 events
-
2026-06-21days on market $190,000 Active 16 DOM
-
2026-06-18days on market $190,000 Active 13 DOM
-
2026-06-17days on market $190,000 Active 12 DOM
-
2026-06-16days on market $190,000 Active 11 DOM
-
2026-06-16status $190,000 Active 10 DOM
-
2026-06-15statusdays on market $190,000 Active Under Contract 10 DOM
-
2026-06-13days on market $190,000 Active 8 DOM
-
2026-06-13days on market $190,000 Active 7 DOM
-
2026-06-09days on market $190,000 Active 4 DOM
-
2026-06-08days on market $190,000 Active 3 DOM
-
2026-06-07remarks 699-char remark
-
2026-06-07$190,000 Active 2 DOM
ⓘ Source: listings_history table (triggers on properties + properties_extension) + one-shot
backfill from property_details.listing_events for pre-trigger history.
Tax reassessment forecast FL · Resets to sale price
- Current annual tax
- $994 · $83/mo
- Projected year-2 tax
- $1,577 · $131/mo
- Expected delta
- +$583/yr (+$49/mo · 58.7%)
ⓘ Screening estimate from a state-policy table — verify with the county assessor before closing.
Climate risk First Street
- Flood 1/10 Low FEMA zone X (unshaded) · 0% chance over 30 yrs
- Wildfire 2/10 Low
- Heat 9/10 Extreme 7 d/yr ≥107°F today · 20 d/yr by 30 yrs out
- Wind 10/10 Extreme 99% chance of damaging wind over 30 yrs
- Air quality 4/10 Moderate 6 unhealthy d/yr today · 6 by 30 yrs out
Nearby sold comps map
Loading sold comps map…
Walkable amenities ~0.75 mi
Loading nearby amenities…
Taxation est. · year 1
- Rental income
- $19,487
- − Mortgage interest
- −$10,643
- − Property taxes
- −$994
- − Insurance
- −$950
- − Repairs & maintenance
- −$1,559
- − Management
- −$1,559
- − Depreciation
- −$5,527
- Taxable loss
- −$1,745
- Est. tax savings @ 24.0%
- +$419
- After-tax cash flow
- $1,913/yr
For passive investors: Depreciation is non-cash, so a rental often shows a tax loss while cash-flowing — sheltering income. Rental losses are passive: they offset passive income freely, and up to $25,000/yr can offset ordinary (W-2) income if you actively participate and your MAGI is under $100k (phasing out to $0 by $150k); unused losses carry forward. On sale, claimed depreciation is recaptured at up to 25%, and gains may owe capital-gains tax (a 1031 exchange can defer both). Figures are a year-1 estimate at your 24.0% rate — not tax advice; consult a CPA.
Schools (NCES district)
- District
- Duval
- NCES district ID
- 1200480
- Math proficiency
- 46% ▼ -11.00%
- Reading proficiency
- 45% ▼ -4.00%
- Median HH income
- $48,987
- Composite
- 38.97/100
- National rank
- #4076
- State rank
- #48 of 73 in FL
Livability — Jacksonville
- Score
- 83/100
- State rank
- #50
- US rank
- #911
Category grades
Schools grade is shown separately in the Schools card above.
Census & demographics
- Census place
- Jacksonville, FL
- County
- Duval County · 1,015,274 people
- City population
- 979,034
- Metro
- Jacksonville, FL
- Population (ZIP)
- 42,298
- Household income
- $61,821
- Rent vs Own
- Severe rent burden
- 3324.0
Population outlook (Duval County) Hauer SSP2
- Today (2025)
- 1,013,010 people
- By 2030
- 1,059,228 · +4.6%
- By 2040
- 1,141,439 · +12.7%
- By 2050
- 1,205,258 · +19.0%
- By 2075
- 1,324,282 · +30.7%
- By 2100
- 1,319,620 · +30.3%
Race, ethnicity, and origin ACS 2023
- Neighborhood character
- Diverse neighborhood (Simpson 0.67)
- Race & ethnicity
- White 51% Black 22% Hispanic / Latino 16% Two or more races 11% Asian 7%
- Hispanic origin (detail)
- Mexican 2% Puerto Rican 6% Cuban 4%
- Common ancestry
- Italian 2% Lithuanian 2% American 2%
- Foreign-born
- 16% · Canada, Vietnam, Philippines
- Languages at home
- 78% English-only · Spanish 11% Other Indo-European 3% Arabic 2%
Political lean MEDSL · Duval
- 2024 margin
- Toss-up / Even · D 48.7% · R 50.1% · Other 1.2%
- 2008→2024 swing
- +0.4pp no change · 2008: -1.9pp · 2024: -1.5pp
- All cycles
- 2024: R+1.5 2020: D+3.8 2016: R+1.5 2012: R+3.6 2008: R+1.9
Not yet ingested
- Civics
- —
Market trends
- HPI YoY
- ▼ -221.05%
- Current HPI
- 296.9579
- Rent YoY
- ▼ -0.21%
- Metro
- Jacksonville, FL
- State GDP YoY
- ▲ 3.28%
- F500 in state
- 36
Industry mix (Fortune 500 HQ in FL)
| Industry | F500 HQs | Revenue |
|---|---|---|
| Industrial Technology | 2 | $29B |
|
||
| Insurance | 2 | $17B |
|
||
| Retail | 1 | $60B |
|
||
| Technology Distribution | 1 | $58B |
|
||
| Homebuilding | 1 | $35B |
|
||
| Technology Manufacturing | 1 | $35B |
|
||
Price history
1 event — show timeline
- 2026-06-04 Listed $190,000 realMLS
Property tax history
+2.4%/yrLatest (2025): $994 · +22.8% YoY. Source: county tax records.
Cash-flow waterfall
monthlySold comps — $/sqft
last 12 mo · ≤1 miLoading sold comps…