3301 NE 1st Ave Unit H1811 · Miami, FL
Flood risk 1/10 · Minimal
- FEMA flood zone
- X (unshaded)
- Chance of flooding over 30 yrs
- 0.0%
- Est. flood insurance / yr
- $507 – $1,088
Fire risk 1/10 · Minimal
- Est. fire insurance / yr
- $947 – $1,759
Heat risk 10/10 · Severe
- Hot days now (above 103°F)
- 6 days/yr
- Hot days in 30 yrs
- 24 days/yr
Wind risk 10/10 · Severe
- Chance of severe wind over 30 yrs
- 99.0%
Air-quality risk 2/10 · Minimal
- Unhealthy air days now
- 1 days/yr
- Unhealthy air days in 30 yrs
- 1 days/yr
Risk factors via First Street. Map © Google.
Why this score? — see what drove the D- grade
The composite is a weighted blend of 9 inputs, each scored 0–100. Each bar is that input's sub-score; the figure is the points it added to the 100-point composite (weight × sub-score).
- ARV discount +7.5/15.0
- Cash flow +7.3/30.0
- Appreciation +5.1/10.0
- 1% rule +4.4/10.0
- Schools +4.2/10.0
- Livability +3.9/5.0
- Rent growth +3.2/5.0
- Condition / age +2.5/5.0
- DSCR +1.5/10.0
$520,000
🖨 Deal sheet 📄 Offer letter ✓ Due diligence
Listing remarks MLS
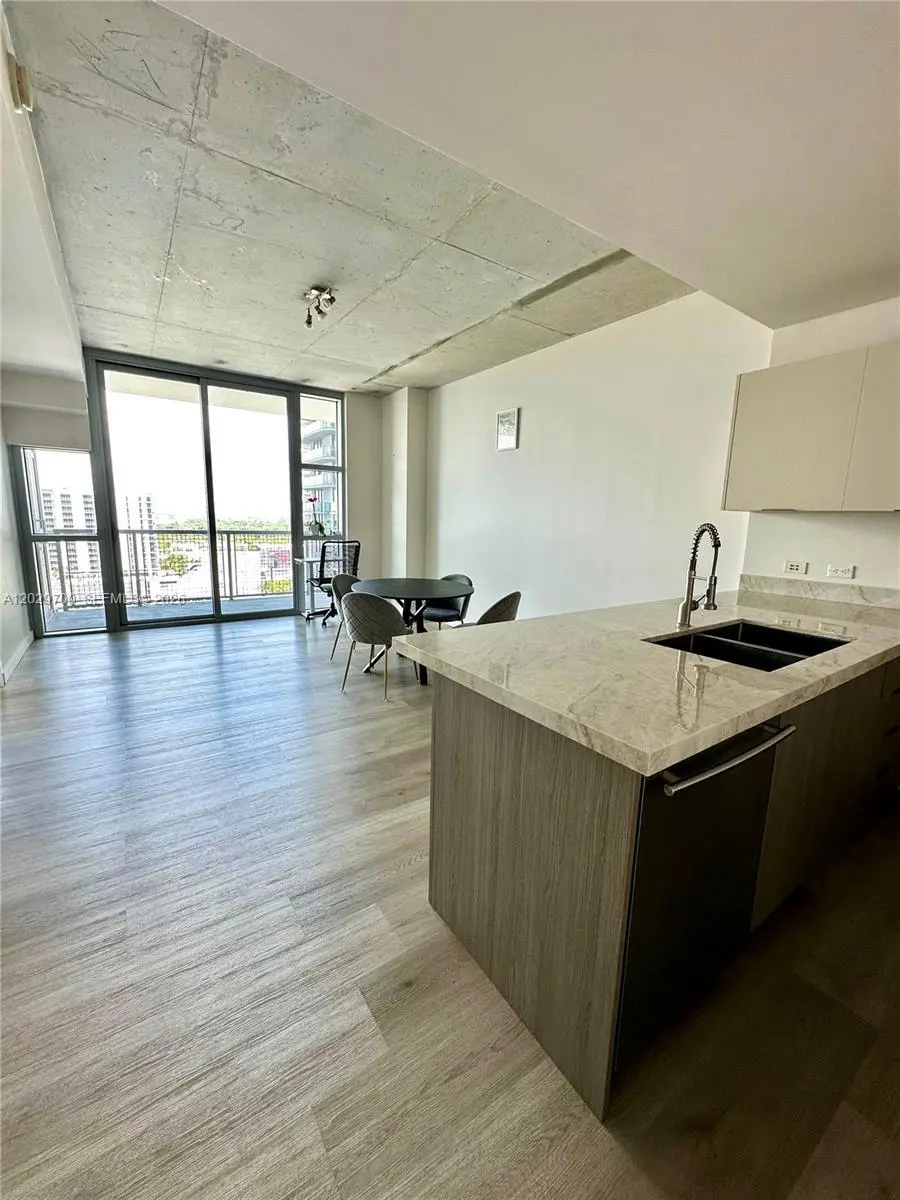
Stunning spacious 1-bed, 1.5-bath modern condo in Midtown Miami with lofty feel. Spectacular city views, floor-to-ceiling windows, porcelain tile floors. Upgraded kitchen with stainless steel appliances, Italian cabinets, granite countertops. Master bedroom with huge walk-in closet. Assigned garage parking. 4 Midtown offers top of line ameneties like pool, gym, with sauna + steam room, concierge. Close to shopping, dining, Design District, Beaches, downtown, and airport. Unbeatable location with excellent walkability, all of the best shopping and dining within steps! Embrace the vibrant energy of the city from this exceptional residence.
Key facts
- Upgraded kitchen
- Italian cabinets
- Huge walk in closet
Tags
Property features AI
Finance
- Financial info: Lease considered; Pets allowed with size limit up to 20 lbs
- HOA & community: Monthly association fee; Association fee covers amenities, cable TV, sewer, trash, and water; Community amenities include community kitchen, elevators, fitness center, playground, pool, sauna, spa/hot tub, and trash service
Exterior
- Parking: Attached garage with one covered space
- Security: Doorman; Elevator with secured access; Secured garage/parking; Security guard; Smoke detectors
- Utilities: Central heating and cooling
- Home design: Condominium / attached property; Faces west; Entry on level 18; Single-story unit
- Construction: Block construction; Effective year built
- Exterior features: Security/high impact doors; Association heated pool
Interior
- Kitchen: Dishwasher; Electric range; Disposal; Icemaker; Microwave; Refrigerator
- Bedrooms: Bedroom located on the main level
- Flooring: Hardwood; Tile; Wood
- Bathrooms: 1 full bathroom; 1 half bathroom
- Heating & cooling: Central heating; Central air conditioning
- Interior features: Unfurnished; Closet cabinetry; Kitchen island; Bedroom on main level
- Laundry & utility: Washer; Dryer
Neighborhood map
What this means for you Summary
Snapshot
- This is a 1-bed/1.0-bath condo listed at $520k.
Deal economics
- At list price, monthly cash flow is $-682 ($-8k/yr) — negative.
- To cash-flow at today's rent, offer at most $399k (23.2% below list).
- To meet the 1% rule (rent ≥ 1% of price), the offer needs to be $488k (6.2% below list).
- Recommended offer: $399k (23.2% below list) — sets the bar for cash-flow.
- Cap rate 4.7% vs local median 1.9% in Miami — top-decile yield for the area; either an underpriced asset or a hidden risk that comps aren't pricing in. Stress-test before assuming the spread holds.
Location & tenants
- Location reads 78/100 on livability (#177 in FL, #2,724 nationally) — a middle-class / working-renter tenant base. Strengths: amenities A+, commute A+, health & safety A+; Watch: employment C-, crime F, cost of living F.
- Miami-Dade (suburban): math 45% / reading 54% proficiency, ranked #40 of 73 in FL (top 55%) — families likely to look elsewhere, expect single-tenant / working-renter base with shorter leases; 64% free/reduced lunch — lower-income household profile, screen leases tightly.
- Market conditions: Rents rising (+2.7%/yr); 757 active listings in the ZIP; 2 comparable units currently listed for rent nearby; solid renter incomes; 10,051 units permitted in Miami-Dade County in 2024 (7,758 in 5+ unit buildings).
- At $4,879/mo this rent would consume 62% of the median local household income ($94k/yr) (locally 3106% of renters already pay >50% of income on rent) — very limited rent-growth headroom before tenants either downsize or default.
Forward outlook
- In year one you build about $5k of equity ($4k loan paydown + $1k appreciation (0.3% local appreciation)).
- Miami-Dade County population projected at +28% by 2050 — long-run rental-demand tailwind backs the buy-and-hold thesis.
- By year 6, paydown + projected appreciation supports a ~$33k cash-out refi (75% LTV) — recoverable capital for the next deal without selling this one.
Negotiation context
- It's been on market 16 days — a 2% lower offer ($512k) is reasonable based on typical stale-listing flexibility.
- 9 sale attempts since 9y ago with the ask held roughly flat each time — persistent listings suggest the price (not the market) is what's stuck; bring a comps-based counter.
Risks & watch-outs
- Climate carrying-cost: severe wind risk, 99% chance of damaging wind over 30y; extreme-heat days projected 6→24/yr by 2055 (HVAC capex compounding) — expect insurance premiums to compound above CPI over the hold.
Questions for the listing agent
- What do current leases actually rent for vs. the listed asking? Can we see a recent rent roll and the last 12 months of T-12 income?
- What does the HOA fee cover, when was the last increase, and are there any pending special assessments or reserve-fund shortfalls?
- Any open or pending special assessments — roof, HVAC, plumbing, elevator, façade? What's the per-unit balance and payoff schedule, and is the seller paying it off at close or rolling it to the buyer?
- Is there a deadline driving the sale (1031 exchange, divorce, estate, relocation)? That informs how much negotiation room exists.
- Schools are B-rated — typically a magnet for longer-tenancy family renters. What's the average tenant stay here, and is there a school-zone premium baked into asking?
- Crime grade is F in this area — have there been break-ins, vandalism, or insurance claims at this property in the last 3 years? What carrier currently insures it and at what premium?
- The area grade is low — what's the realistic commute time and amenity access for the typical tenant pool here? Any planned neighborhood developments (good or bad) we should know about?
- What's the average days-on-market for RENTAL listings here right now (not sales)? A rising rental-DOM trend means longer vacancies and softer asking-rent achievability than the comps imply.
- What's the recent tenant-quality profile in this submarket — average credit score on applications, eviction rate, late-payment / NSF rate, and stable-employment percentage? A property-management company in the area should have these aggregated.
- How much new apartment / multifamily construction is in the pipeline within 1–3 miles? Heavy new supply (>2% of stock underway) typically softens rents 12–24 months out; light construction supports rent growth.
Investment metrics
- 1% rule
- 0.94% ✗
- Cap rate
- 4.72%
- Cash-on-cash
- -5.62%
- DSCR
- 0.75
- GRM
- 8.9
CMA / ARV
No comps found within radius.
Projected returns pro-forma
0.27% appreciation · 2.73% rent growth · sell at horizon
- IRR
- -7.6%
- Equity multiple
- 0.64×
- Total profit
- $-52,647
- Equity at exit
- $158,100
- IRR
- -1.8%
- Equity multiple
- 0.80×
- Total profit
- $-28,678
- Equity at exit
- $195,813
Cash invested: $145,600 (down + closing). Projections, not guarantees.
Landlord ↔ Tenant lean methodology
- Overall (STATE)
- 87 Strongly Landlord-Friendly
- State Florida
- 87 Strongly Landlord-Friendly · R+3
- County
- — inherits STATE
- City
- — inherits STATE
ZIP-level market 33137
- Home prices YoY
- 0.1%
- Rents YoY
- 2.7%
- Active inventory
- 757
- Price-to-rent
- 8.9×
Monthly cashflow live
- Estimated rent
- $4,879 medium interval (Pro) →
- Mortgage (P&I)
- −$2,727
- Tax from tax record
- −$678 /mo · $8,136/yr
- Insurance
- −$217
- HOA
- −$915
- Vacancy / Maint / Mgmt
- −$1,025
- Net cashflow
- $-682
Break-even live
UW: 25.0% down · 7.5% · 30yr · 1.5% tax · 5.0% vac · 8.0% maint · 8.0% mgmt
Financing live
Cash to close
- Down payment
- $130,000
- Closing costs
- $15,600
- Reserves months
- —
- Total cash needed
- —
Loan-product check · same deal, 3 products live
Conventional
25% down · 7.5% · 30yr
- Down + closing
- —
- Monthly P&I
- —
- Monthly cashflow
- —
- DSCR
- —
- Eligible?
- —
Personal DTI + credit; lowest rate.
DSCR
20% down · 8.5% · 30yr
- Down + closing
- —
- Monthly P&I
- —
- Monthly cashflow
- —
- DSCR
- —
- Eligible?
- —
No personal income docs; deal must DSCR.
Hard money
10% down · 12.0% · 12mo
- Down + closing
- —
- Monthly P&I
- —
- Monthly cashflow
- —
- DSCR
- —
- Eligible?
- —
Short-term bridge; refi at stabilization.
Rent comps 2 comps
| Address | Beds | Baths | Sqft | Rent | $/sqft | DOM | Units | Dist |
|---|---|---|---|---|---|---|---|---|
| 2900 Biscayne Blvd Miami, FL | 3.0 | 1.0–3.5 | 1260 | $8,110 | $6.44 | 2d | 13 | 0.28mi |
| 555 NE 34th St Miami, FL | 1.0–4.0 | 1.5–4.0 | 2653 | $3,506 | $1.32 | 2d | 19 | 0.36mi |
HOA detail condo
- Monthly dues
- $915 · $10,980/yr
- Likely covers
- poolgymdoorman
- Assessments
- None detected in remarks — confirm with the listing agent.
Listing history 11 events
-
2026-06-18days on market $520,000 Active 16 DOM
-
2026-06-17days on market $520,000 Active 15 DOM
-
2026-06-16days on market $520,000 Active 14 DOM
-
2026-06-15days on market $520,000 Active 13 DOM
-
2026-06-13days on market $520,000 Active 11 DOM
-
2026-06-09days on market $520,000 Active 7 DOM
-
2026-06-08days on market $520,000 Active 6 DOM
-
2026-06-07days on market $520,000 Active 5 DOM
-
2026-06-04days on market $520,000 Active 2 DOM
-
2026-06-02remarks 699-char remark
-
2026-06-02$520,000 Active 1 DOM
ⓘ Source: listings_history table (triggers on properties + properties_extension) + one-shot
backfill from property_details.listing_events for pre-trigger history.
Tax reassessment forecast FL · Resets to sale price
- Current annual tax
- $8,136 · $678/mo
- Projected year-2 tax
- $8,136 · $678/mo
- Expected delta
- $0/yr ($0/mo · 0.0%)
ⓘ Screening estimate from a state-policy table — verify with the county assessor before closing.
Climate risk First Street
- Flood 1/10 Low FEMA zone X (unshaded) · 0% chance over 30 yrs
- Wildfire 1/10 Low
- Heat 10/10 Extreme 6 d/yr ≥103°F today · 24 d/yr by 30 yrs out
- Wind 10/10 Extreme 99% chance of damaging wind over 30 yrs
- Air quality 2/10 Low 1 unhealthy d/yr today · 1 by 30 yrs out
Nearby sold comps map
Loading sold comps map…
Walkable amenities ~0.75 mi
Loading nearby amenities…
Taxation est. · year 1
- Rental income
- $58,548
- − Mortgage interest
- −$29,128
- − Property taxes
- −$8,136
- − Insurance
- −$2,600
- − Repairs & maintenance
- −$4,684
- − Management
- −$4,684
- − HOA
- −$10,980
- − Depreciation
- −$15,127
- Taxable loss
- −$16,791
- Est. tax savings @ 24.0%
- +$4,030
- After-tax cash flow
- $-4,156/yr
For passive investors: Depreciation is non-cash, so a rental often shows a tax loss while cash-flowing — sheltering income. Rental losses are passive: they offset passive income freely, and up to $25,000/yr can offset ordinary (W-2) income if you actively participate and your MAGI is under $100k (phasing out to $0 by $150k); unused losses carry forward. On sale, claimed depreciation is recaptured at up to 25%, and gains may owe capital-gains tax (a 1031 exchange can defer both). Figures are a year-1 estimate at your 24.0% rate — not tax advice; consult a CPA.
Schools (NCES district)
- District
- Miami-Dade
- NCES district ID
- 1200390
- Math proficiency
- 45% ▼ -16.00%
- Reading proficiency
- 54% ▼ -5.00%
- Median HH income
- $43,928
- Composite
- 41.76/100
- National rank
- #3397
- State rank
- #40 of 73 in FL
Livability — Miami
- Score
- 78/100
- State rank
- #177
- US rank
- #2724
Category grades
Schools grade is shown separately in the Schools card above.
Census & demographics
- Census place
- Miami, FL
- County
- Miami-Dade County · 2,697,751 people
- City population
- 827,308
- Metro
- Miami-Fort Lauderdale-Pompano Beach, FL
- Population (ZIP)
- 29,414
- Household income
- $94,036
- Rent vs Own
- Severe rent burden
- 3106.0
Population outlook (Miami-Dade County) Hauer SSP2
- Today (2025)
- 3,126,439 people
- By 2030
- 3,325,765 · +6.4%
- By 2040
- 3,697,561 · +18.3%
- By 2050
- 4,012,134 · +28.3%
- By 2075
- 4,605,612 · +47.3%
- By 2100
- 4,866,598 · +55.7%
Race, ethnicity, and origin ACS 2023
- Neighborhood character
- Diverse neighborhood (Simpson 0.63)
- Race & ethnicity
- Hispanic / Latino 54% Two or more races 25% White 24% Black 16% Asian 2%
- Hispanic origin (detail)
- Mexican 1% Puerto Rican 5% Cuban 10% Dominican 3% Salvadoran 3%
- Common ancestry
- Hispanic 8% Estonian 2% Lithuanian 2%
- Foreign-born
- 47% · Canada, Jamaica, Dominican Republic
- Languages at home
- 34% English-only · Spanish 49% French/Haitian/Cajun 8% Other Indo-European 5%
Political lean MEDSL · Miami-Dade
- 2024 margin
- R (+11.4) · D 43.9% · R 55.4%
- 2008→2024 swing
- -27.6pp toward R · 2008: 16.1pp · 2024: -11.4pp
- All cycles
- 2024: R+11.4 2020: D+7.3 2016: D+29.6 2012: D+23.7 2008: D+16.1
Not yet ingested
- Civics
- —
Market trends
- HPI YoY
- ▲ 0.27%
- Current HPI
- 385.1514
- Rent YoY
- ▲ 2.73%
- Metro
- Miami-Fort Lauderdale-Pompano Beach, FL
- State GDP YoY
- ▲ 3.28%
- F500 in state
- 36
Industry mix (Fortune 500 HQ in FL)
| Industry | F500 HQs | Revenue |
|---|---|---|
| Industrial Technology | 2 | $29B |
|
||
| Insurance | 2 | $17B |
|
||
| Retail | 1 | $60B |
|
||
| Technology Distribution | 1 | $58B |
|
||
| Homebuilding | 1 | $35B |
|
||
| Technology Manufacturing | 1 | $35B |
|
||
Price history
+158.7% since first listed28 events — show timeline
- 2026-06-02 Listed $520,000 MARMLS
- 2026-05-09 Listed for Rent $3,050 MARMLS
- 2025-06-23 Rental Removed $3,050 MARMLS
- 2025-06-05 Listed for Rent $3,050 MARMLS
- 2024-02-16 Sold (Public Records) $470,000 Public Records
- 2024-02-15 Sold (MLS) $470,000 MARMLS
- 2024-02-05 Contingent — MARMLS
- 2023-12-11 Price Changed $499,000 MARMLS
- 2023-10-24 Price Changed $530,000 MARMLS
- 2023-10-11 Listed $559,000 MARMLS
- 2021-10-12 Sold (Public Records) $345,000 Public Records
- 2021-09-20 Sold (MLS) $345,000 MARMLS
- 2021-07-19 Pending — MARMLS
- 2021-06-15 Price Changed $350,000 MARMLS
- 2020-12-10 Listed $330,000 MARMLS
- 2020-03-31 Listing Removed — MARMLS
- 2019-02-21 Price Changed $300,000 MARMLS
- 2018-10-01 Price Changed $315,000 MARMLS
- 2018-09-14 Listed $325,000 MARMLS
- 2018-08-07 Listing Removed — MARMLS
- 2018-05-26 Price Changed $315,000 MARMLS
- 2018-02-08 Listed $330,000 MARMLS
- 2018-01-24 Listing Removed — MARMLS
- 2017-11-08 Listed $330,000 MARMLS
- 2017-10-24 Listing Removed — MARMLS
- 2017-04-25 Listed $349,000 MARMLS
- 2013-04-02 Sold (Public Records) $273,900 Public Records
- 2011-07-01 Sold (Public Records) $201,000 Public Records
Property tax history
+5.5%/yrLatest (2025): $8,136 · -8.7% YoY. Source: county tax records.
Cash-flow waterfall
monthlySold comps — $/sqft
last 12 mo · ≤1 miLoading sold comps…