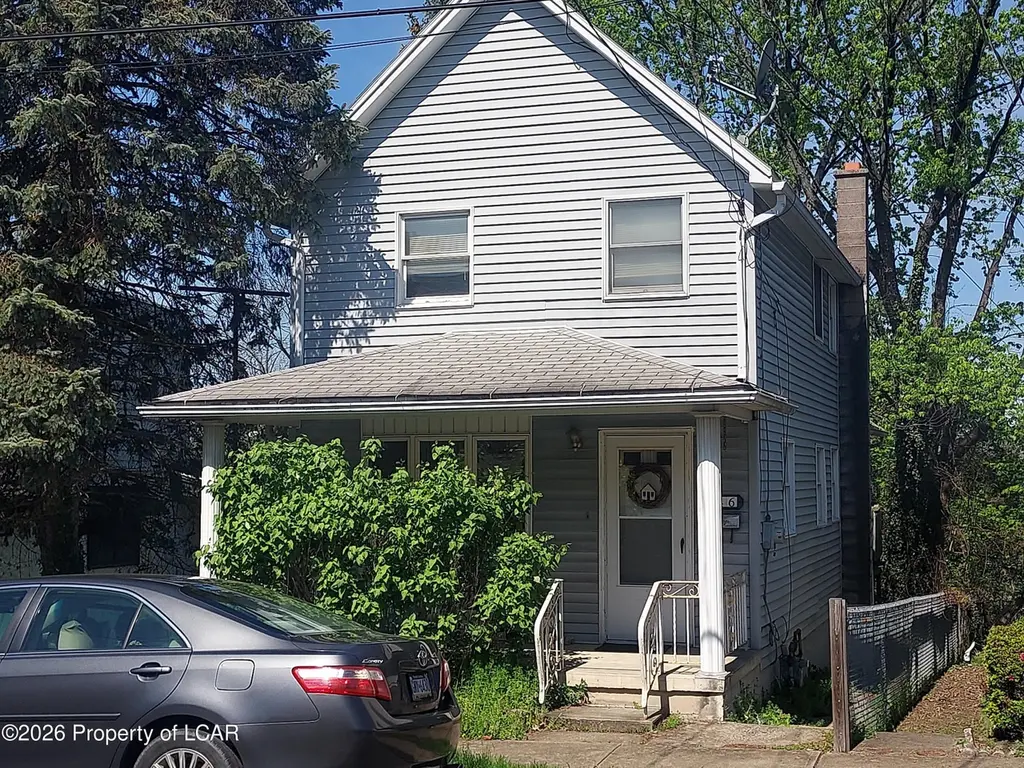
46 Walnut St · Wilkes-Barre, PA
Flood risk 6/10 · Moderate
- FEMA flood zone
- X
- Chance of flooding over 30 yrs
- 0.27%
- Est. flood insurance / yr
- $507 – $1,088
Fire risk 3/10 · Minor
- Est. fire insurance / yr
- $511 – $949
Heat risk 4/10 · Minor
- Hot days now (above 97°F)
- 7 days/yr
- Hot days in 30 yrs
- 16 days/yr
Wind risk 3/10 · Minor
- Chance of severe wind over 30 yrs
- 5.0%
Air-quality risk 2/10 · Minimal
- Unhealthy air days now
- 1 days/yr
- Unhealthy air days in 30 yrs
- 2 days/yr
Risk factors via First Street. Map © Google.
Why this score? — see what drove the B grade
The composite is a weighted blend of 9 inputs, each scored 0–100. Each bar is that input's sub-score; the figure is the points it added to the 100-point composite (weight × sub-score).
- Cash flow +30.0/30.0
- ARV discount +15.0/15.0
- DSCR +10.0/10.0
- 1% rule +8.6/10.0
- Rent growth +4.2/5.0
- Livability +2.5/5.0
- Condition / age +2.2/5.0
- Schools +2.1/10.0
- Appreciation +0.0/10.0
$95,000
🖨 Deal sheet 📄 Offer letter ✓ Due diligence
Listing remarks
A great opportunity in Wilkes-Barre Township. With a little TLC this would be a great starter home or investment property, priced affordably at $95,000. Close to major highways. Being sold as-is with all remaining contents included.
Key facts
- 2,040 sq ft lot
- Listed 6 days
Property features AI
Exterior
- Utilities: Public water; Public sewer
- Home design: Single-family residence; Two levels; Residential zoning
- Construction: Vinyl siding
- Exterior features: Deck; Porch
Interior
- Bathrooms: 1 full bathroom
- Heating & cooling: Natural gas forced-air heating
- Interior features: Eat-in kitchen; Full unfinished basement
Neighborhood map
What this means for you Summary
Snapshot
- This is a 2-bed/1.0-bath single-family listed at $95k. Condition is rated fair.
Deal economics
- At list price, monthly cash flow is $368 ($4k/yr) — positive.
- The deal already cash-flows at list — no discount required.
- Meets the 1% rule at list price ($1k rent vs $95k).
- Cap rate 10.9% vs local median 5.7% in Wilkes-Barre — top-decile yield for the area; either an underpriced asset or a hidden risk that comps aren't pricing in. Stress-test before assuming the spread holds.
Location & tenants
- Location reads: area grade B — affects rentability + tenant quality, not the cash-flow math above.
- Wilkes-Barre Area SD (urban): math 19% / reading 32% proficiency, ranked #469 of 539 in PA (top 87%) — low school quality limits family demand, transient renter base, plan for 1-2y turnover; 61% free/reduced lunch — lower-income household profile, screen leases tightly.
- Market conditions: Rents rising fast (+6.8%/yr); 221 active listings in the ZIP; 40 comparable units currently listed for rent nearby; rentals at typical pace (median 21d on market — plan ~3-4 weeks tenant-placement turnaround); 45% of comp listings sitting > 30 days — soft ceiling on asking rent; 349 units permitted in Luzerne County in 2024 (16 in 5+ unit buildings).
Forward outlook
- Local home prices are declining (-3.0%/yr); year-one equity from $657 of loan paydown is wiped out by about $3k of value loss. Plan a longer hold.
- Luzerne County population projected at +4% by 2050 — modest demand growth; plan on rents tracking national, not racing it.
- At projected returns (-3.0% appreciation + 6.8% rent growth), your $27k cash investment doubles in ~6 years — after that, you're playing with house money.
Negotiation context
- Only 6 days on market — expect competitive offers; lowballing is unlikely to land.
- 3 sale attempts since 3y ago with the ask held roughly flat each time — persistent listings suggest the price (not the market) is what's stuck; bring a comps-based counter.
Risks & watch-outs
- Climate carrying-cost: major flood risk — expect insurance premiums to compound above CPI over the hold.
Questions for the listing agent
- Have any recent inspections been done? Can we get a copy of the seller's disclosures and any deferred-maintenance estimates?
- Is there a deadline driving the sale (1031 exchange, divorce, estate, relocation)? That informs how much negotiation room exists.
- What's the average days-on-market for RENTAL listings here right now (not sales)? A rising rental-DOM trend means longer vacancies and softer asking-rent achievability than the comps imply.
- What's the recent tenant-quality profile in this submarket — average credit score on applications, eviction rate, late-payment / NSF rate, and stable-employment percentage? A property-management company in the area should have these aggregated.
- How much new for-sale + rental construction is in the pipeline within 1–3 miles? Heavy new supply typically softens prices + rents 12–24 months out; constrained supply supports both.
Investment metrics
- 1% rule
- 1.36% ✓
- Cap rate
- 10.94%
- Cash-on-cash
- 16.59%
- DSCR
- 1.74
- GRM
- 6.1
CMA / ARV
- ARV (median comp)
- $118,770
- List price
- $95,000
- Delta
- -20.01%
- Verdict
- UNDERPRICED
- Comps
- 20 within 1.0 mi
Show comp detail 12 sales within ~0.75 mi
| Address | Dist | Beds/Ba | Sqft | Sold | Price | $/sf | Match |
|---|---|---|---|---|---|---|---|
| 46 Walnut St | 0.00mi | 2/1.0 | 1,008 (0%) | 0mo | $99,000 | $98 | 100 |
| 63 Orchard St | 0.12mi | 3/1.0 (+1) | 972 (-4%) | 7mo | $45,000 | $46 | 78 |
| 17 Griffith Ln | 0.53mi | 2/1.0 | 1,024 (+2%) | 2mo | $82,500 | $81 | 71 |
| 10 Kirkendall Ave | 0.13mi | 3/1.0 (+1) | 1,100 (+9%) | 3mo | $195,000 | $177 | 71 |
| 31 Monroe St | 0.06mi | 3/1.0 (+1) | 1,128 (+12%) | 6mo | $125,000 | $111 | 68 |
| 71 Prospect St | 0.50mi | 3/1.0 (+1) | 1,120 (+11%) | 0mo | $115,000 | $103 | 53 |
| 290 Hazle St | 0.69mi | 3/1.5 (+1) | 1,088 (+8%) | 0mo | $152,000 | $140 | 47 |
| 57 Dodson Ln | 0.66mi | 3/1.0 (+1) | 1,080 (+7%) | 7mo | $78,400 | $73 | 47 |
| 218 Moyallen St | 0.74mi | 3/1.0 (+1) | 940 (-7%) | 6mo | $120,000 | $128 | 44 |
| 65 Hutson St | 0.70mi | 2/2.0 | 1,100 (+9%) | 5mo | $125,000 | $114 | 43 |
| 69 Amherst Ave | 0.52mi | 3/1.5 (+1) | 1,157 (+15%) | 2mo | $180,000 | $156 | 43 |
| 415 Carey Ave | 0.61mi | 1/1.0 (-1) | 1,134 (+12%) | 6mo | $90,000 | $79 | 40 |
Match score weights: distance 35% · size 25% · config 20% · recency 20%. Top-matched comps best support the ARV.
Projected returns pro-forma
-3.0% appreciation · 6.84% rent growth · sell at horizon
- IRR
- 12.0%
- Equity multiple
- 1.50×
- Total profit
- $13,255
- Equity at exit
- $14,165
- IRR
- 23.8%
- Equity multiple
- 3.44×
- Total profit
- $64,896
- Equity at exit
- $8,214
Cash invested: $26,600 (down + closing). Projections, not guarantees.
Landlord ↔ Tenant lean methodology
- Overall (STATE)
- 62 Landlord-Friendly
- State Pennsylvania
- 62 Landlord-Friendly · EVEN
- County
- — inherits STATE
- City
- — inherits STATE
ZIP-level market 18702
- Rents YoY
- 6.8%
- Active inventory
- 221
- Price-to-rent
- 6.1×
Monthly cashflow live
- Estimated rent
- $1,297 high interval (Pro) →
- Mortgage (P&I)
- −$498
- Tax est. 1.5%
- −$119 /mo · $1,425/yr
- Insurance
- −$40
- HOA
- −$0
- Vacancy / Maint / Mgmt
- −$272
- Net cashflow
- $368
Break-even live
UW: 25.0% down · 7.5% · 30yr · 1.5% tax · 5.0% vac · 8.0% maint · 8.0% mgmt
Financing live
Cash to close
- Down payment
- $23,750
- Closing costs
- $2,850
- Reserves months
- —
- Total cash needed
- —
Loan-product check · same deal, 3 products live
Conventional
25% down · 7.5% · 30yr
- Down + closing
- —
- Monthly P&I
- —
- Monthly cashflow
- —
- DSCR
- —
- Eligible?
- —
Personal DTI + credit; lowest rate.
DSCR
20% down · 8.5% · 30yr
- Down + closing
- —
- Monthly P&I
- —
- Monthly cashflow
- —
- DSCR
- —
- Eligible?
- —
No personal income docs; deal must DSCR.
Hard money
10% down · 12.0% · 12mo
- Down + closing
- —
- Monthly P&I
- —
- Monthly cashflow
- —
- DSCR
- —
- Eligible?
- —
Short-term bridge; refi at stabilization.
Rent comps 40 comps
| Address | Beds | Baths | Sqft | Rent | $/sqft | DOM | Units | Dist |
|---|---|---|---|---|---|---|---|---|
| 132 Sambourne St Wilkes Barre, PA | 2.0 | 1.0 | 1000 | $1,250 | $1.25 | 21d | 1 | 0.16mi |
| 131 Academy St Wilkes Barre, PA | 3.0 | 1.0 | 1300 | $1,500 | $1.15 | 43d | 1 | 0.19mi |
| 75 Wood St Wilkes Barre, PA | 2.0 | 1.0 | 990 | $1,300 | $1.31 | 43d | 1 | 0.21mi |
| 403 S Franklin St Wilkes Barre, PA | 2.0 | 1.0 | 900 | $1,050 | $1.17 | 21d | 1 | 0.22mi |
| 366 S River St Apt 3 Wilkes-Barre, PA | 1.0 | 1.0 | 1000 | $975 | $0.97 | 21d | 1 | 0.27mi |
| 155 W River St Wilkes Barre, PA | 3.0 | 2.0 | 1100 | $1,425 | $1.30 | 43d | 1 | 0.27mi |
| 26 Stanley St Wilkes Barre, PA | 2.0 | 1.0 | 950 | $1,650 | $1.74 | 43d | 1 | 0.30mi |
| 34 Barney St Fl Right Wilkes-Barre, PA | 2.0 | 1.0 | 1000 | $1,195 | $1.20 | 43d | 1 | 0.33mi |
| 159 New Mallery Pl Unit 2 Wilkes-Barre, PA | 2.0 | 1.0 | 1020 | $950 | $0.93 | 43d | 1 | 0.38mi |
| 224 New Mallery Pl Wilkes Barre, PA | 2.0 | 1.0 | 850 | $1,000 | $1.18 | 13d | 1 | 0.42mi |
| 100-102 Westminster St Wilkes-Barre, PA | 2.0 | 1.0 | 1100 | $1,150 | $1.05 | 13d | 1 | 0.43mi |
| 100-102 Westminster St Wilkes-Barre, PA | 2.0 | 1.0 | 1200 | $1,150 | $0.96 | 21d | 1 | 0.43mi |
| 156 Hanover St Wilkes Barre, PA | 3.0 | 1.0 | 850 | $1,300 | $1.53 | 13d | 1 | 0.45mi |
| 154 Hanover St Unit A Wilkes-Barre, PA | 1.0 | 1.0 | 1050 | $1,150 | $1.10 | 43d | 1 | 0.45mi |
| 86 Maffett St Wilkes-Barre, PA | 2.0 | 1.0 | 1032 | $1,300 | $1.26 | 43d | 1 | 0.58mi |
| 75 Melrose Ave Apt 2 Wilkes-Barre, PA | 2.0 | 1.0 | 1150 | $1,250 | $1.09 | 43d | 1 | 0.60mi |
| 26 Bradford St Wilkes Barre, PA | 3.0 | 1.5 | 1056 | $1,400 | $1.33 | 13d | 1 | 0.63mi |
| 150 S Franklin St Wilkes Barre, PA | 2.0 | 1.0 | 850 | $1,750 | $2.06 | 43d | 1 | 0.69mi |
| 62 Hutson St Unit 1 Wilkes-Barre, PA | 2.0 | 1.0 | 730 | $1,250 | $1.71 | 13d | 1 | 0.69mi |
| 62 Hutson St Wilkes Barre, PA | 2.0 | 1.0 | 1100 | $1,150 | $1.05 | 43d | 1 | 0.69mi |
| 216 Horton St Wilkes Barre, PA | 3.0 | 1.5 | 1475 | $1,575 | $1.07 | 43d | 1 | 0.69mi |
| 129 Carlisle St Wilkes Barre, PA | 2.0 | 1.0 | 1005 | $1,200 | $1.19 | 13d | 1 | 0.74mi |
| 284 Barney St Wilkes Barre, PA | 3.0 | 1.0 | 1070 | $1,600 | $1.50 | 44d | 1 | 0.79mi |
| 166 Brook St Wilkes Barre, PA | 1.0 | 1.0 | 850 | $1,100 | $1.29 | 13d | 1 | 0.83mi |
| 342 Horton St Wilkes Barre, PA | 3.0 | 1.5 | 1472 | $1,650 | $1.12 | 13d | 1 | 0.83mi |
| 27 Oak St Wilkes Barre, PA | 3.0 | 1.5 | 1500 | $1,700 | $1.13 | 43d | 1 | 0.87mi |
| 32 Murray St Unit 34 Wilkes-Barre, PA | 3.0 | 1.0 | 930 | $1,100 | $1.18 | 21d | 1 | 0.87mi |
| 239 Poplar St Wilkes Barre, PA | 3.0 | 1.5 | 1100 | $1,350 | $1.23 | 43d | 1 | 0.88mi |
| 38 W Market St Unit 3 Wilkes-Barre, PA | 2.0 | 1.0 | 1388 | $1,295 | $0.93 | 13d | 1 | 0.96mi |
| 67-69 Public Sq #1203 Wilkes Barre, PA | 2.0 | 1.0 | 875 | $1,825 | $2.09 | 43d | 1 | 0.96mi |
| 200 Gateway Dr Kingston, PA | 1.0–3.0 | 1.0–2.0 | 1130 | $2,428 | $2.15 | 13d | 1 | 0.96mi |
| 67-69 Public Sq Wilkes-Barre, PA | 2.0 | 1.0 | 910 | $1,875 | $2.06 | 43d | 1 | 0.97mi |
| 13 Woodbury St Hanover Township, PA | 2.0 | 1.0 | 1000 | $1,100 | $1.10 | 43d | 1 | 0.99mi |
| 19 N River St Unit 403 Wilkes-Barre, PA | 2.0 | 1.0 | 723 | $1,600 | $2.21 | 13d | 1 | 1.00mi |
| 19 N River St Unit 308 Wilkes-Barre, PA | 2.0 | 1.5 | 910 | $1,600 | $1.76 | 13d | 1 | 1.00mi |
| 300 Market St Ste 104 Kingston, PA | 2.0 | 2.0 | 873 | $1,950 | $2.23 | 13d | 1 | 1.08mi |
| 407 McLean St Wilkes Barre, PA | 3.0 | 1.0 | 1482 | $1,400 | $0.94 | 13d | 1 | 1.08mi |
| 75 Oxford St Hanover Township, PA | 2.0 | 1.0 | 900 | $950 | $1.06 | 13d | 1 | 1.09mi |
| 233 Gilligan St Wilkes Barre, PA | 3.0 | 1.0 | 1440 | $1,600 | $1.11 | 21d | 1 | 1.11mi |
| 27 S Gates Ave Kingston, PA | 3.0 | 2.0 | 1200 | $1,750 | $1.46 | 21d | 1 | 1.12mi |
Listing history 6 events
-
2026-05-06status Pending 233-char remark
-
2026-05-01status Active 233-char remark
-
2026-04-28historical 233-char remark
-
2026-04-27$95,000 Active 233-char remark
-
2024-02-27historical $1,000
-
2023-10-20$1,000
ⓘ Source: listings_history table (triggers on properties + properties_extension) + one-shot
backfill from property_details.listing_events for pre-trigger history.
Climate risk First Street
- Flood 6/10 Major FEMA zone X · 27% chance over 30 yrs
- Wildfire 3/10 Moderate
- Heat 4/10 Moderate 7 d/yr ≥97°F today · 16 d/yr by 30 yrs out
- Wind 3/10 Moderate 5% chance of damaging wind over 30 yrs
- Air quality 2/10 Low 1 unhealthy d/yr today · 2 by 30 yrs out
Nearby sold comps map
Loading sold comps map…
Walkable amenities ~0.75 mi
Loading nearby amenities…
Taxation est. · year 1
- Rental income
- $15,560
- − Mortgage interest
- −$5,321
- − Property taxes
- −$1,425
- − Insurance
- −$475
- − Repairs & maintenance
- −$1,245
- − Management
- −$1,245
- − Depreciation
- −$2,764
- Taxable income
- $3,085
- Est. tax owed @ 24.0%
- −$740
- After-tax cash flow
- $3,673/yr
For passive investors: Depreciation is non-cash, so a rental often shows a tax loss while cash-flowing — sheltering income. Rental losses are passive: they offset passive income freely, and up to $25,000/yr can offset ordinary (W-2) income if you actively participate and your MAGI is under $100k (phasing out to $0 by $150k); unused losses carry forward. On sale, claimed depreciation is recaptured at up to 25%, and gains may owe capital-gains tax (a 1031 exchange can defer both). Figures are a year-1 estimate at your 24.0% rate — not tax advice; consult a CPA.
Condition & rehab AI · 12 photos
This property requires moderate renovations to improve its condition and increase its value. Exterior siding, kitchen, and bathroom updates are recommended to enhance both resale and rental value.
Repairs flagged
- Major exterior siding — Significant wear and tear
- Major kitchen cabinets — Old and outdated
- Major bathroom fixtures — Small and outdated
- Major interior walls — Worn wallpaper and peeling paint
- Major landscaping — Overgrown vegetation
Value-add opportunities
- Both exterior siding replacement — Enhances curb appeal and value
- Both kitchen renovation — Modernizes space and increases value
- Both bathroom renovation — Expands living space and adds value
- Both interior paint — Freshens up the interior and enhances value
- Both landscaping — Improves curb appeal and adds value
Renovation cost estimate screening
| Repair item | Severity | Est. cost |
|---|---|---|
| exterior siding · Significant wear and tear | Major | $15,000–50,000 |
| kitchen cabinets · Old and outdated | Major | $15,000–50,000 |
| bathroom fixtures · Small and outdated | Major | $15,000–50,000 |
| interior walls · Worn wallpaper and peeling paint | Major | $15,000–50,000 |
| landscaping · Overgrown vegetation | Major | $15,000–50,000 |
| Total estimated repair cost · 5 items | $75,000–250,000 |
Value-add ROI direction
- Both exterior siding replacement — Enhances curb appeal and value ↑
- Both kitchen renovation — Modernizes space and increases value ↑
- Both bathroom renovation — Expands living space and adds value ↑
- Both interior paint — Freshens up the interior and enhances value ↑
- Both landscaping — Improves curb appeal and adds value ↑
ⓘ Cost ranges are severity-bucket heuristics (US national rule-of-thumb). Get contractor quotes + a written scope before underwriting a rehab budget.
Schools (NCES district)
- District
- Wilkes-Barre Area SD
- NCES district ID
- 4226300
- Math proficiency
- 19% ▼ -2.00%
- Reading proficiency
- 32% ▼ -9.00%
- Median HH income
- $37,420
- Composite
- 21.22/100
- National rank
- #8409
- State rank
- #469 of 539 in PA
Livability — Wilkes-Barre
No livability data for this city. (Only ~50 U.S. cities are tracked.)
Census & demographics
- Census place
- Wilkes-Barre, PA
- County
- Luzerne County · 118,885 people
- City population
- 73,981
- Metro
- Scranton--Wilkes-Barre, PA
- Population (ZIP)
- 41,970
- Household income
- $56,378
- Rent vs Own
- Severe rent burden
- 1632.0
Population outlook (Luzerne County) Hauer SSP2
- Today (2025)
- 319,505 people
- By 2030
- 319,943 · +0.1%
- By 2040
- 322,643 · +1.0%
- By 2050
- 330,817 · +3.5%
- By 2075
- 379,145 · +18.7%
- By 2100
- 431,908 · +35.2%
Race, ethnicity, and origin ACS 2023
- Neighborhood character
- Diverse neighborhood (Simpson 0.59)
- Race & ethnicity
- White 58% Hispanic / Latino 25% Black 12% Two or more races 11% Asian 2%
- Hispanic origin (detail)
- Mexican 6% Puerto Rican 6% Dominican 9%
- Common ancestry
- Romanian 14% Scotch-Irish 2% Iranian 1%
- Foreign-born
- 13% · Canada, Jamaica
- Languages at home
- 79% English-only · Spanish 17% Other Asian/Pacific 1% Other Indo-European 1%
Political lean MEDSL · Luzerne
- 2024 margin
- R (+19.2) · D 40.0% · R 59.2%
- 2008→2024 swing
- -27.6pp toward R · 2008: 8.4pp · 2024: -19.2pp
- All cycles
- 2024: R+19.2 2020: R+14.4 2016: R+19.6 2012: D+4.8 2008: D+8.4
Not yet ingested
- Civics
- —
Market trends
- HPI YoY
- ▼ -156.99%
- Current HPI
- 216.9373
- Rent YoY
- ▲ 6.84%
- Metro
- Scranton--Wilkes-Barre, PA
- State GDP YoY
- ▲ 1.68%
- F500 in state
- 34
Industry mix (Fortune 500 HQ in PA)
| Industry | F500 HQs | Revenue |
|---|---|---|
| Healthcare | 2 | $309B |
|
||
| Insurance | 2 | $27B |
|
||
| Telecommunications / Media | 1 | $124B |
|
||
| Industrial Distribution | 1 | $22B |
|
||
| Financial Services | 1 | $20B |
|
||
| Chemicals / Materials | 1 | $18B |
|
||
Price history
+9800.0% since first listed7 events — show timeline
- 2026-06-11 Sold (MLS) $99,000 LCAR
- 2026-05-06 Pending — LCAR
- 2026-05-01 Relisted — LCAR
- 2026-04-28 Delisted — LCAR
- 2026-04-27 Listed $95,000 LCAR
- 2024-02-27 Rental Removed $1,000 LCAR
- 2023-10-20 Listed for Rent $1,000 LCAR
Cash-flow waterfall
monthlySold comps — $/sqft
last 12 mo · ≤1 miLoading sold comps…