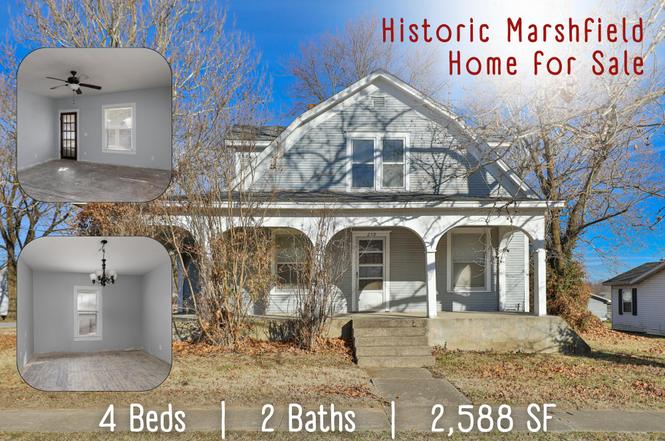
259 E Jefferson St · Marshfield, MO
Flood risk 1/10 · Minimal
- FEMA flood zone
- X (unshaded)
- Chance of flooding over 30 yrs
- 0.0%
- Est. flood insurance / yr
- $507 – $1,088
Fire risk 3/10 · Minor
- Est. fire insurance / yr
- $1,054 – $1,958
Heat risk 5/10 · Moderate
- Hot days now (above 105°F)
- 7 days/yr
- Hot days in 30 yrs
- 20 days/yr
Wind risk 2/10 · Minimal
- Chance of severe wind over 30 yrs
- —
Air-quality risk 2/10 · Minimal
- Unhealthy air days now
- 0 days/yr
- Unhealthy air days in 30 yrs
- 1 days/yr
Risk factors via First Street. Map © Google.
Why this score? — see what drove the C grade
The composite is a weighted blend of 9 inputs, each scored 0–100. Each bar is that input's sub-score; the figure is the points it added to the 100-point composite (weight × sub-score).
- Cash flow +25.3/30.0
- DSCR +8.4/10.0
- ARV discount +7.5/15.0
- 1% rule +5.5/10.0
- Livability +3.5/5.0
- Schools +3.0/10.0
- Rent growth +2.5/5.0
- Condition / age +2.5/5.0
- Appreciation +0.0/10.0
$115,000
🖨 Deal sheet 📄 Offer letter ✓ Due diligence
Listing remarks MLS
Talk about some HISTORY! It has been said that this home was one of the only homes standing after the 1880 tornado in Marshfield. It is need of some love to restore it to its past beauty. Located 2 blocks off of the Marshfield square is a great location. Only 1 block away from the new Webster County Building expected to go up soon. What a great opportunity! Come take a look! Property is sold ''as is, where is''. Buyer and Buyer's agent need to do there own due diligence. Water will not be turned on for inspections.
Key facts
- Plumbing
- Large front porch
- Drywall
Tags
Property features AI
Exterior
- Parking: Driveway; Garage faces front; 1-car garage
- Utilities: Public water; Public sewer
- Home design: Single-family residence; Two levels
- Construction: Wood siding; Composition roof
- Exterior features: Covered wrap-around porch; Corner lot; Has view; City street frontage; Publicly maintained road
Interior
- Flooring: Hardwood
- Bathrooms: 2 full bathrooms
- Heating & cooling: No heating; No cooling
- Interior features: Electric water heater; Unfinished partial basement; Hardwood floors
Neighborhood map
What this means for you Summary
Snapshot
- This is a 4-bed/2.0-bath other listed at $115k.
Deal economics
- At list price, monthly cash flow is $262 ($3k/yr) — positive.
- The deal already cash-flows at list — no discount required.
- Meets the 1% rule at list price ($1k rent vs $115k).
- Recommended offer: $105k (9.0% below list) — sets the bar for market timing.
- Cap rate 9.0% vs local median 2.7% in Marshfield — top-decile yield for the area; either an underpriced asset or a hidden risk that comps aren't pricing in. Stress-test before assuming the spread holds.
Location & tenants
- Location reads 70/100 on livability (#137 in MO) — a middle-class / working-renter tenant base. Strengths: cost of living A+, housing A+, crime B; Watch: employment D+, amenities F, commute F.
- Marshfield R-I (town): math 32% / reading 39% proficiency, ranked #209 of 324 in MO (top 64%) — families likely to look elsewhere, expect single-tenant / working-renter base with shorter leases.
- Zoned schools: Marshfield Early Learning Cntr (174 students, 35% FRL); Marshfield Jr. High (math 35% / reading 40%, grade F, #215 of 391 statewide, top 56%, 670 students, 45% FRL); Marshfield High (math 27% / reading 45%, grade F, #313 of 521 statewide, top 60%, 916 students, 40% FRL) — zoned schools at 40% FRL track the district average.
- Market conditions: 135 active listings in the ZIP; 168 units permitted in Webster County in 2024 (24 in 5+ unit buildings).
Forward outlook
- Local home prices are declining (-3.0%/yr); year-one equity from $795 of loan paydown is wiped out by about $3k of value loss. Plan a longer hold.
- Webster County population projected at +5% by 2050 — modest demand growth; plan on rents tracking national, not racing it.
Negotiation context
- It's been on market 97 days — a 9% lower offer ($105k) is reasonable based on typical stale-listing flexibility.
- 3 sale attempts since 9y ago with the ask held roughly flat each time — persistent listings suggest the price (not the market) is what's stuck; bring a comps-based counter.
Risks & watch-outs
- Watch-outs: built in 1880 — expect roof / HVAC / electrical / plumbing capex.
- Climate carrying-cost: extreme-heat days projected 7→20/yr by 2055 (HVAC capex compounding) — expect insurance premiums to compound above CPI over the hold.
Questions for the listing agent
- It's been on market 97 days. Have you received any prior offers? Is the seller open to a 9% concession, seller financing, or rate buy-down credit?
- Built in 1880 — when were the roof, HVAC, electrical panel, plumbing, and water heater last replaced?
- Why hasn't it sold? Are there any deal-killer items the seller is aware of (foundation, flood, title, zoning, code violations)?
- Is there a deadline driving the sale (1031 exchange, divorce, estate, relocation)? That informs how much negotiation room exists.
- Schools are D-rated, which usually means shorter tenancies and higher turnover. Who's the typical renter profile here, and what's been the actual vacancy rate?
- What's the average days-on-market for RENTAL listings here right now (not sales)? A rising rental-DOM trend means longer vacancies and softer asking-rent achievability than the comps imply.
- What's the recent tenant-quality profile in this submarket — average credit score on applications, eviction rate, late-payment / NSF rate, and stable-employment percentage? A property-management company in the area should have these aggregated.
- How much new for-sale + rental construction is in the pipeline within 1–3 miles? Heavy new supply typically softens prices + rents 12–24 months out; constrained supply supports both.
Investment metrics
- 1% rule
- 1.05% ✓
- Cap rate
- 9.03%
- Cash-on-cash
- 9.78%
- DSCR
- 1.44
- GRM
- 7.9
CMA / ARV
No comps found within radius.
Projected returns pro-forma
-3.0% appreciation · 3.0% rent growth · sell at horizon
- IRR
- -1.6%
- Equity multiple
- 0.94×
- Total profit
- $-1,972
- Equity at exit
- $17,147
- IRR
- 8.0%
- Equity multiple
- 1.61×
- Total profit
- $19,612
- Equity at exit
- $9,943
Cash invested: $32,200 (down + closing). Projections, not guarantees.
Landlord ↔ Tenant lean methodology
- Overall (STATE)
- 81 Strongly Landlord-Friendly
- State Missouri
- 81 Strongly Landlord-Friendly · R+10
- County
- — inherits STATE
- City
- — inherits STATE
ZIP-level market 65706
- Home prices YoY
- -18.7%
- Active inventory
- 135
- Price-to-rent
- 7.9×
Monthly cashflow live
- Estimated rent
- $1,206 medium interval (Pro) →
- Mortgage (P&I)
- −$603
- Tax from tax record
- −$39 /mo · $472/yr
- Insurance
- −$48
- HOA
- −$0
- Vacancy / Maint / Mgmt
- −$253
- Net cashflow
- $262
Break-even live
UW: 25.0% down · 7.5% · 30yr · 1.5% tax · 5.0% vac · 8.0% maint · 8.0% mgmt
Financing live
Cash to close
- Down payment
- $28,750
- Closing costs
- $3,450
- Reserves months
- —
- Total cash needed
- —
Loan-product check · same deal, 3 products live
Conventional
25% down · 7.5% · 30yr
- Down + closing
- —
- Monthly P&I
- —
- Monthly cashflow
- —
- DSCR
- —
- Eligible?
- —
Personal DTI + credit; lowest rate.
DSCR
20% down · 8.5% · 30yr
- Down + closing
- —
- Monthly P&I
- —
- Monthly cashflow
- —
- DSCR
- —
- Eligible?
- —
No personal income docs; deal must DSCR.
Hard money
10% down · 12.0% · 12mo
- Down + closing
- —
- Monthly P&I
- —
- Monthly cashflow
- —
- DSCR
- —
- Eligible?
- —
Short-term bridge; refi at stabilization.
Listing history 5 events
-
2026-05-22status Active
-
2026-04-15status Pending
-
2026-01-13$115,000 Active
-
2017-09-13soldstatus 520-char remark
Show marketing remark (520 chars)
Talk about some HISTORY! It has been said that this home was one of the only homes standing after the 1880 tornado in Marshfield. It is need of some love to restore it to its past beauty. Located 2 blocks off of the Marshfield square is a great location. Only 1 block away from the new Webster County Building expected to go up soon. What a great opportunity! Come take a look! Property is sold ''as is, where is''. Buyer and Buyer's agent need to do there own due diligence. Water will not be turned on for inspections.
-
2017-02-09$27,500 520-char remark
Show marketing remark (520 chars)
Talk about some HISTORY! It has been said that this home was one of the only homes standing after the 1880 tornado in Marshfield. It is need of some love to restore it to its past beauty. Located 2 blocks off of the Marshfield square is a great location. Only 1 block away from the new Webster County Building expected to go up soon. What a great opportunity! Come take a look! Property is sold ''as is, where is''. Buyer and Buyer's agent need to do there own due diligence. Water will not be turned on for inspections.
ⓘ Source: listings_history table (triggers on properties + properties_extension) + one-shot
backfill from property_details.listing_events for pre-trigger history.
Tax reassessment forecast MO · Resets to sale price
- Current annual tax
- $472 · $39/mo
- Projected year-2 tax
- $1,116 · $93/mo
- Expected delta
- +$643/yr (+$54/mo · 136.2%)
ⓘ Screening estimate from a state-policy table — verify with the county assessor before closing.
Climate risk First Street
- Flood 1/10 Low FEMA zone X (unshaded) · 0% chance over 30 yrs
- Wildfire 3/10 Moderate
- Heat 5/10 Major 7 d/yr ≥105°F today · 20 d/yr by 30 yrs out
- Wind 2/10 Low
- Air quality 2/10 Low 0 unhealthy d/yr today · 1 by 30 yrs out
Nearby sold comps map
Loading sold comps map…
Walkable amenities ~0.75 mi
Loading nearby amenities…
Taxation est. · year 1
- Rental income
- $14,471
- − Mortgage interest
- −$6,442
- − Property taxes
- −$472
- − Insurance
- −$575
- − Repairs & maintenance
- −$1,158
- − Management
- −$1,158
- − Depreciation
- −$3,345
- Taxable income
- $1,321
- Est. tax owed @ 24.0%
- −$317
- After-tax cash flow
- $2,831/yr
For passive investors: Depreciation is non-cash, so a rental often shows a tax loss while cash-flowing — sheltering income. Rental losses are passive: they offset passive income freely, and up to $25,000/yr can offset ordinary (W-2) income if you actively participate and your MAGI is under $100k (phasing out to $0 by $150k); unused losses carry forward. On sale, claimed depreciation is recaptured at up to 25%, and gains may owe capital-gains tax (a 1031 exchange can defer both). Figures are a year-1 estimate at your 24.0% rate — not tax advice; consult a CPA.
Schools (NCES district)
- District
- Marshfield R-I
- NCES district ID
- 2920430
- Math proficiency
- 32% ▼ -7.00%
- Reading proficiency
- 39% ▼ -3.00%
- Median HH income
- $44,061
- Composite
- 30.17/100
- National rank
- #6320
- State rank
- #209 of 324 in MO
Livability — Marshfield
- Score
- 70/100
- State rank
- #137
- US rank
- #7803
Category grades
Schools grade is shown separately in the Schools card above.
Census & demographics
- Census place
- Marshfield, MO
- Population (ZIP)
- 17,479
Population outlook (Webster County) Hauer SSP2
- Today (2025)
- 39,400 people
- By 2030
- 40,125 · +1.8%
- By 2040
- 41,169 · +4.5%
- By 2050
- 41,286 · +4.8%
- By 2075
- 40,104 · +1.8%
- By 2100
- 33,683 · -14.5%
Race, ethnicity, and origin ACS 2023
- Neighborhood character
- Predominantly White (91%)
- Race & ethnicity
- White 91% Two or more races 6% Hispanic / Latino 2% Black 2%
- Common ancestry
- Slovak 2% Lithuanian 1% Iranian 1%
- Foreign-born
- 1%
- Languages at home
- 99% English-only · Spanish 1%
Political lean MEDSL · Webster
- 2024 margin
- Solid R (+62.2) · D 18.4% · R 80.7%
- 2008→2024 swing
- -33.2pp toward R · 2008: -29.0pp · 2024: -62.2pp
- All cycles
- 2024: R+62.2 2020: R+60.2 2016: R+57.9 2012: R+40.8 2008: R+29.0
Not yet ingested
- Civics
- —
Market trends
- HPI YoY
- ▼ -54.05%
- Current HPI
- 235.6143
- Rent YoY
- —
- Metro
- —
- State GDP YoY
- ▲ 1.84%
- F500 in state
- 20
Industry mix (Fortune 500 HQ in MO)
| Industry | F500 HQs | Revenue |
|---|---|---|
| Healthcare | 1 | $163B |
|
||
| Insurance | 1 | $21B |
|
||
| Industrial Technology | 1 | $17B |
|
||
| Retail | 1 | $16B |
|
||
| Industrial Distribution | 1 | $10B |
|
||
| Utilities | 1 | $9B |
|
||
Price history
+318.2% since first listed5 events — show timeline
- 2026-05-22 Relisted — SOMO
- 2026-04-15 Pending — SOMO
- 2026-01-13 Listed $115,000 SOMO
- 2017-09-13 Sold (MLS) — SOMO
- 2017-02-09 Listed $27,500 SOMO
Property tax history
+3.4%/yrLatest (2025): $472 · +6.7% YoY. Source: county tax records.
Cash-flow waterfall
monthlySold comps — $/sqft
last 12 mo · ≤1 miLoading sold comps…