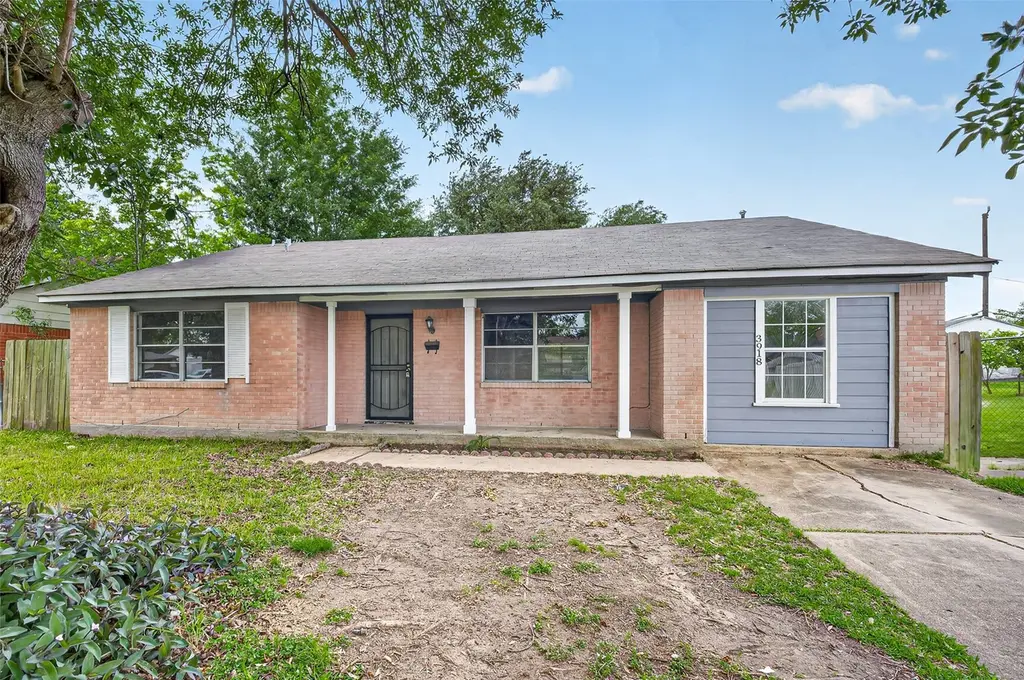
3918 Tavenor Ln · Houston, TX
Flood risk 3/10 · Minor
- FEMA flood zone
- X (unshaded)
- Chance of flooding over 30 yrs
- 0.1%
- Est. flood insurance / yr
- $507 – $1,088
Fire risk 2/10 · Minimal
- Est. fire insurance / yr
- $1,222 – $2,270
Heat risk 9/10 · Severe
- Hot days now (above 109°F)
- 6 days/yr
- Hot days in 30 yrs
- 19 days/yr
Wind risk 9/10 · Severe
- Chance of severe wind over 30 yrs
- 99.0%
Air-quality risk 2/10 · Minimal
- Unhealthy air days now
- 2 days/yr
- Unhealthy air days in 30 yrs
- 2 days/yr
Risk factors via First Street. Map © Google.
Why this score? — see what drove the C- grade
The composite is a weighted blend of 9 inputs, each scored 0–100. Each bar is that input's sub-score; the figure is the points it added to the 100-point composite (weight × sub-score).
- Cash flow +18.5/30.0
- ARV discount +10.6/15.0
- DSCR +5.8/10.0
- 1% rule +5.6/10.0
- Livability +3.7/5.0
- Schools +2.7/10.0
- Condition / age +2.5/5.0
- Rent growth +2.4/5.0
- Appreciation +0.0/10.0
$182,000
🖨 Deal sheet 📄 Offer letter ✓ Due diligence
Listing remarks
Location, location, location! This home at 3918 Tavenor Lane offers a great opportunity for investors and first-time buyers in a growing Houston neighborhood. The property is turn-key and ready for immediate occupancy or rental. Conveniently located near the Texas Medical Center, NRG Stadium, Downtown Houston, and Third Ward, with easy access to Highway 288, Beltway 8, and 610, it offers excellent convenience and strong long-term investment potential. This property is occupied. Please do not disturb the tenant.
Key facts
- Near nrg stadium
- 6,089 sq ft lot
- Built 1963
Tags
Property features AI
Exterior
- Utilities: Public water; Public sewer
- Home design: Residential property; Single-story entry (built in 1963)
- Construction: Built in 1963; Slab foundation; Composition roof; Construction materials: Unknown
- Exterior features: Located in a subdivision
Interior
- Bathrooms: 2 full bathrooms
- Heating & cooling: Central heating (electric and gas); Central air conditioning (electric and gas)
- Interior features: Total of 4 rooms
Neighborhood map
What this means for you Summary
Snapshot
- This is a 3-bed/2.0-bath single-family listed at $182k.
Deal economics
- At list price, monthly cash flow is $173 ($2k/yr) — positive.
- The deal already cash-flows at list — no discount required.
- Meets the 1% rule at list price ($2k rent vs $182k).
- Recommended offer: $177k (3.0% below list) — sets the bar for market timing.
- Cap rate 7.4% vs local median 3.2% in Houston — top-decile yield for the area; either an underpriced asset or a hidden risk that comps aren't pricing in. Stress-test before assuming the spread holds.
Location & tenants
- Location reads 74/100 on livability (#184 in TX, #4,771 nationally) — a middle-class / working-renter tenant base. Strengths: amenities A+, cost of living A+, housing A+; Watch: crime F.
- Houston ISD (urban): math 27% / reading 35% proficiency, ranked #593 of 826 in TX (top 72%) — families likely to look elsewhere, expect single-tenant / working-renter base with shorter leases; 71% free/reduced lunch — lower-income household profile, screen leases tightly.
- Zoned schools: Thomas Middle (math 3% / reading 13%, grade F, #1,654 of 1,662 statewide, top 100%, 526 students, 98% FRL); Worthing H S (math 22% / reading 21%, grade F, #1,377 of 1,632 statewide, top 85%, 827 students, 96% FRL) — zoned schools average 97% FRL vs 71% district-wide (26 pts higher); higher-poverty schools than district average — tighter screening recommended.
- Zoned-school proficiency averages 15% at this address vs 31% district-wide (-16 pts) — the specific schools serving this property underperform the Houston ISD average; the district grade overstates school quality for this exact location.
- Market conditions: Rents soft (-0.2%/yr); 280 active listings in the ZIP; 16 comparable units currently listed for rent nearby; rentals at typical pace (median 19d on market — plan ~3-4 weeks tenant-placement turnaround); solid renter incomes; 29,883 units permitted in Harris County in 2024 (8,621 in 5+ unit buildings).
Forward outlook
- Local home prices are declining (-3.0%/yr); year-one equity from $1k of loan paydown is wiped out by about $5k of value loss. Plan a longer hold.
- Harris County population projected at +47% by 2050 — long-run rental-demand tailwind backs the buy-and-hold thesis.
Negotiation context
- It's been on market 36 days — a 3% lower offer ($177k) is reasonable based on typical stale-listing flexibility.
- 6 sale attempts; this cycle's ask is 9479% above the opening price — seller raised mid-cycle; expect resistance to lowballs.
Risks & watch-outs
- Climate carrying-cost: severe wind risk, 99% chance of damaging wind over 30y; extreme-heat days projected 6→19/yr by 2055 (HVAC capex compounding) — expect insurance premiums to compound above CPI over the hold.
Questions for the listing agent
- It's been on market 36 days. Have you received any prior offers? Is the seller open to a 3% concession, seller financing, or rate buy-down credit?
- Built in 1963 — when were the roof, HVAC, electrical panel, plumbing, and water heater last replaced?
- Is there a deadline driving the sale (1031 exchange, divorce, estate, relocation)? That informs how much negotiation room exists.
- Schools are D-rated, which usually means shorter tenancies and higher turnover. Who's the typical renter profile here, and what's been the actual vacancy rate?
- Crime grade is F in this area — have there been break-ins, vandalism, or insurance claims at this property in the last 3 years? What carrier currently insures it and at what premium?
- What's the average days-on-market for RENTAL listings here right now (not sales)? A rising rental-DOM trend means longer vacancies and softer asking-rent achievability than the comps imply.
- What's the recent tenant-quality profile in this submarket — average credit score on applications, eviction rate, late-payment / NSF rate, and stable-employment percentage? A property-management company in the area should have these aggregated.
- How much new for-sale + rental construction is in the pipeline within 1–3 miles? Heavy new supply typically softens prices + rents 12–24 months out; constrained supply supports both.
Investment metrics
- 1% rule
- 1.06% ✓
- Cap rate
- 7.43%
- Cash-on-cash
- 4.07%
- DSCR
- 1.18
- GRM
- 7.9
CMA / ARV
- ARV (median comp)
- $195,487
- List price
- $182,000
- Delta
- -6.90%
- Verdict
- FAIR
- Comps
- 20 within 1.0 mi
Show comp detail 12 sales within ~0.75 mi
| Address | Dist | Beds/Ba | Sqft | Sold | Price | $/sf | Match |
|---|---|---|---|---|---|---|---|
| 11404 Lucky Falls Dr | 0.33mi | 3/2.5 | 1,775 (+2%) | 2mo | $329,760 | $186 | 79 |
| 11408 Lucky Falls Dr | 0.32mi | 2/2.5 (-1) | 1,775 (+2%) | 1mo | $367,999 | $207 | 74 |
| 11405 Galway Grove Dr | 0.34mi | 3/2.5 | 1,836 (+5%) | 0mo | $299,900 | $163 | 73 |
| 3327 Young Clover Way | 0.39mi | 4/2.5 (+1) | 1,731 (-1%) | 1mo | $299,900 | $173 | 73 |
| 11410 Waterford Spring Trl | 0.47mi | 4/2.5 (+1) | 1,731 (-1%) | 1mo | $304,900 | $176 | 69 |
| 4018 Marchant Rd | 0.51mi | 3/2.0 | 1,800 (+3%) | 3mo | $249,990 | $139 | 68 |
| 4407 Mowery Rd | 0.41mi | 3/2.5 | 1,556 (-11%) | 2mo | $99,000 | $64 | 59 |
| 4330 Fairgreen Ln | 0.42mi | 4/2.0 (+1) | 1,586 (-9%) | 5mo | $130,000 | $82 | 56 |
| 11408 Waterford Spring Trl | 0.48mi | 4/2.5 (+1) | 1,556 (-11%) | 1mo | $277,900 | $179 | 52 |
| 4322 Friar Point Rd | 0.61mi | 3/2.0 | 1,508 (-14%) | 2mo | $225,000 | $149 | 47 |
| 12027 Duane St | 0.54mi | 4/2.0 (+1) | 1,504 (-14%) | 4mo | $248,000 | $165 | 43 |
| 12821 Donegal Way | 0.72mi | 4/2.0 (+1) | 1,512 (-13%) | 1mo | $239,000 | $158 | 38 |
Match score weights: distance 35% · size 25% · config 20% · recency 20%. Top-matched comps best support the ARV.
Projected returns pro-forma
-3.0% appreciation · 0.0% rent growth · sell at horizon
- IRR
- -13.5%
- Equity multiple
- 0.53×
- Total profit
- $-24,046
- Equity at exit
- $27,137
- IRR
- -10.7%
- Equity multiple
- 0.45×
- Total profit
- $-28,261
- Equity at exit
- $15,736
Cash invested: $50,960 (down + closing). Projections, not guarantees.
Landlord ↔ Tenant lean methodology
- Overall (STATE)
- 87 Strongly Landlord-Friendly
- State Texas
- 87 Strongly Landlord-Friendly · R+5
- County
- — inherits STATE
- City
- — inherits STATE
ZIP-level market 77047
- Home prices YoY
- -10.1%
- Rents YoY
- -0.2%
- Active inventory
- 280
- Price-to-rent
- 7.9×
Monthly cashflow live
- Estimated rent
- $1,930 high interval (Pro) →
- Mortgage (P&I)
- −$954
- Tax from tax record
- −$321 /mo · $3,858/yr
- Insurance
- −$76
- HOA
- −$0
- Vacancy / Maint / Mgmt
- −$405
- Net cashflow
- $173
Break-even live
UW: 25.0% down · 7.5% · 30yr · 1.5% tax · 5.0% vac · 8.0% maint · 8.0% mgmt
Financing live
Cash to close
- Down payment
- $45,500
- Closing costs
- $5,460
- Reserves months
- —
- Total cash needed
- —
Loan-product check · same deal, 3 products live
Conventional
25% down · 7.5% · 30yr
- Down + closing
- —
- Monthly P&I
- —
- Monthly cashflow
- —
- DSCR
- —
- Eligible?
- —
Personal DTI + credit; lowest rate.
DSCR
20% down · 8.5% · 30yr
- Down + closing
- —
- Monthly P&I
- —
- Monthly cashflow
- —
- DSCR
- —
- Eligible?
- —
No personal income docs; deal must DSCR.
Hard money
10% down · 12.0% · 12mo
- Down + closing
- —
- Monthly P&I
- —
- Monthly cashflow
- —
- DSCR
- —
- Eligible?
- —
Short-term bridge; refi at stabilization.
Rent comps 16 comps
| Address | Beds | Baths | Sqft | Rent | $/sqft | DOM | Units | Dist |
|---|---|---|---|---|---|---|---|---|
| 11819 Leitrim Way Houston, TX | 3.0 | 1.0 | 1476 | $1,150 | $0.78 | 5d | 1 | 0.14mi |
| 4015 Marchant Rd Houston, TX | 3.0 | 2.0 | 1200 | $1,700 | $1.42 | 43d | 1 | 0.46mi |
| 4510 Bungalow Ln Houston, TX | 3.0 | 2.5 | 2100 | $1,995 | $0.95 | 43d | 1 | 0.49mi |
| 12207 Duane Ct Houston, TX | 3.0 | 2.0 | 1548 | $1,691 | $1.09 | 7d | 1 | 0.60mi |
| 12320 Chesney Downs Dr Houston, TX | 4.0 | 2.5 | 2000 | $3,500 | $1.75 | 2d | 1 | 0.71mi |
| 12227 Cape Hyannis Dr Houston, TX | 3.0 | 2.0 | 1432 | $1,705 | $1.19 | 13d | 1 | 0.87mi |
| 12210 Roandale Dr Houston, TX | 3.0 | 2.0 | 1738 | $1,775 | $1.02 | 43d | 1 | 0.93mi |
| 11319 Murr Way Houston, TX | 3.0 | 1.5 | 1213 | $1,699 | $1.40 | 18d | 1 | 0.98mi |
| 3020 Gunnersbury Dr Houston, TX | 4.0 | 2.0 | 1670 | $1,499 | $0.90 | 14d | 1 | 1.02mi |
| 2920 Stamford Hill Ln Houston, TX | 3.0 | 2.0 | 1690 | $2,200 | $1.30 | 43d | 1 | 1.13mi |
| 3918 Almeda-Genoa Rd Houston, TX | 1.0–3.0 | 1.0–2.0 | 1038 | $2,220 | $2.14 | 1d | 26 | 1.23mi |
| 2937 Amherst Meadow Ln Houston, TX | 3.0 | 2.5 | 1820 | $2,450 | $1.35 | 21d | 1 | 1.28mi |
| 2937 Amherst Meadow Ln Unit NA Houston, TX | 3.0 | 2.5 | 1820 | $2,400 | $1.32 | 4d | 1 | 1.28mi |
| 9606 Ashville Dr Unit B Houston, TX | 3.0 | 2.0 | 1610 | $1,570 | $0.98 | 43d | 1 | 1.37mi |
| 10514 Wellesley Terrace Trl Houston, TX | 3.0 | 3.0 | 1843 | $2,300 | $1.25 | 17d | 1 | 1.39mi |
| 10415 Lancaster Ln Houston, TX | 3.0–4.0 | 2.5 | 1937 | $2,525 | $1.30 | 20d | 1 | 1.50mi |
Listing history 25 events
-
2026-06-18days on market $182,000 Active 36 DOM
-
2026-06-17pricedays on market $182,000 Active 35 DOM
-
2026-06-16days on market $185,000 Active 34 DOM
-
2026-06-15days on market $185,000 Active 33 DOM
-
2026-06-13days on market $185,000 Active 31 DOM
-
2026-06-10days on market $185,000 Active 27 DOM
-
2026-06-08days on market $185,000 Active 26 DOM
-
2026-06-07days on market $185,000 Active 25 DOM
-
2026-06-04days on market $185,000 Active 22 DOM
-
2026-06-01days on market $185,000 Active 19 DOM
-
2026-05-31days on market $185,000 Active 18 DOM
-
2026-05-14$1,900
-
2026-05-13historical $1,900
-
2026-05-13$195,000 Active 516-char remark
-
2026-05-13historical
-
2026-05-09price $190,000
-
2026-04-14$1,900
-
2026-03-10$195,000 Active
-
2026-03-10historical
-
2025-11-20$195,000 Active
-
2025-10-31historical
-
2025-06-09$199,999 Active
-
2018-11-14soldstatus
-
2018-11-14soldstatus
-
1988-01-02soldstatus
ⓘ Source: listings_history table (triggers on properties + properties_extension) + one-shot
backfill from property_details.listing_events for pre-trigger history.
Tax reassessment forecast TX · Resets to sale price
- Current annual tax
- $3,858 · $321/mo
- Projected year-2 tax
- $3,858 · $321/mo
- Expected delta
- $0/yr ($0/mo · 0.0%)
ⓘ Screening estimate from a state-policy table — verify with the county assessor before closing.
Climate risk First Street
- Flood 3/10 Moderate FEMA zone X (unshaded) · 10% chance over 30 yrs
- Wildfire 2/10 Low
- Heat 9/10 Extreme 6 d/yr ≥109°F today · 19 d/yr by 30 yrs out
- Wind 9/10 Extreme 99% chance of damaging wind over 30 yrs
- Air quality 2/10 Low 2 unhealthy d/yr today · 2 by 30 yrs out
Nearby sold comps map
Loading sold comps map…
Walkable amenities ~0.75 mi
Loading nearby amenities…
Taxation est. · year 1
- Rental income
- $23,160
- − Mortgage interest
- −$10,195
- − Property taxes
- −$3,858
- − Insurance
- −$910
- − Repairs & maintenance
- −$1,853
- − Management
- −$1,853
- − Depreciation
- −$5,295
- Taxable loss
- −$803
- Est. tax savings @ 24.0%
- +$193
- After-tax cash flow
- $2,268/yr
For passive investors: Depreciation is non-cash, so a rental often shows a tax loss while cash-flowing — sheltering income. Rental losses are passive: they offset passive income freely, and up to $25,000/yr can offset ordinary (W-2) income if you actively participate and your MAGI is under $100k (phasing out to $0 by $150k); unused losses carry forward. On sale, claimed depreciation is recaptured at up to 25%, and gains may owe capital-gains tax (a 1031 exchange can defer both). Figures are a year-1 estimate at your 24.0% rate — not tax advice; consult a CPA.
Schools (NCES district)
- District
- Houston ISD
- NCES district ID
- 4823640
- Math proficiency
- 27% ▼ -18.00%
- Reading proficiency
- 35% ▼ -6.00%
- Median HH income
- $46,054
- Composite
- 26.63/100
- National rank
- #7173
- State rank
- #593 of 826 in TX
Livability — Houston
- Score
- 74/100
- State rank
- #184
- US rank
- #4771
Category grades
Schools grade is shown separately in the Schools card above.
Census & demographics
- Census place
- Houston, TX
- County
- Harris County · 4,702,590 people
- City population
- 3,226,434
- Metro
- Houston-The Woodlands-Sugar Land, TX
- Population (ZIP)
- 34,987
- Household income
- $78,538
- Rent vs Own
- Severe rent burden
- 1109.0
Population outlook (Harris County) Hauer SSP2
- Today (2025)
- 5,571,493 people
- By 2030
- 6,089,821 · +9.3%
- By 2040
- 7,142,806 · +28.2%
- By 2050
- 8,185,864 · +46.9%
- By 2075
- 10,574,329 · +89.8%
- By 2100
- 12,109,958 · +117.4%
Race, ethnicity, and origin ACS 2023
- Neighborhood character
- Diverse neighborhood (Simpson 0.58)
- Race & ethnicity
- Black 57% Hispanic / Latino 29% Two or more races 15% White 6% Asian 3% Pacific Islander 1%
- Hispanic origin (detail)
- Mexican 24% Puerto Rican 1%
- Common ancestry
- Lithuanian 1%
- Foreign-born
- 15% · Canada, Vietnam
- Languages at home
- 70% English-only · Spanish 23% Vietnamese 1% Other Indo-European 1%
Political lean MEDSL · Harris
- 2024 margin
- Lean D (+5.5) · D 52.0% · R 46.4% · Other 1.6%
- 2008→2024 swing
- +3.9pp toward D · 2008: 1.6pp · 2024: 5.5pp
- All cycles
- 2024: D+5.5 2020: D+13.3 2016: D+12.4 2012: D+0.1 2008: D+1.6
Not yet ingested
- Civics
- —
Market trends
- HPI YoY
- ▼ -26.76%
- Current HPI
- 239.2287
- Rent YoY
- ▼ -0.21%
- Metro
- Houston-The Woodlands-Sugar Land, TX
- State GDP YoY
- ▲ 3.95%
- F500 in state
- 110
Industry mix (Fortune 500 HQ in TX)
| Industry | F500 HQs | Revenue |
|---|---|---|
| Energy | 16 | $1,198B |
|
||
| Technology | 5 | $198B |
|
||
| Engineering / Construction | 4 | $72B |
|
||
| Energy Services | 3 | $60B |
|
||
| Utilities | 3 | $41B |
|
||
| Healthcare | 2 | $330B |
|
||
Price history
-9.0% since first listed16 events — show timeline
- 2026-06-17 Price Changed $182,000 HARMLS
- 2026-05-19 Price Changed $185,000 HARMLS
- 2026-05-14 Listed for Rent $1,900 HARMLS
- 2026-05-13 Rental Removed $1,900 HARMLS
- 2026-05-13 Listing Removed — HARMLS
- 2026-05-13 Listed $195,000 HARMLS
- 2026-05-09 Price Changed $190,000 HARMLS
- 2026-04-14 Listed for Rent $1,900 HARMLS
- 2026-03-10 Listing Removed — HARMLS
- 2026-03-10 Listed $195,000 HARMLS
- 2025-11-20 Listed $195,000 HARMLS
- 2025-10-31 Listing Removed — HARMLS
- 2025-06-09 Listed $199,999 HARMLS
- 2018-11-14 Sold (Public Records) — Public Records
- 2018-11-14 Sold (Public Records) — Public Records
- 1988-01-02 Sold (Public Records) — Public Records
Property tax history
+8.5%/yrLatest (2025): $3,858 · +9.1% YoY. Source: county tax records.
Cash-flow waterfall
monthlySold comps — $/sqft
last 12 mo · ≤1 miLoading sold comps…