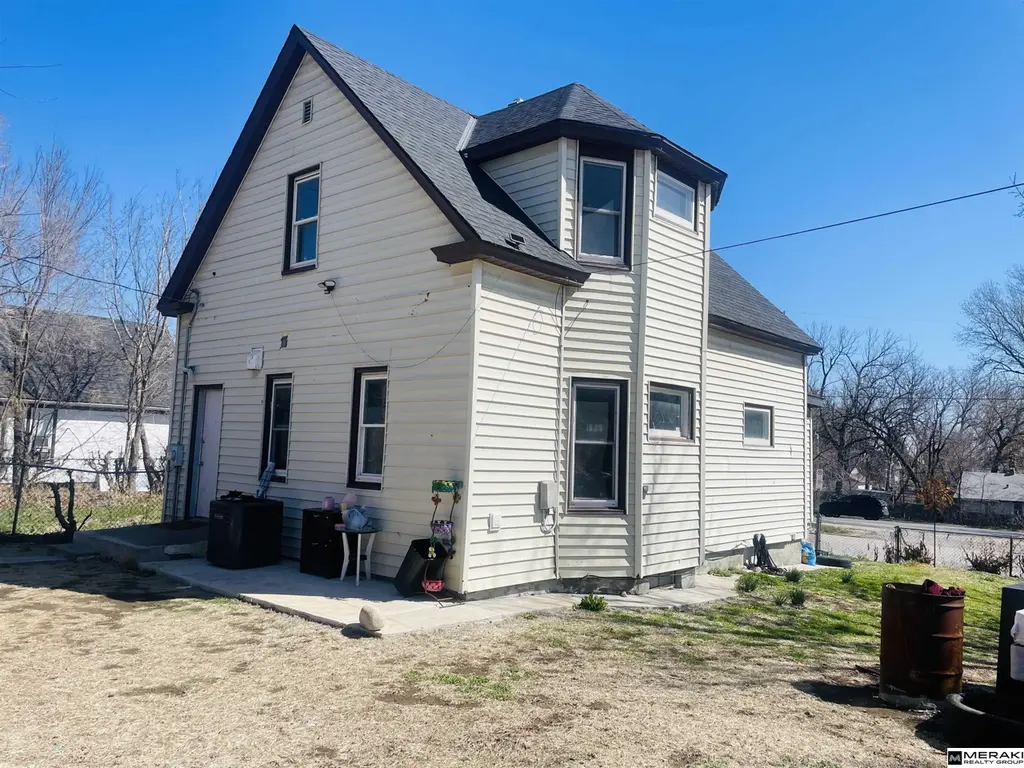
1804 N 33rd St · Omaha, NE
Flood risk 1/10 · Minimal
- FEMA flood zone
- X (unshaded)
- Chance of flooding over 30 yrs
- 0.0%
- Est. flood insurance / yr
- $473 – $860
Fire risk 1/10 · Minimal
- Est. fire insurance / yr
- $1,161 – $2,155
Heat risk 3/10 · Minor
- Hot days now (above 105°F)
- 7 days/yr
- Hot days in 30 yrs
- 15 days/yr
Wind risk 2/10 · Minimal
- Chance of severe wind over 30 yrs
- —
Air-quality risk 2/10 · Minimal
- Unhealthy air days now
- 0 days/yr
- Unhealthy air days in 30 yrs
- 1 days/yr
Risk factors via First Street. Map © Google.
Why this score? — see what drove the C grade
The composite is a weighted blend of 9 inputs, each scored 0–100. Each bar is that input's sub-score; the figure is the points it added to the 100-point composite (weight × sub-score).
- Cash flow +17.5/30.0
- Appreciation +10.0/10.0
- ARV discount +7.5/15.0
- DSCR +5.5/10.0
- 1% rule +4.6/10.0
- Livability +4.2/5.0
- Rent growth +3.3/5.0
- Condition / age +2.5/5.0
- Schools +2.1/10.0
$132,400
🖨 Deal sheet 📄 Offer letter ✓ Due diligence
Listing remarks
Fall in love with over 1,100 sq ft in this open floor plan 2 Story with 2 beds and 2 baths. You'll enjoy the open floor plan with spacious living and dining area with an abundance of natural light that lead into a great kitchen. Laundry room in conveniently located on the main floor along with 1/2 bath. The 2nd floor offers 2 large bedrooms and a 3/4 bath. The front sun porch is a great place to enjoy your morning coffee or unwind at the end of the day. Newer furnace, central air and roof! The Omaha gem has everything you've been waiting for. Perfect for investors! Property sold AS-IS Schedule your showings today.
Key facts
- Great kitchen
- Open floor plan
- Laundry room
Tags
Property features AI
Exterior
- Parking: No garage
- Utilities: Public water; Public sewer
- Home design: Single-family residence; Two-story home; Built in 1897; Living area approximately 1,176 square feet; Not new / not a model
- Construction: Block foundation
- Exterior features: Chain link and wood fencing (partial, with privacy sections); Above-ground pool; Lot up to 1/4 acre (approx. 0.09 acres; dimensions 47.5 x 85)
Interior
- Kitchen: Kitchen on main floor
- Bedrooms: Primary bedroom on 2nd floor; Additional bedroom(s) on 2nd floor
- Bathrooms: Two bathrooms total (one full, one half); One bathroom on main level; One bathroom on 2nd floor
- Heating & cooling: Natural gas, forced-air heating; Central air conditioning
- Interior features: Unfinished basement (706 below-grade area); No fireplaces
Neighborhood map
What this means for you Summary
Snapshot
- This is a 2-bed/1.5-bath other listed at $132k.
Deal economics
- At list price, monthly cash flow is $102 ($1k/yr) — positive.
- The deal already cash-flows at list — no discount required.
- To meet the 1% rule (rent ≥ 1% of price), the offer needs to be $127k (4.4% below list).
- Recommended offer: $127k (4.4% below list) — sets the bar for 1% rule.
- Cap rate 7.2% vs local median 3.6% in Omaha — top-decile yield for the area; either an underpriced asset or a hidden risk that comps aren't pricing in. Stress-test before assuming the spread holds.
Location & tenants
- Location reads 84/100 on livability (#7 in NE, #663 nationally) — a professional / high-income tenant draw. Strengths: amenities A+, commute A+, cost of living A+; Watch: crime F.
- Omaha Public Schools (urban): math 20% / reading 28% proficiency, ranked #110 of 111 in NE (top 99%) — low school quality limits family demand, transient renter base, plan for 1-2y turnover; 62% free/reduced lunch — lower-income household profile, screen leases tightly.
- Zoned schools: Franklin Elementary School (math 12% / reading 22%, grade F, #471 of 502 statewide, top 95%, 275 students, 0% FRL); Lewis & Clark Middle School (math 23% / reading 35%, grade F, #115 of 128 statewide, top 90%, 860 students, 0% FRL); Central High School (math 29% / reading 40%, grade F, #208 of 261 statewide, top 86%, 2,738 students, 0% FRL) — zoned schools average 0% FRL vs 62% district-wide (62 pts lower); this property's tenant base skews higher-income than the district average.
- Market conditions: Rents rising (+3.2%/yr); 139 active listings in the ZIP; 40 comparable units currently listed for rent nearby; rentals at typical pace (median 20d on market — plan ~3-4 weeks tenant-placement turnaround); lower-income renter base — watch delinquency; 4,539 units permitted in Douglas County in 2024 (2,583 in 5+ unit buildings).
Forward outlook
- In year one you build about $14k of equity ($915 loan paydown + $13k appreciation (10.0% local appreciation)).
- Douglas County population projected at +28% by 2050 — long-run rental-demand tailwind backs the buy-and-hold thesis.
- At projected returns (10.0% appreciation + 3.2% rent growth), your $37k cash investment doubles in ~3 years — after that, you're playing with house money.
- By year 3, paydown + projected appreciation supports a ~$36k cash-out refi (75% LTV) — recoverable capital for the next deal without selling this one.
Negotiation context
- Only 8 days on market — expect competitive offers; lowballing is unlikely to land.
- 13 sale attempts since 19y ago with the ask held roughly flat each time — persistent listings suggest the price (not the market) is what's stuck; bring a comps-based counter.
- Current owner paid $82k; list at $132k implies a 61% gain — meaningful room to come down on a strong offer.
Risks & watch-outs
- Watch-outs: built in 1897 — expect roof / HVAC / electrical / plumbing capex.
Questions for the listing agent
- Built in 1897 — when were the roof, HVAC, electrical panel, plumbing, and water heater last replaced?
- Is there a deadline driving the sale (1031 exchange, divorce, estate, relocation)? That informs how much negotiation room exists.
- Crime grade is F in this area — have there been break-ins, vandalism, or insurance claims at this property in the last 3 years? What carrier currently insures it and at what premium?
- What's the average days-on-market for RENTAL listings here right now (not sales)? A rising rental-DOM trend means longer vacancies and softer asking-rent achievability than the comps imply.
- What's the recent tenant-quality profile in this submarket — average credit score on applications, eviction rate, late-payment / NSF rate, and stable-employment percentage? A property-management company in the area should have these aggregated.
- How much new for-sale + rental construction is in the pipeline within 1–3 miles? Heavy new supply typically softens prices + rents 12–24 months out; constrained supply supports both.
Investment metrics
- 1% rule
- 0.96% ✗
- Cap rate
- 7.21%
- Cash-on-cash
- 3.29%
- DSCR
- 1.15
- GRM
- 8.7
CMA / ARV
No comps found within radius.
Projected returns pro-forma
10.0% appreciation · 3.22% rent growth · sell at horizon
- IRR
- 26.7%
- Equity multiple
- 3.13×
- Total profit
- $78,867
- Equity at exit
- $119,276
- IRR
- 23.5%
- Equity multiple
- 7.14×
- Total profit
- $227,756
- Equity at exit
- $257,224
Cash invested: $37,072 (down + closing). Projections, not guarantees.
Landlord ↔ Tenant lean methodology
- Overall (STATE)
- 83 Strongly Landlord-Friendly
- State Nebraska
- 83 Strongly Landlord-Friendly · R+13
- County
- — inherits STATE
- City
- — inherits STATE
ZIP-level market 68111
- Home prices YoY
- 4.0%
- Rents YoY
- 3.2%
- Active inventory
- 139
- Price-to-rent
- 8.7×
Monthly cashflow live
- Estimated rent
- $1,266 high interval (Pro) →
- Mortgage (P&I)
- −$694
- Tax from tax record
- −$149 /mo · $1,787/yr
- Insurance
- −$55
- HOA
- −$0
- Vacancy / Maint / Mgmt
- −$266
- Net cashflow
- $102
Break-even live
UW: 25.0% down · 7.5% · 30yr · 1.5% tax · 5.0% vac · 8.0% maint · 8.0% mgmt
Financing live
Cash to close
- Down payment
- $33,100
- Closing costs
- $3,972
- Reserves months
- —
- Total cash needed
- —
Loan-product check · same deal, 3 products live
Conventional
25% down · 7.5% · 30yr
- Down + closing
- —
- Monthly P&I
- —
- Monthly cashflow
- —
- DSCR
- —
- Eligible?
- —
Personal DTI + credit; lowest rate.
DSCR
20% down · 8.5% · 30yr
- Down + closing
- —
- Monthly P&I
- —
- Monthly cashflow
- —
- DSCR
- —
- Eligible?
- —
No personal income docs; deal must DSCR.
Hard money
10% down · 12.0% · 12mo
- Down + closing
- —
- Monthly P&I
- —
- Monthly cashflow
- —
- DSCR
- —
- Eligible?
- —
Short-term bridge; refi at stabilization.
Rent comps 40 comps
| Address | Beds | Baths | Sqft | Rent | $/sqft | DOM | Units | Dist |
|---|---|---|---|---|---|---|---|---|
| 3430 Seward St Omaha, NE | 3.0 | 1.0 | 1371 | $1,695 | $1.24 | 14d | 1 | 0.18mi |
| 1407 N 31st St Omaha, NE | 2.0 | 1.0 | 1040 | $1,395 | $1.34 | 3d | 1 | 0.33mi |
| 3502 Lake St Omaha, NE | 2.0 | 1.0 | 974 | $995 | $1.02 | 3d | 1 | 0.44mi |
| 1004 Glenwood Ave Unit 2 Omaha, NE | 3.0 | 1.5 | 1000 | $1,500 | $1.50 | 3d | 1 | 0.54mi |
| 1111 N 27th St Omaha, NE | 1.0–2.0 | 1.0 | 941 | $1,200 | $1.28 | 44d | 11 | 0.70mi |
| 2625 Nicholas Ct Unit 2625NA Omaha, NE | 2.0 | 1.0 | 1042 | $1,250 | $1.20 | 24d | 1 | 0.72mi |
| 4102 Hamilton St Unit 014 Omaha, NE | 2.0 | 1.0 | 811 | $1,120 | $1.38 | 24d | 1 | 0.73mi |
| 4102 Hamilton St Omaha, NE | 2.0 | 1.0 | 811 | $1,120 | $1.38 | 3d | 1 | 0.73mi |
| 2619 Nicholas Ct Unit 2619ND Omaha, NE | 2.0 | 1.0 | 1042 | $1,250 | $1.20 | 19d | 1 | 0.74mi |
| 2613 Nicholas Ct Unit 2613NC Omaha, NE | 2.0 | 1.0 | 1042 | $1,250 | $1.20 | 3d | 1 | 0.74mi |
| 2613 Nicholas Ct Unit 2613NA Omaha, NE | 1.0 | 1.0 | 840 | $925 | $1.10 | 3d | 1 | 0.74mi |
| 2623 Izard Ct Unit 2623IZE Omaha, NE | 2.0 | 1.0 | 1042 | $1,100 | $1.06 | 44d | 1 | 0.77mi |
| 2575 Nicholas Ct Unit 2575NB Omaha, NE | 1.0 | 1.0 | 840 | $925 | $1.10 | 19d | 1 | 0.77mi |
| 2569 Nicholas Ct Unit 2569NC Omaha, NE | 2.0 | 1.0 | 1042 | $1,100 | $1.06 | 19d | 1 | 0.77mi |
| 2575 Irving Ct Unit 2575IRF Omaha, NE | 2.0 | 1.0 | 1042 | $1,100 | $1.06 | 19d | 1 | 0.78mi |
| 2575 Irving Ct Unit 2575IRB Omaha, NE | 2.0 | 1.0 | 1042 | $1,250 | $1.20 | 19d | 1 | 0.78mi |
| 2563 Nicholas Ct Unit 2563NE Omaha, NE | 2.0 | 1.0 | 1042 | $1,100 | $1.06 | 3d | 1 | 0.78mi |
| 2563 Nicholas Ct Unit 2563NF Omaha, NE | 2.0 | 1.0 | 1042 | $1,100 | $1.06 | 44d | 1 | 0.78mi |
| 2563 Nicholas Ct Unit 2563NC Omaha, NE | 2.0 | 1.0 | 1042 | $1,100 | $1.06 | 24d | 1 | 0.78mi |
| 3518 California St Unit 3518/01 Omaha, NE | 1.0 | 1.0 | 780 | $795 | $1.02 | 24d | 1 | 0.78mi |
| 2605 Izard Ct Unit 2605IZA Omaha, NE | 2.0 | 1.0 | 1042 | $1,250 | $1.20 | 44d | 1 | 0.79mi |
| 2579 Izard Ct Unit 2579IZD Omaha, NE | 2.0 | 1.0 | 1042 | $1,100 | $1.06 | 44d | 1 | 0.80mi |
| 2563 Irving Ct Unit 2563IRF Omaha, NE | 2.0 | 1.0 | 1042 | $1,100 | $1.06 | 44d | 1 | 0.80mi |
| 2567 Izard Ct Unit 2567IZE Omaha, NE | 2.0 | 1.0 | 1042 | $1,100 | $1.06 | 44d | 1 | 0.81mi |
| 2561 Izard Ct Unit 2561IZD Omaha, NE | 2.0 | 1.0 | 1042 | $1,250 | $1.20 | 24d | 1 | 0.82mi |
| 2561 Izard Ct Unit 2561IZC Omaha, NE | 2.0 | 1.0 | 1042 | $1,100 | $1.06 | 24d | 1 | 0.82mi |
| 2561 Izard Ct Unit 2561IZA Omaha, NE | 1.0 | 1.0 | 840 | $975 | $1.16 | 24d | 1 | 0.82mi |
| 2555 Izard Ct Unit 2555IZB Omaha, NE | 2.0 | 1.0 | 1042 | $1,100 | $1.06 | 3d | 1 | 0.82mi |
| 2555 Izard Ct Unit 2555IZA Omaha, NE | 1.0 | 1.0 | 840 | $925 | $1.10 | 44d | 1 | 0.82mi |
| 2929 California St Omaha, NE | 1.0–4.0 | 1.0–3.0 | 1280 | $1,890 | $1.48 | 3d | 118 | 0.83mi |
| 828 N 41st Ave Omaha, NE | 2.0 | 1.0 | 1264 | $1,700 | $1.34 | 14d | 1 | 0.92mi |
| 3212 N 39th St Omaha, NE | 1.0 | 1.0 | 1025 | $785 | $0.77 | 24d | 1 | 0.92mi |
| 4201 Cuming St Omaha, NE | 2.0 | 1.0 | 1272 | $1,350 | $1.06 | 3d | 1 | 0.94mi |
| 3674 Bedford Ave Omaha, NE | 3.0 | 1.0 | 864 | $1,275 | $1.48 | 24d | 1 | 0.95mi |
| 3910 Cass St Unit 306 Omaha, NE | 1.0 | 1.0 | 700 | $895 | $1.28 | 3d | 1 | 0.97mi |
| 3918 Cass St Apt 205 Omaha, NE | 1.0 | 1.0 | 700 | $995 | $1.42 | 44d | 1 | 0.98mi |
| 3918 Cass St Unit 212 Omaha, NE | 1.0 | 1.0 | 700 | $895 | $1.28 | 3d | 1 | 0.98mi |
| 428 N 40th St Omaha, NE | 1.0 | 1.0 | 675 | $1,010 | $1.50 | 24d | 2 | 1.03mi |
| 210 N 32nd Ave Unit 4 Omaha, NE | 2.0 | 1.0 | 800 | $900 | $1.12 | 10d | 1 | 1.04mi |
| 3323 N 40th St Omaha, NE | 2.0 | 1.0 | 1000 | $1,575 | $1.57 | 3d | 1 | 1.06mi |
Listing history 43 events
-
2026-06-18days on market $132,400 Active 8 DOM
-
2026-06-17days on market $132,400 Active 7 DOM
-
2026-06-16days on market $132,400 Active 6 DOM
-
2026-06-15statusdays on market $132,400 Active 5 DOM
-
2026-06-13statusdays on market $132,400 New 3 DOM
-
2026-06-10days on market $132,400 Active 55 DOM
-
2026-06-09days on market $132,400 Active 54 DOM
-
2026-06-08days on market $132,400 Active 53 DOM
-
2026-06-07days on market $132,400 Active 52 DOM
-
2026-06-03days on market $132,400 Active 48 DOM
-
2026-06-03days on market $132,400 Active 47 DOM
-
2026-06-01days on market $132,400 Active 46 DOM
-
2026-06-01days on market $132,400 Active 45 DOM
-
2026-04-16$132,400 New 622-char remark
-
2026-04-16historical
-
2026-04-06$139,900 New
-
2025-04-10historical
-
2025-03-12price $124,999
-
2025-02-18price $129,999
-
2025-02-05$139,999 New
-
2024-06-12soldstatus $82,000
-
2024-06-11soldstatus $82,000 Sold
-
2024-05-22status Pending
-
2024-05-14$74,900 New
-
2016-02-09soldstatus $12,000
-
2011-09-28historical
-
2011-06-27$29,990
-
2011-01-01soldstatus $8,900
-
2010-06-30historical
-
2010-06-22historical
-
2010-06-21$3,900
-
2010-02-11$24,900
-
2010-02-04historical
-
2009-06-23$24,900
-
2009-06-16historical
-
2009-04-03$25,900
-
2009-04-01historical
-
2008-12-11$27,500
-
2008-12-11historical
-
2008-09-05$32,500
-
2007-12-03historical
-
2007-11-09$27,500
-
2000-10-16soldstatus $37,000
ⓘ Source: listings_history table (triggers on properties + properties_extension) + one-shot
backfill from property_details.listing_events for pre-trigger history.
Tax reassessment forecast NE · Resets to sale price
- Current annual tax
- $1,787 · $149/mo
- Projected year-2 tax
- $2,291 · $191/mo
- Expected delta
- +$503/yr (+$42/mo · 28.1%)
ⓘ Screening estimate from a state-policy table — verify with the county assessor before closing.
Climate risk First Street
- Flood 1/10 Low FEMA zone X (unshaded) · 0% chance over 30 yrs
- Wildfire 1/10 Low
- Heat 3/10 Moderate 7 d/yr ≥105°F today · 15 d/yr by 30 yrs out
- Wind 2/10 Low
- Air quality 2/10 Low 0 unhealthy d/yr today · 1 by 30 yrs out
Nearby sold comps map
Loading sold comps map…
Walkable amenities ~0.75 mi
Loading nearby amenities…
Taxation est. · year 1
- Rental income
- $15,190
- − Mortgage interest
- −$7,416
- − Property taxes
- −$1,787
- − Insurance
- −$662
- − Repairs & maintenance
- −$1,215
- − Management
- −$1,215
- − Depreciation
- −$3,852
- Taxable loss
- −$958
- Est. tax savings @ 24.0%
- +$230
- After-tax cash flow
- $1,449/yr
For passive investors: Depreciation is non-cash, so a rental often shows a tax loss while cash-flowing — sheltering income. Rental losses are passive: they offset passive income freely, and up to $25,000/yr can offset ordinary (W-2) income if you actively participate and your MAGI is under $100k (phasing out to $0 by $150k); unused losses carry forward. On sale, claimed depreciation is recaptured at up to 25%, and gains may owe capital-gains tax (a 1031 exchange can defer both). Figures are a year-1 estimate at your 24.0% rate — not tax advice; consult a CPA.
Schools (NCES district)
- District
- Omaha Public Schools
- NCES district ID
- 3174820
- Math proficiency
- 20% ▼ -10.00%
- Reading proficiency
- 28% ▼ -5.00%
- Median HH income
- $46,039
- Composite
- 20.83/100
- National rank
- #8502
- State rank
- #110 of 111 in NE
Livability — Omaha
- Score
- 84/100
- State rank
- #7
- US rank
- #663
Category grades
Schools grade is shown separately in the Schools card above.
Census & demographics
- Census place
- Omaha, NE
- County
- Douglas County · 538,646 people
- City population
- 552,986
- Metro
- Omaha-Council Bluffs, NE-IA
- Population (ZIP)
- 24,210
- Household income
- $42,185
- Rent vs Own
- Severe rent burden
- 1913.0
Population outlook (Douglas County) Hauer SSP2
- Today (2025)
- 625,245 people
- By 2030
- 661,613 · +5.8%
- By 2040
- 732,395 · +17.1%
- By 2050
- 801,988 · +28.3%
- By 2075
- 968,637 · +54.9%
- By 2100
- 1,101,871 · +76.2%
Race, ethnicity, and origin ACS 2023
- Neighborhood character
- Diverse neighborhood (Simpson 0.65)
- Race & ethnicity
- Black 52% Hispanic / Latino 21% White 17% Two or more races 15% Asian 3% Native American 1%
- Hispanic origin (detail)
- Mexican 14%
- Common ancestry
- Ukrainian 3% Lithuanian 0%
- Foreign-born
- 14% · Canada, Philippines
- Languages at home
- 75% English-only · Spanish 16% Other Asian/Pacific 3% French/Haitian/Cajun 1%
Political lean MEDSL · Douglas
- 2024 margin
- D (+10.2) · D 54.4% · R 44.2% · Other 1.4%
- 2008→2024 swing
- +5.5pp toward D · 2008: 4.6pp · 2024: 10.2pp
- All cycles
- 2024: D+10.2 2020: D+11.3 2016: D+1.4 2012: R+4.3 2008: D+4.6
Not yet ingested
- Civics
- —
Market trends
- HPI YoY
- ▲ 13.82%
- Current HPI
- 358.7174
- Rent YoY
- ▲ 3.22%
- Metro
- Omaha-Council Bluffs, NE-IA
- State GDP YoY
- ▲ 0.68%
- F500 in state
- 2
Industry mix (Fortune 500 HQ in NE)
| Industry | F500 HQs | Revenue |
|---|---|---|
| Conglomerate | 1 | $371B |
|
||
Price history
+257.8% since first listed32 events — show timeline
- 2026-06-10 Listing Removed — GPRMLS
- 2026-06-10 Listed $132,400 GPRMLS
- 2026-04-16 Listing Removed — GPRMLS
- 2026-04-16 Listed $132,400 GPRMLS
- 2026-04-06 Listed $139,900 GPRMLS
- 2025-04-10 Listing Removed — GPRMLS
- 2025-03-12 Price Changed $124,999 GPRMLS
- 2025-02-18 Price Changed $129,999 GPRMLS
- 2025-02-05 Listed $139,999 GPRMLS
- 2024-06-12 Sold (Public Records) $82,000 Public Records
- 2024-06-11 Sold (MLS) $82,000 GPRMLS
- 2024-05-22 Pending — GPRMLS
- 2024-05-14 Listed $74,900 GPRMLS
- 2016-02-09 Sold (Public Records) $12,000 Public Records
- 2011-09-28 Listing Removed — GPRMLS
- 2011-06-27 Listed $29,990 GPRMLS
- 2011-01-01 Sold (MLS) $8,900 GPRMLS
- 2010-06-30 Listing Removed — GPRMLS
- 2010-06-22 Listing Removed — GPRMLS
- 2010-06-21 Listed $3,900 GPRMLS
- 2010-02-11 Listed $24,900 GPRMLS
- 2010-02-04 Listing Removed — GPRMLS
- 2009-06-23 Listed $24,900 GPRMLS
- 2009-06-16 Listing Removed — GPRMLS
- 2009-04-03 Listed $25,900 GPRMLS
- 2009-04-01 Listing Removed — GPRMLS
- 2008-12-11 Listing Removed — GPRMLS
- 2008-12-11 Listed $27,500 GPRMLS
- 2008-09-05 Listed $32,500 GPRMLS
- 2007-12-03 Listing Removed — GPRMLS
- 2007-11-09 Listed $27,500 GPRMLS
- 2000-10-16 Sold (Public Records) $37,000 Public Records
Property tax history
+9.9%/yrLatest (2025): $1,787 · +1.1% YoY. Source: county tax records.
Cash-flow waterfall
monthlySold comps — $/sqft
last 12 mo · ≤1 miLoading sold comps…