 🏷️ Likely Rental
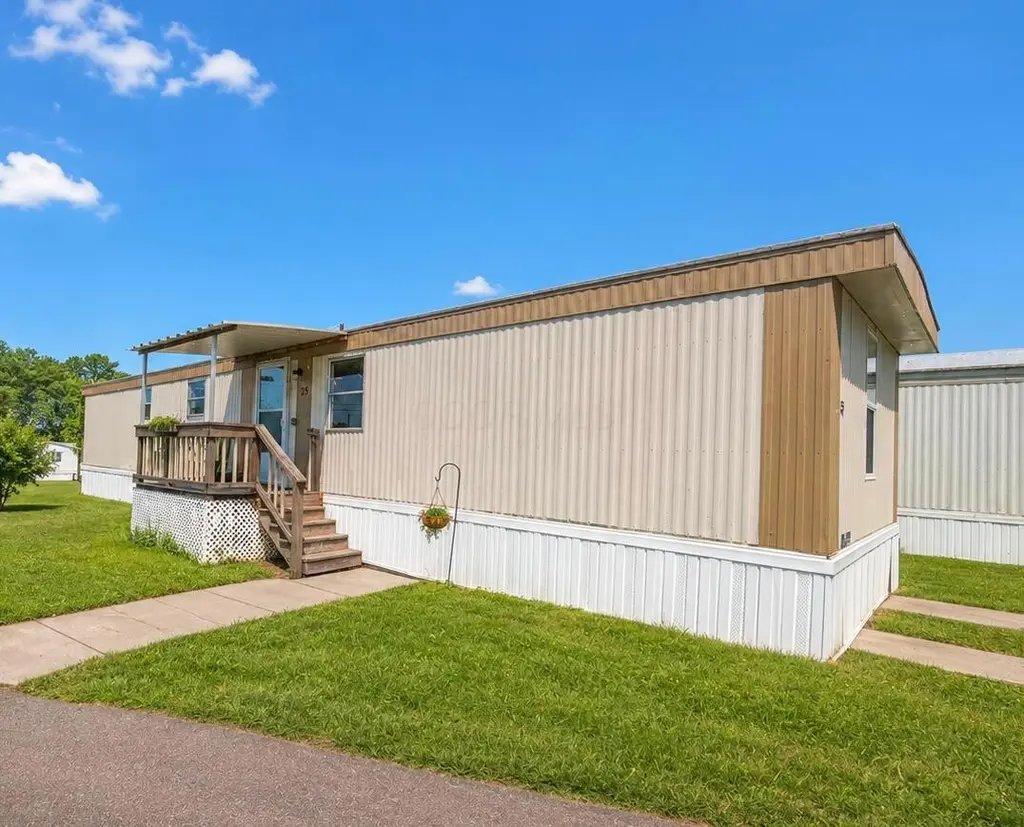
25 Horseshoe Dr · Newark, OH
Flood risk 1/10 · Minimal
- FEMA flood zone
- X (unshaded)
- Chance of flooding over 30 yrs
- 0.0%
- Est. flood insurance / yr
- $507 – $1,088
Fire risk 1/10 · Minimal
- Est. fire insurance / yr
- $713 – $1,323
Heat risk 3/10 · Minor
- Hot days now (above 99°F)
- 7 days/yr
- Hot days in 30 yrs
- 18 days/yr
Wind risk 2/10 · Minimal
- Chance of severe wind over 30 yrs
- 1.0%
Air-quality risk 2/10 · Minimal
- Unhealthy air days now
- 1 days/yr
- Unhealthy air days in 30 yrs
- 2 days/yr
Risk factors via First Street. Map © Google.
Why this score? — see what drove the B- grade
The composite is a weighted blend of 9 inputs, each scored 0–100. Each bar is that input's sub-score; the figure is the points it added to the 100-point composite (weight × sub-score).
- Cash flow +25.1/30.0
- 1% rule +10.0/10.0
- DSCR +8.2/10.0
- ARV discount +7.5/15.0
- Schools +4.3/10.0
- Condition / age +4.0/5.0
- Livability +3.5/5.0
- Rent growth +2.9/5.0
- Appreciation +0.0/10.0
$59,000
🖨 Deal sheet (PDF) 📄 Offer letter ✓ Due diligence
Listing remarks
Affordable, updated, and move-in ready! This charming and well-maintained 2-bedroom, 1-bath manufactured home has been thoughtfully updated and meticulously cared for by its current owner. Inside, you'll find a bright and inviting living space, central HVAC for year-round comfort, and the convenience of an included washer and dryer. Outside, the property offers three dedicated parking spaces and low-maintenance living in a quiet community. Located within walking distance of Heritage Middle School and just minutes from shopping, restaurants, parks, healthcare, and all the everyday conveniences Newark has to offer, the location is hard to beat. With lot rent of just $350 per month, this is an
Key facts
- Central hvac
- Minutes from parks
- 8,712 sq ft lot
Tags
Property features AI
Finance
- HOA & community: Homeowners association with a $350 monthly fee; Subdivision: Towns MHP; Township: Newark
Exterior
- Parking: Assigned parking
- Utilities: Public water; Public sewer
- Home design: One-story residence; Other residential without deeded land; No common walls; Built in 1986
- Construction: Other foundation
- Exterior features: Patio
Interior
- Bedrooms: Two main-level bedrooms
- Flooring: Laminate flooring; Carpet; Vinyl flooring
- Bathrooms: One full bathroom
- Heating & cooling: Central air conditioning
- Interior features: Insulated windows throughout; Living area approximately 784
Neighborhood map
What this means for you Summary
Snapshot
- This is a 2-bed/1.0-bath single-family listed at $59k. Condition is rated good.
Deal economics
- At list price, monthly cash flow is $131 ($2k/yr) — positive.
- The deal already cash-flows at list — no discount required.
- Meets the 1% rule at list price ($1k rent vs $59k).
- Cap rate 9.0% vs local median 3.2% in Newark — top-decile yield for the area; either an underpriced asset or a hidden risk that comps aren't pricing in. Stress-test before assuming the spread holds.
Location & tenants
- Location reads 69/100 on livability (#493 in OH) — a middle-class / working-renter tenant base. Strengths: cost of living A+, housing A+, schools B; Watch: employment D+, amenities F, commute F.
- Newark City (suburban): math 48% / reading 56% proficiency, ranked #431 of 656 in OH (top 66%) — acceptable for families but not a draw, mixed tenant base, ~2y average lease.
- Market conditions: Rents rising (+1.6%/yr); 204 active listings in the ZIP; 4 comparable units currently listed for rent nearby; rentals leasing fast (median 3d on market — plan ~1-2 weeks tenant-placement turnaround); 159 units permitted in Licking County in 2024 (0 in 5+ unit buildings).
Forward outlook
- Local home prices are declining (-3.0%/yr); year-one equity from $408 of loan paydown is wiped out by about $2k of value loss. Plan a longer hold.
Negotiation context
- Only 1 days on market — expect competitive offers; lowballing is unlikely to land.
Risks & watch-outs
- Watch-outs: HOA is 31% of rent.
Questions for the listing agent
- What does the HOA fee cover, when was the last increase, and are there any pending special assessments or reserve-fund shortfalls?
- Is there a deadline driving the sale (1031 exchange, divorce, estate, relocation)? That informs how much negotiation room exists.
- Schools are B-rated — typically a magnet for longer-tenancy family renters. What's the average tenant stay here, and is there a school-zone premium baked into asking?
- What's the average days-on-market for RENTAL listings here right now (not sales)? A rising rental-DOM trend means longer vacancies and softer asking-rent achievability than the comps imply.
- What's the recent tenant-quality profile in this submarket — average credit score on applications, eviction rate, late-payment / NSF rate, and stable-employment percentage? A property-management company in the area should have these aggregated.
- How much new for-sale + rental construction is in the pipeline within 1–3 miles? Heavy new supply typically softens prices + rents 12–24 months out; constrained supply supports both.
Investment metrics
- 1% rule
- 1.91% ✓
- Cap rate
- 8.95%
- Cash-on-cash
- 9.51%
- DSCR
- 1.42
- GRM
- 4.4
CMA / ARV
- ARV (on-the-fly)
- $166,208
- Comps found
- 12
Show comp detail 12 sales within ~0.75 mi
| Address | Dist | Beds/Ba | Sqft | Sold | Price | $/sf | Match |
|---|---|---|---|---|---|---|---|
| 481 Oakwood Ave | 0.35mi | 2/1.0 | 768 (-2%) | 1mo | $90,000 | $117 | 79 |
| 493 Allston Ave | 0.23mi | 2/1.5 | 826 (+5%) | 4mo | $175,000 | $212 | 75 |
| 9 Elcar | 0.12mi | 2/2.0 | 828 (+6%) | 15mo | $75,800 | $92 | 68 |
| 855 Jones Ave | 0.50mi | 2/1.0 | 780 (-0%) | 13mo | $175,000 | $224 | 65 |
| 98 Fairmont Ave | 0.46mi | 3/1.0 (+1) | 810 (+3%) | 8mo | $155,000 | $191 | 61 |
| 506 Lexington Ave | 0.27mi | 2/1.0 | 672 (-14%) | 7mo | $165,000 | $246 | 58 |
| 460 Allston Ave | 0.30mi | 3/1.0 (+1) | 864 (+10%) | 8mo | $185,000 | $214 | 58 |
| 483 Allston Ave | 0.23mi | 3/1.0 (+1) | 888 (+13%) | 6mo | $208,000 | $234 | 57 |
| 9324 NE Butler Rd | 0.47mi | 2/1.0 | 884 (+13%) | 6mo | $225,000 | $255 | 52 |
| 368 N Cedar St | 0.43mi | 3/1.0 (+1) | 868 (+11%) | 10mo | $180,000 | $207 | 49 |
| 32 Magnolia Ave | 0.75mi | 2/1.0 | 843 (+8%) | 15mo | $147,000 | $174 | 40 |
| 500 Manning St | 0.69mi | 2/1.0 | 891 (+14%) | 13mo | $175,000 | $196 | 34 |
Match score weights: distance 35% · size 25% · config 20% · recency 20%. Top-matched comps best support the ARV.
Projected returns pro-forma
-3.0% appreciation · 1.63% rent growth · sell at horizon
- IRR
- -4.2%
- Equity multiple
- 0.85×
- Total profit
- $-2,524
- Equity at exit
- $8,797
- IRR
- 3.1%
- Equity multiple
- 1.20×
- Total profit
- $3,371
- Equity at exit
- $5,101
Cash invested: $16,520 (down + closing). Projections, not guarantees.
Landlord ↔ Tenant lean methodology
- Overall (STATE)
- 73 Landlord-Friendly
- State Ohio
- 73 Landlord-Friendly · R+6
- County
- — inherits STATE
- City
- — inherits STATE
ZIP-level market 43055
- Rents YoY
- 1.6%
- Active inventory
- 204
- Price-to-rent
- 4.4×
Monthly cashflow live
- Estimated rent
- $1,125 medium interval (Pro) →
- Mortgage (P&I)
- −$309
- Tax est. 1.5%
- −$74 /mo · $885/yr
- Insurance
- −$25
- HOA
- −$350
- Vacancy / Maint / Mgmt
- −$236
- Net cashflow
- $131
Break-even live
Sensitivity live
| Price | -10% $172 | -5% $151 | +0% $131 | +5% $110 | +10% $90 |
|---|---|---|---|---|---|
| Rent | -10% $42 | -5% $86 | +0% $131 | +5% $175 | +10% $220 |
| Rate | -1.0pp $161 | -0.5pp $146 | base $131 | +0.5pp $116 | +1.0pp $100 |
UW: 25.0% down · 7.5% · 30yr · 1.5% tax · 5.0% vac · 8.0% maint · 8.0% mgmt
Financing live
Cash to close
- Down payment
- $14,750
- Closing costs
- $1,770
- Reserves months
- —
- Total cash needed
- —
Loan-product check · same deal, 3 products live
Conventional
25% down · 7.5% · 30yr
- Down + closing
- —
- Monthly P&I
- —
- Monthly cashflow
- —
- DSCR
- —
- Eligible?
- —
Personal DTI + credit; lowest rate.
DSCR
20% down · 8.5% · 30yr
- Down + closing
- —
- Monthly P&I
- —
- Monthly cashflow
- —
- DSCR
- —
- Eligible?
- —
No personal income docs; deal must DSCR.
Hard money
10% down · 12.0% · 12mo
- Down + closing
- —
- Monthly P&I
- —
- Monthly cashflow
- —
- DSCR
- —
- Eligible?
- —
Short-term bridge; refi at stabilization.
Rent comps 4 comps
| Address | Beds | Baths | Sqft | Rent | $/sqft | DOM | Units | Dist |
|---|---|---|---|---|---|---|---|---|
| 494 Allston Ave Newark, OH | 2.0 | 1.0 | 724 | $1,150 | $1.59 | 44d | 1 | 0.24mi |
| 420 Indiana St Newark, OH | 1.0 | 1.0 | 750 | $800 | $1.07 | 2d | 1 | 0.54mi |
| 270 Everett Ave Newark, OH | 3.0 | 1.0 | 864 | $1,425 | $1.65 | 2d | 1 | 0.84mi |
| 51 Mill St Newark, OH | 2.0 | 1.0 | 1024 | $1,200 | $1.17 | 2d | 1 | 0.89mi |
HOA detail
- Monthly dues
- $350 · $4,200/yr
Listing history 2 events
-
2026-06-18remarks 699-char remark
-
2026-06-18$59,000 Coming Soon 1 DOM
ⓘ Source: listings_history table (triggers on properties + properties_extension) + one-shot
backfill from property_details.listing_events for pre-trigger history.
Climate risk First Street
- Flood 1/10 Low FEMA zone X (unshaded) · 0% chance over 30 yrs
- Wildfire 1/10 Low
- Heat 3/10 Moderate 7 d/yr ≥99°F today · 18 d/yr by 30 yrs out
- Wind 2/10 Low 100% chance of damaging wind over 30 yrs
- Air quality 2/10 Low 1 unhealthy d/yr today · 2 by 30 yrs out
Nearby sold comps map
Loading sold comps map…
Walkable amenities ~0.75 mi
Loading nearby amenities…
Taxation est. · year 1
- Rental income
- $13,498
- − Mortgage interest
- −$3,305
- − Property taxes
- −$885
- − Insurance
- −$295
- − Repairs & maintenance
- −$1,080
- − Management
- −$1,080
- − HOA
- −$4,200
- − Depreciation
- −$1,716
- Taxable income
- $937
- Est. tax owed @ 24.0%
- −$225
- After-tax cash flow
- $1,345/yr
For passive investors: Depreciation is non-cash, so a rental often shows a tax loss while cash-flowing — sheltering income. Rental losses are passive: they offset passive income freely, and up to $25,000/yr can offset ordinary (W-2) income if you actively participate and your MAGI is under $100k (phasing out to $0 by $150k); unused losses carry forward. On sale, claimed depreciation is recaptured at up to 25%, and gains may owe capital-gains tax (a 1031 exchange can defer both). Figures are a year-1 estimate at your 24.0% rate — not tax advice; consult a CPA.
Condition & rehab AI · 12 photos
This well-maintained and updated 2-bedroom, 1-bath manufactured home is move-in ready and offers a great location with low maintenance and ample parking.
Value-add opportunities
- Both Painting the exterior siding — Enhances curb appeal and can increase both resale and rental value
- Both Upgrading the flooring to hardwood or tile — Improves the overall aesthetic and can increase both resale and rental value
- Both Upgrading the appliances — Modernizes the kitchen and can increase both resale and rental value
Renovation cost estimate screening
Value-add ROI direction
- Both Painting the exterior siding — Enhances curb appeal and can increase both resale and rental value ↑
- Both Upgrading the flooring to hardwood or tile — Improves the overall aesthetic and can increase both resale and rental value ↑
- Both Upgrading the appliances — Modernizes the kitchen and can increase both resale and rental value ↑
ⓘ Cost ranges are severity-bucket heuristics (US national rule-of-thumb). Get contractor quotes + a written scope before underwriting a rehab budget.
Schools (NCES district)
- District
- Newark City
- NCES district ID
- 3904445
- Math proficiency
- 48% ▼ -12.00%
- Reading proficiency
- 56% ▼ -3.00%
- Median HH income
- $38,662
- Composite
- 43.33/100
- National rank
- #3034
- State rank
- #431 of 656 in OH
Livability — Newark
- Score
- 69/100
- State rank
- #493
- US rank
- #8263
Category grades
Schools grade is shown separately in the Schools card above.
Census & demographics
- Census place
- Newark, OH
- County
- Licking County · 109,194 people
- City population
- 63,281
- Metro
- Columbus, OH
- Population (ZIP)
- 63,281
- Household income
- $63,974
- Rent vs Own
- Severe rent burden
- 2269.0
Population outlook (Licking County) Hauer SSP2
- Today (2025)
- 178,210 people
- By 2030
- 180,917 · +1.5%
- By 2040
- 183,885 · +3.2%
- By 2050
- 182,985 · +2.7%
- By 2075
- 178,377 · +0.1%
- By 2100
- 161,075 · -9.6%
Race, ethnicity, and origin ACS 2023
- Neighborhood character
- Predominantly White (89%)
- Race & ethnicity
- White 89% Two or more races 5% Black 3% Hispanic / Latino 2%
- Common ancestry
- Slovak 2% Romanian 2% Lithuanian 2%
- Foreign-born
- 2% · Canada
- Languages at home
- 96% English-only · Spanish 2% Arabic 1%
Political lean MEDSL · Licking
- 2024 margin
- Solid R (+30.0) · D 34.5% · R 64.6%
- 2008→2024 swing
- -14.2pp toward R · 2008: -15.8pp · 2024: -30.0pp
- All cycles
- 2024: R+30.0 2020: R+28.1 2016: R+28.9 2012: R+14.7 2008: R+15.8
Not yet ingested
- Civics
- —
Market trends
- HPI YoY
- ▼ -253.54%
- Current HPI
- 247.9425
- Rent YoY
- ▲ 1.63%
- Metro
- Columbus, OH
- State GDP YoY
- ▲ 1.98%
- F500 in state
- 48
Industry mix (Fortune 500 HQ in OH)
| Industry | F500 HQs | Revenue |
|---|---|---|
| Insurance | 3 | $145B |
|
||
| Industrial Machinery | 3 | $49B |
|
||
| Financial Services | 3 | $24B |
|
||
| Consumer Goods | 2 | $93B |
|
||
| Aerospace / Defense | 2 | $47B |
|
||
| Utilities | 2 | $33B |
|
||
Price history
1 event — show timeline
- 2026-06-18 Coming Soon $59,000 CBRMLS
Cash-flow waterfall
monthlySold comps — $/sqft
last 12 mo · ≤1 miLoading sold comps…