 🏗️ New Construction
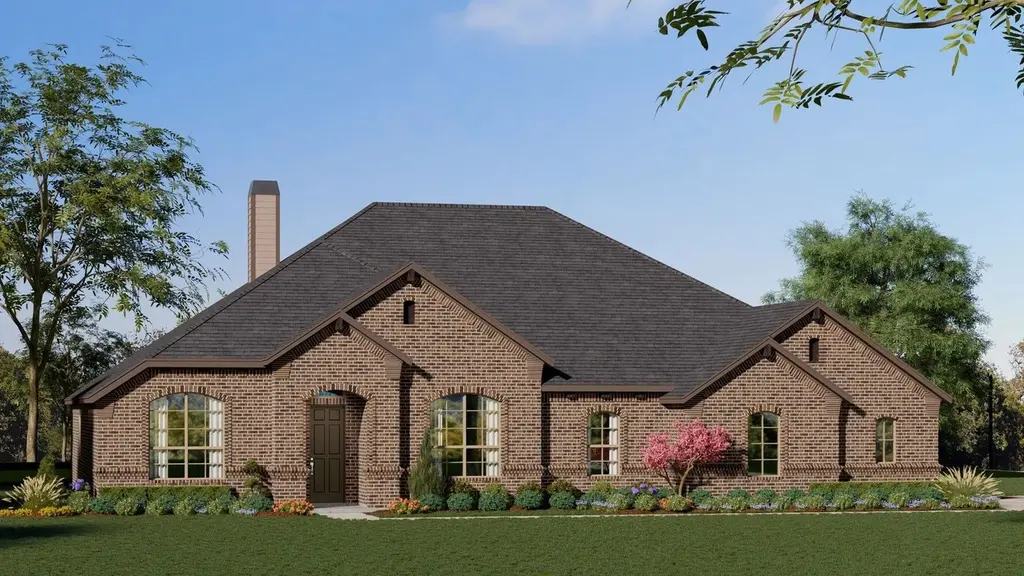
Concept 3141 Plan · Gunter, TX
Flood risk No data
- FEMA flood zone
- —
- Chance of flooding over 30 yrs
- —
- Est. flood insurance / yr
- —
Fire risk No data
- Est. fire insurance / yr
- —
Heat risk No data
- Hot days now (above threshold)
- —
- Hot days in 30 yrs
- —
Wind risk No data
- Chance of severe wind over 30 yrs
- —
Air-quality risk No data
- Unhealthy air days now
- —
- Unhealthy air days in 30 yrs
- —
Risk factors via First Street. Map © Google.
Why this score? — see what drove the C- grade
The composite is a weighted blend of 9 inputs, each scored 0–100. Each bar is that input's sub-score; the figure is the points it added to the 100-point composite (weight × sub-score).
- Cash flow +13.2/30.0
- Appreciation +10.0/10.0
- ARV discount +7.5/15.0
- Schools +4.8/10.0
- DSCR +4.0/10.0
- Condition / age +4.0/5.0
- 1% rule +3.7/10.0
- Livability +3.6/5.0
- Rent growth +2.5/5.0
$696,990
🖨 Deal sheet 📄 Offer letter ✓ Due diligence
Listing remarks MLS
If you're looking for a home that offers it all, you will admire the features and options of this home. Choose from six elevation styles, three including gorgeous stone details. Walk through the foyer to the study, separated by French doors, or continue to the open-concept common areas. This home is centered around a large family room with a wall of windows that draws in an abundance of natural light. With a fireplace, create a cozy and welcoming atmosphere to welcome friends and family. Whether you love to cook or simply cook for routine, you will enjoy this designer kitchen. It features gorgeous granite countertops, a sizeable walk-in pantry, ample cabinet space, a large island with room for seating, and stainless-steel appliances. Step out to the optional rear covered patio for the ultimate outdoor living experience. For more possibilities, the large flex room with a walk-in closet can be transformed into a space that fits your life. Ensuring privacy, the master bedroom is separated from the secondary bedrooms and boasts a huge walk-in closet. The master bath includes a dual sink vanity, a walk-in shower with a seat, and a garden tub. If you crave an extra touch of elegance, you can select the luxury bath option and enjoy an oversized walk-in shower, dual vanities, and a free-standing tub. Three additional bedrooms have easy access to two full baths and offer generous walk-in closets. The large utility room can include a cabinet and sink, if you choose and the two-car garage can
Key facts
- 3 garage spots
- Listed 862 days
Neighborhood map
What this means for you Summary
Snapshot
- This is a 4-bed/3.0-bath single-family listed at $697k. Condition is rated good.
Deal economics
- At list price, monthly cash flow is $-16 ($-187/yr) — negative.
- The deal already cash-flows at list — no discount required.
- To meet the 1% rule (rent ≥ 1% of price), the offer needs to be $680k (2.4% below list).
- Recommended offer: $613k (12.0% below list) — sets the bar for market timing.
- Cap rate 6.3% vs local median 1.9% in Gunter — top-decile yield for the area; either an underpriced asset or a hidden risk that comps aren't pricing in. Stress-test before assuming the spread holds.
Location & tenants
- Location reads 72/100 on livability (#236 in TX) — a middle-class / working-renter tenant base. Strengths: crime A+, employment A+, housing A+; Watch: amenities F, commute F, health & safety F.
- Gunter ISD (rural): math 47% / reading 58% proficiency, ranked #103 of 826 in TX (top 12%) — acceptable for families but not a draw, mixed tenant base, ~2y average lease.
- Market conditions: 201 active listings in the ZIP; 1 comparable units currently listed for rent nearby; 2,272 units permitted in Grayson County in 2024 (750 in 5+ unit buildings).
Forward outlook
- In year one you build about $83k of equity ($5k loan paydown + $78k appreciation (10.0% local appreciation)).
- Grayson County population projected at +12% by 2050 — modest demand growth; plan on rents tracking national, not racing it.
- At projected returns (10.0% appreciation + 3.0% rent growth), your $218k cash investment doubles in ~3 years — after that, you're playing with house money.
- By year 2, paydown + projected appreciation supports a ~$134k cash-out refi (75% LTV) — recoverable capital for the next deal without selling this one.
Negotiation context
- It's been on market 863 days — a 12% lower offer ($613k) is reasonable based on typical stale-listing flexibility.
Questions for the listing agent
- What do current leases actually rent for vs. the listed asking? Can we see a recent rent roll and the last 12 months of T-12 income?
- It's been on market 863 days. Have you received any prior offers? Is the seller open to a 12% concession, seller financing, or rate buy-down credit?
- Why hasn't it sold? Are there any deal-killer items the seller is aware of (foundation, flood, title, zoning, code violations)?
- Is there a deadline driving the sale (1031 exchange, divorce, estate, relocation)? That informs how much negotiation room exists.
- What's the average days-on-market for RENTAL listings here right now (not sales)? A rising rental-DOM trend means longer vacancies and softer asking-rent achievability than the comps imply.
- What's the recent tenant-quality profile in this submarket — average credit score on applications, eviction rate, late-payment / NSF rate, and stable-employment percentage? A property-management company in the area should have these aggregated.
- How much new for-sale + rental construction is in the pipeline within 1–3 miles? Heavy new supply typically softens prices + rents 12–24 months out; constrained supply supports both.
Investment metrics
- 1% rule
- 0.87% ✗
- Cap rate
- 6.27%
- Cash-on-cash
- -0.09%
- DSCR
- 1.00
- GRM
- 9.6
CMA / ARV
- ARV (median comp)
- $779,587
- List price
- $696,990
- Delta
- -10.59%
- Verdict
- UNDERPRICED
- Comps
- 20 within 1.0 mi
Show comp detail 12 sales within ~0.75 mi
| Address | Dist | Beds/Ba | Sqft | Sold | Price | $/sf | Match |
|---|---|---|---|---|---|---|---|
| 335 Waterview Dr | 0.08mi | 4/3.0 | 3,014 (-4%) | 2mo | $800,199 | $265 | 88 |
| 150 Waterview Dr | 0.29mi | 4/3.0 | 3,021 (-4%) | 2mo | $774,789 | $256 | 78 |
| 130 Meadow Ln | 0.22mi | 4/3.0 | 3,382 (+8%) | 1mo | $875,000 | $259 | 76 |
| 115 Knoll Trl | 0.41mi | 4/3.5 | 3,132 (-0%) | 3mo | $849,900 | $271 | 76 |
| 325 Waterview Dr | 0.10mi | 4/3.0 | 3,402 (+8%) | 10mo | $834,888 | $245 | 74 |
| 170 Meadow Ln | 0.22mi | 4/3.0 | 3,441 (+10%) | 2mo | $885,544 | $257 | 72 |
| 300 Waterview Dr | 0.19mi | 4/3.0 | 2,784 (-11%) | 1mo | $700,000 | $251 | 71 |
| 160 Waterview Dr | 0.29mi | 4/2.5 | 2,862 (-9%) | 2mo | $684,999 | $239 | 68 |
| 139 Parkside Ct | 0.56mi | 4/3.0 | 3,275 (+4%) | 4mo | $900,000 | $275 | 64 |
| 1264 Mackey Rd | 0.68mi | 5/3.0 (+1) | 3,009 (-4%) | 3mo | $2,475,000 | $823 | 54 |
| 1956 Jc Maples Rd | 0.55mi | 4/3.5 | 3,529 (+12%) | 2mo | $1,175,000 | $333 | 50 |
| 686 Cypress Point Dr | 0.67mi | 3/2.5 (-1) | 2,767 (-12%) | 1mo | $729,000 | $263 | 41 |
Match score weights: distance 35% · size 25% · config 20% · recency 20%. Top-matched comps best support the ARV.
Projected returns pro-forma
10.0% appreciation · 3.0% rent growth · sell at horizon
- IRR
- 24.2%
- Equity multiple
- 2.94×
- Total profit
- $423,696
- Equity at exit
- $702,314
- IRR
- 21.5%
- Equity multiple
- 6.72×
- Total profit
- $1,248,697
- Equity at exit
- $1,514,566
Cash invested: $218,284 (down + closing). Projections, not guarantees.
Landlord ↔ Tenant lean methodology
- Overall (STATE)
- 87 Strongly Landlord-Friendly
- State Texas
- 87 Strongly Landlord-Friendly · R+5
- County
- — inherits STATE
- City
- — inherits STATE
ZIP-level market 75058
- Home prices YoY
- 6.4%
- Active inventory
- 201
- Price-to-rent
- 8.5×
Monthly cashflow live
- Estimated rent
- $6,800 medium interval (Pro) →
- Mortgage (P&I)
- −$4,088
- Tax est. 1.5%
- −$974 /mo · $11,694/yr
- Insurance
- −$325
- HOA
- −$0
- Vacancy / Maint / Mgmt
- −$1,428
- Net cashflow
- $-16
Break-even live
UW: 25.0% down · 7.5% · 30yr · 1.5% tax · 5.0% vac · 8.0% maint · 8.0% mgmt
Financing live
Cash to close
- Down payment
- $194,897
- Closing costs
- $23,388
- Reserves months
- —
- Total cash needed
- —
Loan-product check · same deal, 3 products live
Conventional
25% down · 7.5% · 30yr
- Down + closing
- —
- Monthly P&I
- —
- Monthly cashflow
- —
- DSCR
- —
- Eligible?
- —
Personal DTI + credit; lowest rate.
DSCR
20% down · 8.5% · 30yr
- Down + closing
- —
- Monthly P&I
- —
- Monthly cashflow
- —
- DSCR
- —
- Eligible?
- —
No personal income docs; deal must DSCR.
Hard money
10% down · 12.0% · 12mo
- Down + closing
- —
- Monthly P&I
- —
- Monthly cashflow
- —
- DSCR
- —
- Eligible?
- —
Short-term bridge; refi at stabilization.
Rent comps 1 comps
| Address | Beds | Baths | Sqft | Rent | $/sqft | DOM | Units | Dist |
|---|---|---|---|---|---|---|---|---|
| 300 Waterview Dr Gunter, TX | 4.0 | 3.0 | 2784 | $6,800 | $2.44 | 15d | 1 | 0.19mi |
Listing history 14 events
-
2026-06-18days on market $696,990 Active 863 DOM
-
2026-06-17days on market $696,990 Active 862 DOM
-
2026-06-16days on market $696,990 Active 861 DOM
-
2026-06-15days on market $696,990 Active 860 DOM
-
2026-06-13days on market $696,990 Active 858 DOM
-
2026-06-09days on market $696,990 Active 854 DOM
-
2026-06-08days on market $696,990 Active 853 DOM
-
2026-06-07days on market $696,990 Active 852 DOM
-
2026-06-04days on market $696,990 Active 849 DOM
-
2026-06-03days on market $696,990 Active 848 DOM
-
2026-06-02days on market $696,990 Active 847 DOM
-
2026-06-01days on market $696,990 Active 846 DOM
-
2026-05-31days on market $696,990 Active 845 DOM
-
2024-02-06$696,990 Active 1506-char remark
Show marketing remark (1506 chars)
If you're looking for a home that offers it all, you will admire the features and options of this home. Choose from six elevation styles, three including gorgeous stone details. Walk through the foyer to the study, separated by French doors, or continue to the open-concept common areas. This home is centered around a large family room with a wall of windows that draws in an abundance of natural light. With a fireplace, create a cozy and welcoming atmosphere to welcome friends and family. Whether you love to cook or simply cook for routine, you will enjoy this designer kitchen. It features gorgeous granite countertops, a sizeable walk-in pantry, ample cabinet space, a large island with room for seating, and stainless-steel appliances. Step out to the optional rear covered patio for the ultimate outdoor living experience. For more possibilities, the large flex room with a walk-in closet can be transformed into a space that fits your life. Ensuring privacy, the master bedroom is separated from the secondary bedrooms and boasts a huge walk-in closet. The master bath includes a dual sink vanity, a walk-in shower with a seat, and a garden tub. If you crave an extra touch of elegance, you can select the luxury bath option and enjoy an oversized walk-in shower, dual vanities, and a free-standing tub. Three additional bedrooms have easy access to two full baths and offer generous walk-in closets. The large utility room can include a cabinet and sink, if you choose and the two-car garage can
ⓘ Source: listings_history table (triggers on properties + properties_extension) + one-shot
backfill from property_details.listing_events for pre-trigger history.
Nearby sold comps map
Loading sold comps map…
Walkable amenities ~0.75 mi
Loading nearby amenities…
Taxation est. · year 1
- Rental income
- $81,600
- − Mortgage interest
- −$43,669
- − Property taxes
- −$11,694
- − Insurance
- −$3,898
- − Repairs & maintenance
- −$6,528
- − Management
- −$6,528
- − Depreciation
- −$22,679
- Taxable loss
- −$13,396
- Est. tax savings @ 24.0%
- +$3,215
- After-tax cash flow
- $3,028/yr
For passive investors: Depreciation is non-cash, so a rental often shows a tax loss while cash-flowing — sheltering income. Rental losses are passive: they offset passive income freely, and up to $25,000/yr can offset ordinary (W-2) income if you actively participate and your MAGI is under $100k (phasing out to $0 by $150k); unused losses carry forward. On sale, claimed depreciation is recaptured at up to 25%, and gains may owe capital-gains tax (a 1031 exchange can defer both). Figures are a year-1 estimate at your 24.0% rate — not tax advice; consult a CPA.
Condition & rehab AI · 12 photos
This home is in good condition with a good exterior and interior. It has a good roof and flooring. The kitchen and bathrooms are modern. Painting the exterior and landscaping would significantly increase its value.
Value-add opportunities
- Both Painting exterior — Enhances curb appeal and value
- Both Landscaping — Improves curb appeal and enhances property value
- Both Flooring in bathrooms — Modernizes and improves functionality
Renovation cost estimate screening
Value-add ROI direction
- Both Painting exterior — Enhances curb appeal and value ↑
- Both Landscaping — Improves curb appeal and enhances property value ↑
- Both Flooring in bathrooms — Modernizes and improves functionality ↑
ⓘ Cost ranges are severity-bucket heuristics (US national rule-of-thumb). Get contractor quotes + a written scope before underwriting a rehab budget.
Schools (NCES district)
- District
- Gunter ISD
- NCES district ID
- 4821960
- Math proficiency
- 47% ▼ -8.00%
- Reading proficiency
- 58% ▼ -3.00%
- Median HH income
- $79,375
- Composite
- 47.63/100
- National rank
- #2254
- State rank
- #103 of 826 in TX
Livability — Gunter
- Score
- 72/100
- State rank
- #236
- US rank
- #5729
Category grades
Schools grade is shown separately in the Schools card above.
Census & demographics
- Census place
- Gunter, TX
- Population (ZIP)
- 3,614
Population outlook (Grayson County) Hauer SSP2
- Today (2025)
- 134,540 people
- By 2030
- 138,653 · +3.1%
- By 2040
- 145,958 · +8.5%
- By 2050
- 151,218 · +12.4%
- By 2075
- 161,802 · +20.3%
- By 2100
- 159,036 · +18.2%
Race, ethnicity, and origin ACS 2023
- Neighborhood character
- Predominantly White (75%)
- Race & ethnicity
- White 75% Hispanic / Latino 21% Two or more races 18% Black 1% Native American 1%
- Hispanic origin (detail)
- Mexican 20%
- Common ancestry
- Italian 3% Slovak 2% Lithuanian 2%
- Foreign-born
- 10% · Canada
- Languages at home
- 82% English-only · Spanish 18%
Political lean MEDSL · Grayson
- 2024 margin
- Solid R (+54.3) · D 22.5% · R 76.7%
- 2008→2024 swing
- -16.4pp toward R · 2008: -37.9pp · 2024: -54.3pp
- All cycles
- 2024: R+54.3 2020: R+49.9 2016: R+53.1 2012: R+48.0 2008: R+37.9
Not yet ingested
- Civics
- —
Market trends
- HPI YoY
- ▲ 18.56%
- Current HPI
- 309.3751
- Rent YoY
- —
- Metro
- —
- State GDP YoY
- ▲ 3.95%
- F500 in state
- 110
Industry mix (Fortune 500 HQ in TX)
| Industry | F500 HQs | Revenue |
|---|---|---|
| Energy | 16 | $1,198B |
|
||
| Technology | 5 | $198B |
|
||
| Engineering / Construction | 4 | $72B |
|
||
| Energy Services | 3 | $60B |
|
||
| Utilities | 3 | $41B |
|
||
| Healthcare | 2 | $330B |
|
||
Price history
1 event — show timeline
- 2024-02-06 Listed $696,990 Zillow
Cash-flow waterfall
monthlySold comps — $/sqft
last 12 mo · ≤1 miLoading sold comps…