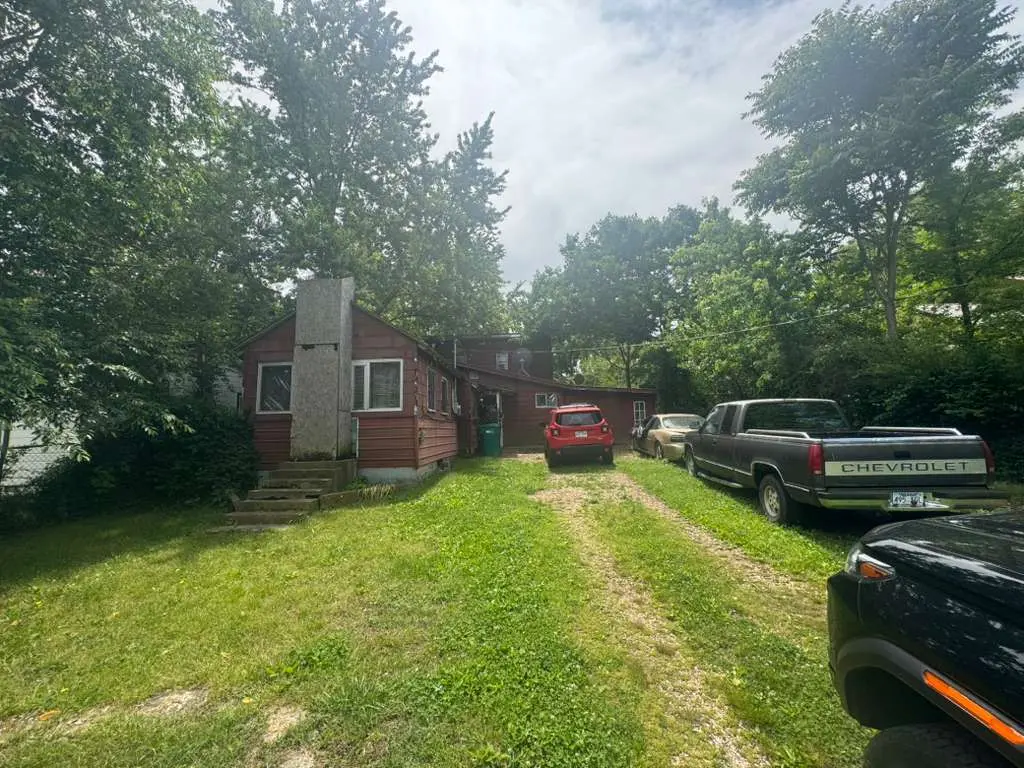
635 Hill Ave · Decatur, AR
Flood risk 1/10 · Minimal
- FEMA flood zone
- X (unshaded)
- Chance of flooding over 30 yrs
- 0.0%
- Est. flood insurance / yr
- $507 – $1,088
Fire risk 5/10 · Moderate
- Est. fire insurance / yr
- $1,499 – $2,785
Heat risk 5/10 · Moderate
- Hot days now (above 105°F)
- 7 days/yr
- Hot days in 30 yrs
- 20 days/yr
Wind risk 2/10 · Minimal
- Chance of severe wind over 30 yrs
- 3.0%
Air-quality risk 2/10 · Minimal
- Unhealthy air days now
- 0 days/yr
- Unhealthy air days in 30 yrs
- 1 days/yr
Risk factors via First Street. Map © Google.
Why this score? — see what drove the B+ grade
The composite is a weighted blend of 9 inputs, each scored 0–100. Each bar is that input's sub-score; the figure is the points it added to the 100-point composite (weight × sub-score).
- Cash flow +30.0/30.0
- 1% rule +10.0/10.0
- DSCR +10.0/10.0
- Appreciation +10.0/10.0
- ARV discount +7.5/15.0
- Livability +2.8/5.0
- Rent growth +2.5/5.0
- Condition / age +2.5/5.0
- Schools +2.4/10.0
$86,900
🖨 Deal sheet 📄 Offer letter ✓ Due diligence
Listing remarks
Investor special with strong potential in growing Decatur! This 3-bedroom, 2-bath home offers 1,338 sqft of living space and was built in 1984. Property will need cosmetic updates including paint, flooring repairs/replacement, and drywall repair for holes in some walls. Great opportunity for investors, flippers, or buyers looking to add value and customize the home to their liking. Conveniently located near local amenities, schools, and main road access. Being sold as-is.
Key facts
- Main road access
- Local amenities
- Cosmetic updates
Tags
Property features AI
Finance
- Other: Tax information available
- Financial info: Financial details not provided
- HOA & community: Monthly association fee
Exterior
- Parking: No driveway; 1 covered parking space
- Security: No security features listed
- Utilities: Electricity available; Natural gas available; Public water; Sewer available
- Home design: Single-story; 25 years or older
- Construction: Frame construction; Asphalt shingle roof; Crawlspace foundation
- Exterior features: Subdivision lot; Public road frontage
Interior
- Kitchen: Electric oven; Gas water heater
- Bedrooms: Bedroom details not provided
- Flooring: Carpet; Vinyl
- Bathrooms: 2 full bathrooms
- Heating & cooling: Gas heating
- Interior features: No additional interior features listed
- Laundry & utility: Laundry details not provided
Neighborhood map
What this means for you Summary
Snapshot
- This is a 4-bed/1.5-bath single-family listed at $87k.
Deal economics
- At list price, monthly cash flow is $600 ($7k/yr) — positive.
- The deal already cash-flows at list — no discount required.
- Meets the 1% rule at list price ($1k rent vs $87k).
- Recommended offer: $86k (1.5% below list) — sets the bar for market timing.
Location & tenants
- Location reads 56/100 on livability (#379 in AR) — a working-class tenant base; expect higher turnover. Strengths: cost of living A+, housing A+; Watch: schools F, crime F, amenities F.
- Decatur School District (rural): math 26% / reading 30% proficiency, ranked #163 of 238 in AR (top 68%) — low school quality limits family demand, transient renter base, plan for 1-2y turnover; 68% free/reduced lunch — lower-income household profile, screen leases tightly.
- Market conditions: 39 active listings in the ZIP; 12 comparable units currently listed for rent nearby; rentals leasing fast (median 14d on market — plan ~1-2 weeks tenant-placement turnaround); 4,359 units permitted in Benton County in 2024 (402 in 5+ unit buildings).
Forward outlook
- In year one you build about $9k of equity ($601 loan paydown + $9k appreciation (10.0% local appreciation)).
- Benton County population projected at +56% by 2050 — long-run rental-demand tailwind backs the buy-and-hold thesis.
- At projected returns (10.0% appreciation + 3.0% rent growth), your $24k cash investment doubles in ~2 years — after that, you're playing with house money.
- By year 4, paydown + projected appreciation supports a ~$33k cash-out refi (75% LTV) — recoverable capital for the next deal without selling this one.
Negotiation context
- It's been on market 29 days — a 2% lower offer ($86k) is reasonable based on typical stale-listing flexibility.
Risks & watch-outs
- Climate carrying-cost: moderate wildfire risk; extreme-heat days projected 7→20/yr by 2055 (HVAC capex compounding) — expect insurance premiums to compound above CPI over the hold.
Questions for the listing agent
- Is there a deadline driving the sale (1031 exchange, divorce, estate, relocation)? That informs how much negotiation room exists.
- Schools are F-rated, which usually means shorter tenancies and higher turnover. Who's the typical renter profile here, and what's been the actual vacancy rate?
- Crime grade is F in this area — have there been break-ins, vandalism, or insurance claims at this property in the last 3 years? What carrier currently insures it and at what premium?
- What's the average days-on-market for RENTAL listings here right now (not sales)? A rising rental-DOM trend means longer vacancies and softer asking-rent achievability than the comps imply.
- What's the recent tenant-quality profile in this submarket — average credit score on applications, eviction rate, late-payment / NSF rate, and stable-employment percentage? A property-management company in the area should have these aggregated.
- How much new for-sale + rental construction is in the pipeline within 1–3 miles? Heavy new supply typically softens prices + rents 12–24 months out; constrained supply supports both.
Investment metrics
- 1% rule
- 1.65% ✓
- Cap rate
- 14.58%
- Cash-on-cash
- 29.61%
- DSCR
- 2.32
- GRM
- 5.1
CMA / ARV
- ARV (on-the-fly)
- $231,474
- Comps found
- 12
Show comp detail 12 sales within ~0.75 mi
| Address | Dist | Beds/Ba | Sqft | Sold | Price | $/sf | Match |
|---|---|---|---|---|---|---|---|
| 776 Midway Ave | 0.11mi | 4/2.0 | 1,275 (-5%) | 6mo | $130,000 | $102 | 80 |
| 291 7th St | 0.04mi | 3/1.5 (-1) | 1,440 (+8%) | 3mo | $226,000 | $157 | 78 |
| 628 Buckner Ave | 0.03mi | 3/1.0 (-1) | 1,148 (-14%) | 1mo | $234,900 | $205 | 67 |
| 366 Spring Ave | 0.20mi | 3/1.5 (-1) | 1,476 (+10%) | 3mo | $150,200 | $102 | 66 |
| 311 Charley St | 0.50mi | 3/1.0 (-1) | 1,262 (-6%) | 2mo | $225,000 | $178 | 59 |
| 1401 Timberline Ave | 0.55mi | 3/2.0 (-1) | 1,420 (+6%) | 6mo | $259,900 | $183 | 52 |
| 1462 Crestview Ave | 0.55mi | 3/2.0 (-1) | 1,206 (-10%) | 6mo | $237,000 | $197 | 45 |
| 1652 Crestview Ave | 0.69mi | 4/2.0 | 1,420 (+6%) | 13mo | $227,500 | $160 | 45 |
| 725 Timberline St | 0.51mi | 3/2.0 (-1) | 1,468 (+10%) | 11mo | $300,000 | $204 | 44 |
| 1658 Stadium Ave | 0.64mi | 3/1.5 (-1) | 1,463 (+9%) | 8mo | $205,000 | $140 | 43 |
| 612 Meadow Brook Ct | 0.74mi | 3/2.0 (-1) | 1,217 (-9%) | 6mo | $210,000 | $173 | 38 |
| 608 Meadowbrook Ct | 0.74mi | 3/2.0 (-1) | 1,217 (-9%) | 21mo | $197,000 | $162 | 26 |
Match score weights: distance 35% · size 25% · config 20% · recency 20%. Top-matched comps best support the ARV.
Projected returns pro-forma
10.0% appreciation · 3.0% rent growth · sell at horizon
- IRR
- 46.8%
- Equity multiple
- 4.52×
- Total profit
- $85,544
- Equity at exit
- $78,286
- IRR
- 40.6%
- Equity multiple
- 10.12×
- Total profit
- $221,800
- Equity at exit
- $168,828
Cash invested: $24,332 (down + closing). Projections, not guarantees.
Landlord ↔ Tenant lean methodology
- Overall (STATE)
- 92 Strongly Landlord-Friendly
- State Arkansas
- 92 Strongly Landlord-Friendly · R+14
- County
- — inherits STATE
- City
- — inherits STATE
ZIP-level market 72722
- Home prices YoY
- 15.4%
- Active inventory
- 39
- Price-to-rent
- 5.1×
Monthly cashflow live
- Estimated rent
- $1,431 high interval (Pro) →
- Mortgage (P&I)
- −$456
- Tax from tax record
- −$38 /mo · $458/yr
- Insurance
- −$36
- HOA
- −$0
- Vacancy / Maint / Mgmt
- −$300
- Net cashflow
- $600
Break-even live
UW: 25.0% down · 7.5% · 30yr · 1.5% tax · 5.0% vac · 8.0% maint · 8.0% mgmt
Financing live
Cash to close
- Down payment
- $21,725
- Closing costs
- $2,607
- Reserves months
- —
- Total cash needed
- —
Loan-product check · same deal, 3 products live
Conventional
25% down · 7.5% · 30yr
- Down + closing
- —
- Monthly P&I
- —
- Monthly cashflow
- —
- DSCR
- —
- Eligible?
- —
Personal DTI + credit; lowest rate.
DSCR
20% down · 8.5% · 30yr
- Down + closing
- —
- Monthly P&I
- —
- Monthly cashflow
- —
- DSCR
- —
- Eligible?
- —
No personal income docs; deal must DSCR.
Hard money
10% down · 12.0% · 12mo
- Down + closing
- —
- Monthly P&I
- —
- Monthly cashflow
- —
- DSCR
- —
- Eligible?
- —
Short-term bridge; refi at stabilization.
Rent comps 12 comps
| Address | Beds | Baths | Sqft | Rent | $/sqft | DOM | Units | Dist |
|---|---|---|---|---|---|---|---|---|
| 527 Pool St Apt C Decatur, AR | 3.0 | 2.0 | 1000 | $1,050 | $1.05 | 43d | 1 | 0.45mi |
| 426 Blue Springs St Decatur, AR | 3.0 | 2.5 | 1250 | $1,250 | $1.00 | 43d | 1 | 0.77mi |
| 220 Golden Field Rd Decatur, AR | 3.0 | 2.0 | 1168 | $1,600 | $1.37 | 13d | 1 | 1.15mi |
| 300 Golden Field Rd Decatur, AR | 3.0 | 2.0 | 1168 | $1,600 | $1.37 | 13d | 1 | 1.15mi |
| 308 Golden Field Rd Decatur, AR | 3.0 | 2.0 | 1168 | $1,600 | $1.37 | 13d | 1 | 1.16mi |
| 221 Golden Field Rd Decatur, AR | 3.0 | 2.0 | 1168 | $1,600 | $1.37 | 13d | 1 | 1.18mi |
| 301 Golden Field Rd Decatur, AR | 3.0 | 2.0 | 1168 | $1,600 | $1.37 | 13d | 1 | 1.18mi |
| 304 Honeybee Ave Decatur, AR | 4.0 | 2.0 | 1505 | $1,750 | $1.16 | 13d | 1 | 1.20mi |
| 401 Honeybee Ave Decatur, AR | 3.0 | 2.0 | 1200 | $1,600 | $1.33 | 21d | 1 | 1.24mi |
| 401 Foliage St Decatur, AR | 3.0 | 2.0 | 1166 | $1,600 | $1.37 | 43d | 1 | 1.33mi |
| 1202 Nedra Dr Unit A Decatur, AR | 3.0 | 2.5 | 1216 | $1,250 | $1.03 | 13d | 1 | 1.49mi |
| 1204 Nedra Dr #1 Decatur, AR | 3.0 | 2.5 | 1216 | $1,195 | $0.98 | 13d | 1 | 1.50mi |
Listing history 18 events
-
2026-06-18days on market $86,900 Active 29 DOM
-
2026-06-17days on market $86,900 Active 28 DOM
-
2026-06-16days on market $86,900 Active 27 DOM
-
2026-06-15days on market $86,900 Active 26 DOM
-
2026-06-14days on market $86,900 Active 24 DOM
-
2026-06-13days on market $86,900 Active 23 DOM
-
2026-06-10days on market $86,900 Active 21 DOM
-
2026-06-09days on market $86,900 Active 20 DOM
-
2026-06-08days on market $86,900 Active 19 DOM
-
2026-06-07days on market $86,900 Active 18 DOM
-
2026-06-05days on market $86,900 Active 15 DOM
-
2026-06-03days on market $86,900 Active 14 DOM
-
2026-06-02days on market $86,900 Active 13 DOM
-
2026-06-01days on market $86,900 Active 12 DOM
-
2026-05-31days on market $86,900 Active 11 DOM
-
2026-05-31days on market $86,900 Active 10 DOM
-
2026-05-21price $89,900
-
2026-05-20$119,900 Active
ⓘ Source: listings_history table (triggers on properties + properties_extension) + one-shot
backfill from property_details.listing_events for pre-trigger history.
Tax reassessment forecast AR · Resets to sale price
- Current annual tax
- $458 · $38/mo
- Projected year-2 tax
- $556 · $46/mo
- Expected delta
- +$98/yr (+$8/mo · 21.5%)
ⓘ Screening estimate from a state-policy table — verify with the county assessor before closing.
Climate risk First Street
- Flood 1/10 Low FEMA zone X (unshaded) · 0% chance over 30 yrs
- Wildfire 5/10 Major
- Heat 5/10 Major 7 d/yr ≥105°F today · 20 d/yr by 30 yrs out
- Wind 2/10 Low 3% chance of damaging wind over 30 yrs
- Air quality 2/10 Low 0 unhealthy d/yr today · 1 by 30 yrs out
Nearby sold comps map
Loading sold comps map…
Walkable amenities ~0.75 mi
Loading nearby amenities…
Taxation est. · year 1
- Rental income
- $17,171
- − Mortgage interest
- −$4,868
- − Property taxes
- −$458
- − Insurance
- −$434
- − Repairs & maintenance
- −$1,374
- − Management
- −$1,374
- − Depreciation
- −$2,528
- Taxable income
- $6,136
- Est. tax owed @ 24.0%
- −$1,473
- After-tax cash flow
- $5,732/yr
For passive investors: Depreciation is non-cash, so a rental often shows a tax loss while cash-flowing — sheltering income. Rental losses are passive: they offset passive income freely, and up to $25,000/yr can offset ordinary (W-2) income if you actively participate and your MAGI is under $100k (phasing out to $0 by $150k); unused losses carry forward. On sale, claimed depreciation is recaptured at up to 25%, and gains may owe capital-gains tax (a 1031 exchange can defer both). Figures are a year-1 estimate at your 24.0% rate — not tax advice; consult a CPA.
Schools (NCES district)
- District
- Decatur School District
- NCES district ID
- 0504980
- Math proficiency
- 26% ▼ -6.00%
- Reading proficiency
- 30% ▬ 0.00%
- Median HH income
- $41,201
- Composite
- 23.69/100
- National rank
- #7833
- State rank
- #163 of 238 in AR
Livability — Decatur
- Score
- 56/100
- State rank
- #379
- US rank
- #22548
Category grades
Schools grade is shown separately in the Schools card above.
Census & demographics
- Census place
- Decatur, AR
- City population
- 2,920
- Population (ZIP)
- 2,920
Population outlook (Benton County) Hauer SSP2
- Today (2025)
- 318,683 people
- By 2030
- 353,481 · +10.9%
- By 2040
- 425,280 · +33.4%
- By 2050
- 497,239 · +56.0%
- By 2075
- 662,114 · +107.8%
- By 2100
- 776,431 · +143.6%
Race, ethnicity, and origin ACS 2023
- Neighborhood character
- Diverse neighborhood (Simpson 0.66)
- Race & ethnicity
- White 56% Two or more races 29% Hispanic / Latino 14% Asian 5% Black 3% Native American 3%
- Hispanic origin (detail)
- Mexican 7% Puerto Rican 2%
- Common ancestry
- Italian 1% Iranian 1% Slovak 1%
- Foreign-born
- 13% · Canada, Vietnam
- Languages at home
- 82% English-only · Spanish 11% Other Asian/Pacific 3% French/Haitian/Cajun 2%
Political lean MEDSL · Benton
- 2024 margin
- Strong R (+27.0) · D 35.2% · R 62.1% · Other 2.7%
- 2008→2024 swing
- +9.6pp toward D · 2008: -36.5pp · 2024: -27.0pp
- All cycles
- 2024: R+27.0 2020: R+26.4 2016: R+34.9 2012: R+40.4 2008: R+36.5
Not yet ingested
- Civics
- —
Market trends
- HPI YoY
- ▲ 57.29%
- Current HPI
- 428.7914
- Rent YoY
- —
- Metro
- —
- State GDP YoY
- ▲ 3.80%
- F500 in state
- 10
Industry mix (Fortune 500 HQ in AR)
| Industry | F500 HQs | Revenue |
|---|---|---|
| Retail | 1 | $681B |
|
||
| Food / Agriculture | 1 | $53B |
|
||
| Retail / Energy | 1 | $22B |
|
||
| Transportation / Logistics | 1 | $12B |
|
||
| Energy | 1 | $4B |
|
||
Price history
-25.0% since first listed2 events — show timeline
- 2026-05-21 Price Changed $89,900 NWARMLS
- 2026-05-20 Listed $119,900 NWARMLS
Property tax history
+6.0%/yrLatest (2025): $458 · +0.0% YoY. Source: county tax records.
Cash-flow waterfall
monthlySold comps — $/sqft
last 12 mo · ≤1 miLoading sold comps…