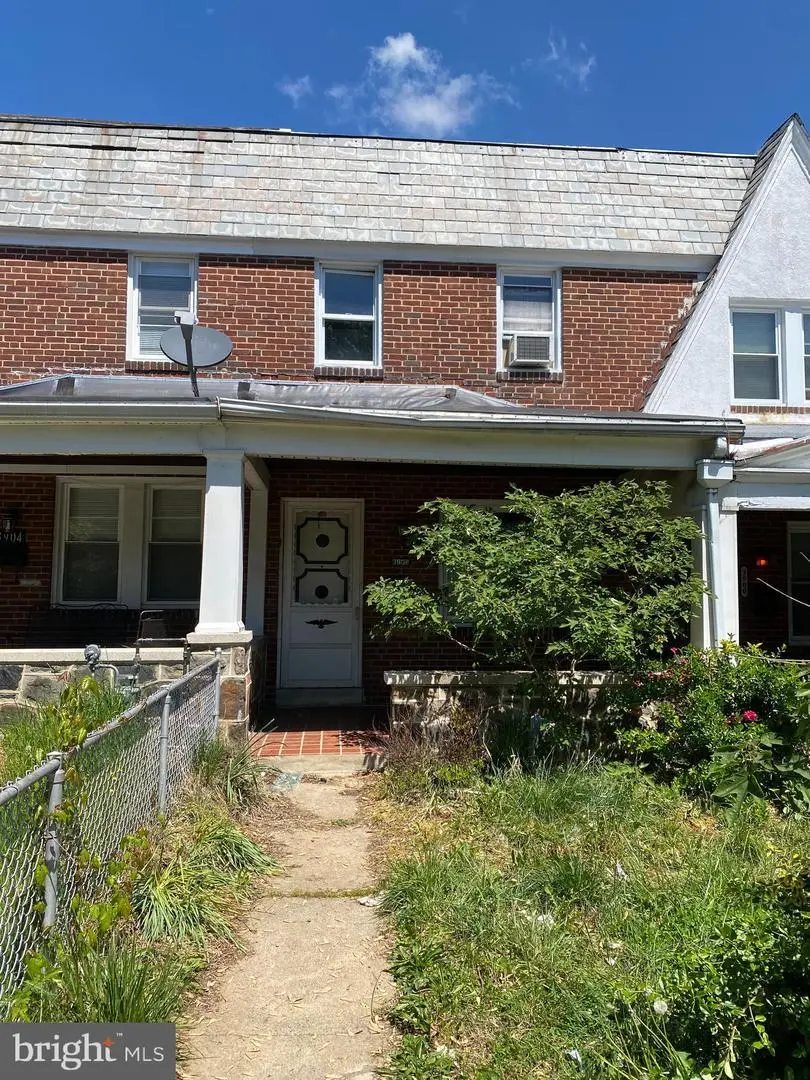
3902 Woodridge Rd · Baltimore, MD
Flood risk 1/10 · Minimal
- FEMA flood zone
- X (unshaded)
- Chance of flooding over 30 yrs
- 0.0%
- Est. flood insurance / yr
- $473 – $860
Fire risk 1/10 · Minimal
- Est. fire insurance / yr
- $755 – $1,403
Heat risk 7/10 · Major
- Hot days now (above 103°F)
- 7 days/yr
- Hot days in 30 yrs
- 15 days/yr
Wind risk 5/10 · Moderate
- Chance of severe wind over 30 yrs
- 24.0%
Air-quality risk 3/10 · Minor
- Unhealthy air days now
- 3 days/yr
- Unhealthy air days in 30 yrs
- 4 days/yr
Risk factors via First Street. Map © Google.
Why this score? — see what drove the B+ grade
The composite is a weighted blend of 9 inputs, each scored 0–100. Each bar is that input's sub-score; the figure is the points it added to the 100-point composite (weight × sub-score).
- Cash flow +30.0/30.0
- ARV discount +15.0/15.0
- 1% rule +10.0/10.0
- DSCR +10.0/10.0
- Rent growth +3.8/5.0
- Livability +3.8/5.0
- Condition / age +2.5/5.0
- Schools +1.0/10.0
- Appreciation +0.0/10.0
$109,900
🖨 Deal sheet (PDF) 📄 Offer letter ✓ Due diligence
Listing remarks
Multiple offers received. Seller requests highest & best offers due by Friday at 5:00. Edmondson Village never goes out of style and we have style by the pound ! Situated on a well presented tidy block right here in the middle of Edmondson Village, which we all know is the new hot ticket, but then again it always has been the hot ticket. We have a fully fenced yard, a covered porch and a big wide alley outback with a deep spacious yard. Bring the kids, and bring the pets because we have plenty of room for everyone to enjoy life in this place, and you can pull it off on a shoestring budget. A little bit of elbow grease and you'll have this one shining and styling, especially since it&r
Key facts
- Covered porch
- Deep spacious yard
- Finished basement
Tags
Property features AI
Exterior
- Parking: Paved surface parking; On-street parking; Alley access; Public parking nearby
- Security: Screens on windows
- Utilities: Public water; Public sewer; Above-ground and underground utilities; Municipal trash service
- Home design: Interior townhouse/rowhouse; Built-up/asphalt/shingle pitched roof
- Construction: Brick, block and frame construction with mixed materials; Cast iron, copper and mixed plumbing (including CPVC/PVC); Concrete and masonry elements; Block/brick/permanent foundation; Replacement, insulated double-hung windows with vinyl cladding; Building winterized; Year built (assessor source)
- Exterior features: Porch(es); Exterior lighting; Play area; Secure storage; Sidewalks; Street lights; Chain link fencing (fully fenced rear yard); Front yard and private rear yard; level lot
Interior
- Kitchen: Oven (single); Gas oven/range; Stove; Range hood; Refrigerator
- Bedrooms: Three bedrooms on the upper level
- Flooring: Hardwood; Vinyl; Ceramic tile; Carpet (partially carpeted); Concrete; Laminate; Wood
- Bathrooms: One full bathroom
- Heating & cooling: Hot water heating; Radiant heating; Electric cooling (220V, circuit breakers); Heating fuel: Oil; Hot water source: Natural gas
- Interior features: Open and traditional floor plans; Dining area; Eat-in kitchen with table space; Tub/shower; Wine storage; Flat ceilings; Wood and mixed flooring; Drywall and masonry walls; some unfinished/block walls
- Laundry & utility: Laundry in basement; Water heater
Neighborhood map
What this means for you Summary
Snapshot
- This is a 3-bed/1.0-bath townhouse listed at $110k.
Deal economics
- At list price, monthly cash flow is $611 ($7k/yr) — positive.
- The deal already cash-flows at list — no discount required.
- Meets the 1% rule at list price ($2k rent vs $110k).
- Recommended offer: $107k (3.0% below list) — sets the bar for market timing.
- Cap rate 13.0% vs local median 6.0% in Baltimore — top-decile yield for the area; either an underpriced asset or a hidden risk that comps aren't pricing in. Stress-test before assuming the spread holds.
Location & tenants
- Location reads 76/100 on livability (#90 in MD, #3,396 nationally) — a middle-class / working-renter tenant base. Strengths: amenities A+, commute A+, housing A+; Watch: crime F.
- Baltimore City Public Schools (urban): math 7% / reading 16% proficiency, ranked #24 of 24 in MD (top 100%) — low school quality limits family demand, transient renter base, plan for 1-2y turnover; 79% free/reduced lunch — lower-income household profile, screen leases tightly.
- Zoned schools: Wildwood Elementary/Middle (math 0% / reading 7%, grade F, #818 of 860 statewide, top 95%, 793 students, 84% FRL); Vanguard Collegiate Middle (math 3% / reading 15%, grade F, #212 of 225 statewide, top 95%, 343 students, 84% FRL); Baltimore Polytechnic Institute (math 71% / reading 84%, grade A-, #22 of 222 statewide, top 10%, 1,555 students, 43% FRL).
- Zoned-school proficiency averages 30% at this address vs 12% district-wide (+19 pts) — the actual schools serving this property are materially stronger than the Baltimore City Public Schools average implies; a family-tenant draw the district grade alone would hide.
- Market conditions: Rents rising fast (+5.4%/yr); 256 active listings in the ZIP; 40 comparable units currently listed for rent nearby; rentals at typical pace (median 26d on market — plan ~3-4 weeks tenant-placement turnaround); 45% of comp listings sitting > 30 days — soft ceiling on asking rent; 1,273 units permitted in Baltimore city in 2024 (1,104 in 5+ unit buildings).
- This rent runs 36% of the median local income ($60k/yr) — at the standard rent-burdened threshold; future hikes will face affordability resistance.
Forward outlook
- Local home prices are declining (-3.0%/yr); year-one equity from $760 of loan paydown is wiped out by about $3k of value loss. Plan a longer hold.
- Baltimore County population projected to shrink 4% by 2050 — rents likely to lag national; underwrite the cash flow, not the appreciation.
- At projected returns (-3.0% appreciation + 5.4% rent growth), your $31k cash investment doubles in ~5 years — after that, you're playing with house money.
Negotiation context
- It's been on market 58 days — a 3% lower offer ($107k) is reasonable based on typical stale-listing flexibility.
Risks & watch-outs
- Watch-outs: built in 1940 — expect roof / HVAC / electrical / plumbing capex.
- Climate carrying-cost: moderate wind risk, 24% chance of damaging wind over 30y; extreme-heat days projected 7→15/yr by 2055 (HVAC capex compounding) — expect insurance premiums to compound above CPI over the hold.
Questions for the listing agent
- It's been on market 58 days. Have you received any prior offers? Is the seller open to a 3% concession, seller financing, or rate buy-down credit?
- Built in 1940 — when were the roof, HVAC, electrical panel, plumbing, and water heater last replaced?
- Is there a deadline driving the sale (1031 exchange, divorce, estate, relocation)? That informs how much negotiation room exists.
- Schools are D-rated, which usually means shorter tenancies and higher turnover. Who's the typical renter profile here, and what's been the actual vacancy rate?
- Crime grade is F in this area — have there been break-ins, vandalism, or insurance claims at this property in the last 3 years? What carrier currently insures it and at what premium?
- What's the average days-on-market for RENTAL listings here right now (not sales)? A rising rental-DOM trend means longer vacancies and softer asking-rent achievability than the comps imply.
- What's the recent tenant-quality profile in this submarket — average credit score on applications, eviction rate, late-payment / NSF rate, and stable-employment percentage? A property-management company in the area should have these aggregated.
- How much new for-sale + rental construction is in the pipeline within 1–3 miles? Heavy new supply typically softens prices + rents 12–24 months out; constrained supply supports both.
Investment metrics
- 1% rule
- 1.65% ✓
- Cap rate
- 12.96%
- Cash-on-cash
- 23.82%
- DSCR
- 2.06
- GRM
- 5.1
CMA / ARV
- ARV (median comp)
- $154,668
- List price
- $109,900
- Delta
- -28.94%
- Verdict
- UNDERPRICED
- Comps
- 20 within 1.0 mi
Show comp detail 12 sales within ~0.75 mi
| Address | Dist | Beds/Ba | Sqft | Sold | Price | $/sf | Match |
|---|---|---|---|---|---|---|---|
| 1007 Wildwood Pkwy | 0.13mi | 3/1.0 | 1,216 (+1%) | 2mo | $111,100 | $91 | 90 |
| 3806 Rokeby Rd | 0.17mi | 3/1.0 | 1,160 (-3%) | 2mo | $120,000 | $103 | 85 |
| 1000 Mount Holly St | 0.14mi | 3/1.5 | 1,290 (+8%) | 1mo | $93,000 | $72 | 78 |
| 3821 Stokes Dr | 0.20mi | 3/2.0 | 1,254 (+4%) | 1mo | $145,000 | $116 | 78 |
| 4105 Flowerton Rd | 0.16mi | 2/2.0 (-1) | 1,260 (+5%) | 2mo | $119,990 | $95 | 73 |
| 1007 Mount Holly St | 0.16mi | 4/2.0 (+1) | 1,290 (+8%) | 2mo | $210,000 | $163 | 69 |
| 3224 Belmont Ave | 0.68mi | 3/1.5 | 1,178 (-2%) | 1mo | $77,000 | $65 | 63 |
| 300 Denison St | 0.59mi | 3/2.0 | 1,260 (+5%) | 2mo | $205,000 | $163 | 58 |
| 209 Mount Holly St | 0.51mi | 3/2.0 | 1,080 (-10%) | 2mo | $228,000 | $211 | 54 |
| 222 N Hilton St | 0.74mi | 3/1.0 | 1,120 (-7%) | 1mo | $89,775 | $80 | 53 |
| 38 N Monastery Ave | 0.74mi | 3/2.0 | 1,260 (+5%) | 3mo | $90,000 | $71 | 51 |
| 107 N Monastery Ave | 0.71mi | 2/1.5 (-1) | 1,080 (-10%) | 2mo | $65,000 | $60 | 42 |
Match score weights: distance 35% · size 25% · config 20% · recency 20%. Top-matched comps best support the ARV.
Projected returns pro-forma
-3.0% appreciation · 5.38% rent growth · sell at horizon
- IRR
- 19.8%
- Equity multiple
- 1.83×
- Total profit
- $25,593
- Equity at exit
- $16,386
- IRR
- 29.7%
- Equity multiple
- 3.98×
- Total profit
- $91,757
- Equity at exit
- $9,502
Cash invested: $30,772 (down + closing). Projections, not guarantees.
Landlord ↔ Tenant lean methodology
- Overall (CITY)
- 12 Strongly Tenant-Friendly
- State Maryland
- 27 Tenant-Leaning · D+14
- County
- — inherits STATE
- City Baltimore
- 12 Strongly Tenant-Friendly · D+58
ZIP-level market 21229
- Rents YoY
- 5.4%
- Active inventory
- 256
- Price-to-rent
- 5.1×
Monthly cashflow live
- Estimated rent
- $1,810 high interval (Pro) →
- Mortgage (P&I)
- −$576
- Tax from tax record
- −$197 /mo · $2,367/yr
- Insurance
- −$46
- HOA
- −$0
- Vacancy / Maint / Mgmt
- −$380
- Net cashflow
- $611
Break-even live
Sensitivity live
| Price | -10% $673 | -5% $642 | +0% $611 | +5% $580 | +10% $549 |
|---|---|---|---|---|---|
| Rent | -10% $468 | -5% $539 | +0% $611 | +5% $682 | +10% $754 |
| Rate | -1.0pp $666 | -0.5pp $639 | base $611 | +0.5pp $582 | +1.0pp $553 |
UW: 25.0% down · 7.5% · 30yr · 1.5% tax · 5.0% vac · 8.0% maint · 8.0% mgmt
Financing live
Cash to close
- Down payment
- $27,475
- Closing costs
- $3,297
- Reserves months
- —
- Total cash needed
- —
Loan-product check · same deal, 3 products live
Conventional
25% down · 7.5% · 30yr
- Down + closing
- —
- Monthly P&I
- —
- Monthly cashflow
- —
- DSCR
- —
- Eligible?
- —
Personal DTI + credit; lowest rate.
DSCR
20% down · 8.5% · 30yr
- Down + closing
- —
- Monthly P&I
- —
- Monthly cashflow
- —
- DSCR
- —
- Eligible?
- —
No personal income docs; deal must DSCR.
Hard money
10% down · 12.0% · 12mo
- Down + closing
- —
- Monthly P&I
- —
- Monthly cashflow
- —
- DSCR
- —
- Eligible?
- —
Short-term bridge; refi at stabilization.
Rent comps 40 comps
| Address | Beds | Baths | Sqft | Rent | $/sqft | DOM | Units | Dist |
|---|---|---|---|---|---|---|---|---|
| 4020 Gelston Dr Baltimore, MD | 3.0 | 2.0 | 1270 | $1,875 | $1.48 | 45d | 1 | 0.10mi |
| 3712 Gelston Dr Baltimore, MD | 3.0 | 2.0 | 1250 | $2,500 | $2.00 | 25d | 1 | 0.17mi |
| 4103 Mountwood Rd Baltimore, MD | 3.0 | 2.0 | 1030 | $1,700 | $1.65 | 45d | 1 | 0.27mi |
| 3935 Stokes Dr #1 Baltimore, MD | 2.0 | 1.0 | 1150 | $1,400 | $1.22 | 45d | 1 | 0.29mi |
| 1307 Wildwood Pkwy Baltimore, MD | 2.0 | 1.0 | 725 | $1,295 | $1.79 | 45d | 1 | 0.29mi |
| 1216 N Augusta Ave Baltimore, MD | 3.0 | 1.0 | 1024 | $1,550 | $1.51 | 25d | 1 | 0.29mi |
| 623 N Grantley St Baltimore, MD | 4.0 | 2.0 | 1250 | $2,000 | $1.60 | 25d | 1 | 0.30mi |
| 730 Linnard St Unit 1 Baltimore, MD | 4.0 | 1.0 | 1360 | $1,750 | $1.29 | 25d | 1 | 0.33mi |
| 3706 W Franklin St Unit 1 Baltimore, MD | 2.0 | 1.0 | 735 | $1,100 | $1.50 | 6d | 1 | 0.33mi |
| 917 Kevin Rd Baltimore, MD | 3.0 | 2.0 | 1151 | $1,795 | $1.56 | 3d | 1 | 0.34mi |
| 798 N Grantley St Baltimore, MD | 3.0 | 2.0 | 1360 | $2,295 | $1.69 | 25d | 1 | 0.36mi |
| 787 N Grantley St Baltimore, MD | 3.0 | 1.0 | 1116 | $1,575 | $1.41 | 25d | 1 | 0.36mi |
| 4103 Stokes Dr Apt 1 Baltimore, MD | 2.0 | 1.0 | 725 | $1,095 | $1.51 | 45d | 1 | 0.37mi |
| 780 Linnard St Baltimore, MD | 3.0 | 2.0 | 1224 | $1,590 | $1.30 | 45d | 1 | 0.39mi |
| 3507 Edmondson Ave Baltimore, MD | 4.0 | 2.0 | 1428 | $2,300 | $1.61 | 45d | 1 | 0.40mi |
| 3423 Edmondson Ave Baltimore, MD | 2.0 | 1.5 | 1400 | $1,710 | $1.22 | 45d | 1 | 0.44mi |
| 709 Denison St Baltimore, MD | 2.0 | 2.0 | 840 | $1,630 | $1.94 | 25d | 1 | 0.46mi |
| 405 N Edgewood St Baltimore, MD | 4.0 | 2.0 | 1408 | $2,750 | $1.95 | 0d | 1 | 0.50mi |
| 3607 W Lexington St Baltimore, MD | 3.0 | 2.0 | 1050 | $1,895 | $1.80 | 6d | 1 | 0.54mi |
| 3238 Westmont Ave Baltimore, MD | 3.0 | 1.0 | 1280 | $1,600 | $1.25 | 45d | 1 | 0.65mi |
| 4520 Scarlet Oak Ln Baltimore, MD | 2.0 | 1.0 | 1025 | $1,500 | $1.46 | 45d | 1 | 0.67mi |
| 1042 Ellicott Dr Baltimore, MD | 2.0 | 1.0 | 900 | $1,450 | $1.61 | 45d | 1 | 0.73mi |
| 3309 Brighton St Baltimore, MD | 3.0 | 1.0 | 1134 | $1,700 | $1.50 | 45d | 1 | 0.74mi |
| 111 Upmanor Rd Baltimore, MD | 3.0 | 1.5 | 1224 | $2,163 | $1.77 | 45d | 1 | 0.75mi |
| 41 N Kossuth St Baltimore, MD | 3.0 | 2.0 | 1216 | $1,800 | $1.48 | 25d | 1 | 0.76mi |
| 3709 Nortonia Rd #2 Baltimore, MD | 2.0 | 1.0 | 1289 | $1,450 | $1.12 | 19d | 1 | 0.77mi |
| 3015 Rayner Ave Baltimore, MD | 3.0 | 1.0 | 1152 | $1,350 | $1.17 | 45d | 1 | 0.79mi |
| 2 N Woodington Rd Baltimore, MD | 1.0–2.0 | 1.0 | 738 | $1,335 | $1.81 | 4d | 5 | 0.80mi |
| 2 S Woodington Rd Baltimore, MD | 2.0 | 1.0 | 856 | $1,160 | $1.36 | 16d | 1 | 0.80mi |
| 3310 Elbert St Baltimore, MD | 2.0 | 1.0 | 920 | $1,550 | $1.68 | 25d | 1 | 0.83mi |
| 3127 Baker St Baltimore, MD | 3.0 | 1.0 | 1000 | $1,300 | $1.30 | 45d | 1 | 0.87mi |
| 3336 W Caton Ave Baltimore, MD | 3.0 | 2.0 | 1236 | $1,625 | $1.31 | 25d | 1 | 0.88mi |
| 3003 Presstman St Unit 1 Baltimore, MD | 2.0 | 2.0 | 1450 | $1,400 | $0.97 | 46d | 1 | 0.92mi |
| 3003 Presstman St Unit 2 Baltimore, MD | 2.0 | 1.0 | 1450 | $1,300 | $0.90 | 25d | 1 | 0.92mi |
| 4018 Massachusetts Ave Baltimore, MD | 3.0 | 1.0 | 1050 | $1,400 | $1.33 | 25d | 1 | 0.93mi |
| 212 S Loudon Ave Baltimore, MD | 3.0 | 1.5 | 1310 | $1,550 | $1.18 | 45d | 1 | 0.96mi |
| 2103 Chelsea Ter Unit 2 Baltimore, MD | 3.0 | 1.5 | 1500 | $2,100 | $1.40 | 16d | 1 | 0.99mi |
| 2103 Chelsea Ter Unit 1 Baltimore, MD | 2.0 | 2.0 | 1500 | $2,200 | $1.47 | 16d | 1 | 0.99mi |
| 2806 Riggs Ave Baltimore, MD | 3.0 | 2.5 | 1412 | $1,900 | $1.35 | 5d | 1 | 1.01mi |
| 3514 Clifton Ave Unit 21 Baltimore, MD | 2.0 | 1.0 | 925 | $1,150 | $1.24 | 45d | 1 | 1.01mi |
Listing history 15 events
-
2026-06-21days on market $109,900 Active 58 DOM
-
2026-06-18days on market $109,900 Active 55 DOM
-
2026-06-17days on market $109,900 Active 54 DOM
-
2026-06-16days on market $109,900 Active 53 DOM
-
2026-06-15days on market $109,900 Active 52 DOM
-
2026-06-13pricedays on market $109,900 Active 50 DOM
-
2026-06-09days on market $119,900 Active 46 DOM
-
2026-06-08days on market $119,900 Active 45 DOM
-
2026-06-07days on market $119,900 Active 44 DOM
-
2026-06-04days on market $119,900 Active 41 DOM
-
2026-06-03days on market $119,900 Active 40 DOM
-
2026-06-02days on market $119,900 Active 39 DOM
-
2026-06-01days on market $119,900 Active 38 DOM
-
2026-05-31days on market $119,900 Active 37 DOM
-
2026-04-24$119,900 Active 1176-char remark
ⓘ Source: listings_history table (triggers on properties + properties_extension) + one-shot
backfill from property_details.listing_events for pre-trigger history.
Tax reassessment forecast MD · Partial reset (capped growth)
- Current annual tax
- $2,367 · $197/mo
- Projected year-2 tax
- $2,367 · $197/mo
- Expected delta
- $0/yr ($0/mo · 0.0%)
ⓘ Screening estimate from a state-policy table — verify with the county assessor before closing.
Climate risk First Street
- Flood 1/10 Low FEMA zone X (unshaded) · 0% chance over 30 yrs
- Wildfire 1/10 Low
- Heat 7/10 Severe 7 d/yr ≥103°F today · 15 d/yr by 30 yrs out
- Wind 5/10 Major 24% chance of damaging wind over 30 yrs
- Air quality 3/10 Moderate 3 unhealthy d/yr today · 4 by 30 yrs out
Nearby sold comps map
Loading sold comps map…
Walkable amenities ~0.75 mi
Loading nearby amenities…
Taxation est. · year 1
- Rental income
- $21,723
- − Mortgage interest
- −$6,156
- − Property taxes
- −$2,367
- − Insurance
- −$550
- − Repairs & maintenance
- −$1,738
- − Management
- −$1,738
- − Depreciation
- −$3,197
- Taxable income
- $5,978
- Est. tax owed @ 24.0%
- −$1,435
- After-tax cash flow
- $5,894/yr
For passive investors: Depreciation is non-cash, so a rental often shows a tax loss while cash-flowing — sheltering income. Rental losses are passive: they offset passive income freely, and up to $25,000/yr can offset ordinary (W-2) income if you actively participate and your MAGI is under $100k (phasing out to $0 by $150k); unused losses carry forward. On sale, claimed depreciation is recaptured at up to 25%, and gains may owe capital-gains tax (a 1031 exchange can defer both). Figures are a year-1 estimate at your 24.0% rate — not tax advice; consult a CPA.
Schools (NCES district)
- District
- Baltimore City Public Schools
- NCES district ID
- 2400090
- Math proficiency
- 7% ▼ -9.00%
- Reading proficiency
- 16% ▼ -5.00%
- Median HH income
- $42,108
- Composite
- 10.08/100
- National rank
- #9805
- State rank
- #24 of 24 in MD
Livability — Baltimore
- Score
- 76/100
- State rank
- #90
- US rank
- #3396
Category grades
Schools grade is shown separately in the Schools card above.
Census & demographics
- Census place
- Baltimore, MD
- County
- Baltimore City · 558,601 people
- City population
- 588,727
- Metro
- Baltimore-Columbia-Towson, MD
- Population (ZIP)
- 46,679
- Household income
- $60,047
- Rent vs Own
- Severe rent burden
- 2776.0
Population outlook (Baltimore County) Hauer SSP2
- Today (2025)
- 624,249 people
- By 2030
- 621,541 · -0.4%
- By 2040
- 609,756 · -2.3%
- By 2050
- 597,249 · -4.3%
- By 2075
- 552,236 · -11.5%
- By 2100
- 513,934 · -17.7%
Race, ethnicity, and origin ACS 2023
- Neighborhood character
- Predominantly Black (73%)
- Race & ethnicity
- Black 73% White 15% Hispanic / Latino 6% Two or more races 4% Asian 3%
- Hispanic origin (detail)
- Common ancestry
- Lithuanian 1% Romanian 1% Serbian 1%
- Foreign-born
- 5% · Canada, Philippines
- Languages at home
- 91% English-only · Spanish 4% Other Indo-European 2% Other Asian/Pacific 1%
Political lean MEDSL · Baltimore
- 2024 margin
- Solid D (+73.0) · D 85.2% · R 12.2% · Other 2.6%
- 2008→2024 swing
- -2.5pp toward R · 2008: 75.5pp · 2024: 73.0pp
- All cycles
- 2024: D+73.0 2020: D+76.6 2016: D+74.6 2012: D+76.4 2008: D+75.5
Not yet ingested
- Civics
- —
Market trends
- HPI YoY
- ▼ -259.07%
- Current HPI
- 226.896
- Rent YoY
- ▲ 5.38%
- Metro
- Baltimore-Columbia-Towson, MD
- State GDP YoY
- ▲ 2.97%
- F500 in state
- 12
Industry mix (Fortune 500 HQ in MD)
| Industry | F500 HQs | Revenue |
|---|---|---|
| Aerospace / Defense | 1 | $71B |
|
||
| Utilities | 1 | $25B |
|
||
| Hotels | 1 | $24B |
|
||
| Consumer Goods | 1 | $7B |
|
||
| Real Estate | 1 | $6B |
|
||
| Chemicals | 1 | $2B |
|
||
Price history
-8.3% since first listed2 events — show timeline
- 2026-06-12 Price Changed $109,900 BRIGHT MLS
- 2026-04-24 Listed $119,900 BRIGHT MLS
Property tax history
+1.5%/yrLatest (2025): $2,367 · +5.1% YoY. Source: county tax records.
Cash-flow waterfall
monthlySold comps — $/sqft
last 12 mo · ≤1 miLoading sold comps…