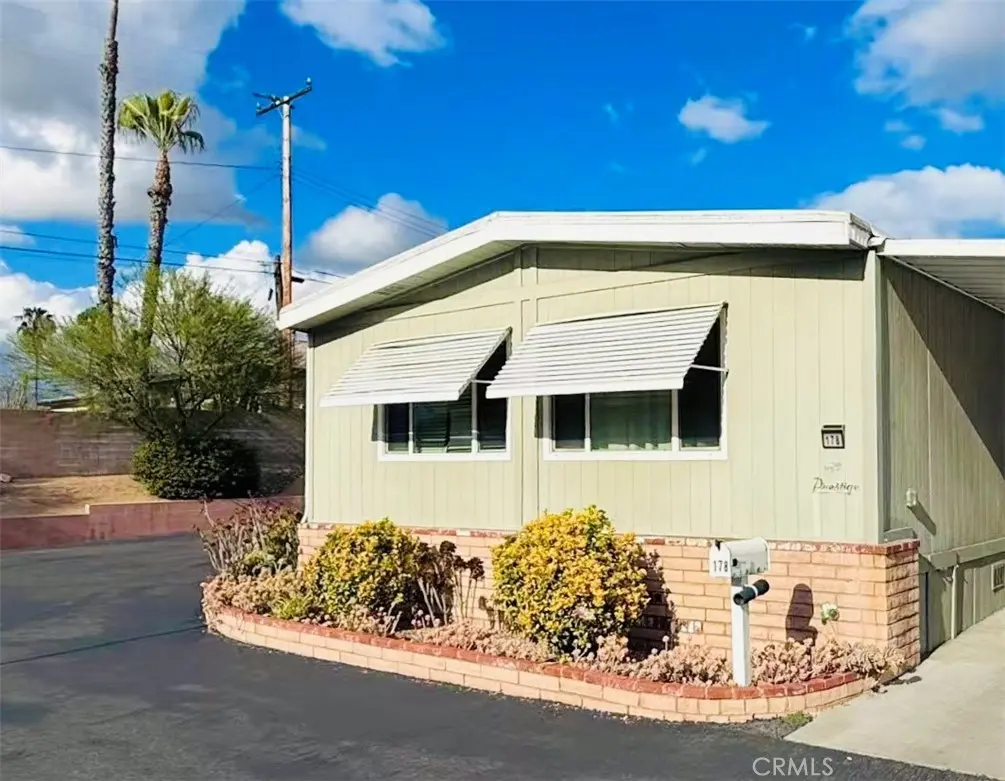
1560 S Otterbein Ave #178 · Rowland Heights, CA
Flood risk 1/10 · Minimal
- FEMA flood zone
- X (unshaded)
- Chance of flooding over 30 yrs
- 0.0%
- Est. flood insurance / yr
- $507 – $1,088
Fire risk 4/10 · Minor
- Est. fire insurance / yr
- $659 – $1,223
Heat risk 6/10 · Moderate
- Hot days now (above 99°F)
- 7 days/yr
- Hot days in 30 yrs
- 22 days/yr
Wind risk 1/10 · Minimal
- Chance of severe wind over 30 yrs
- —
Air-quality risk 7/10 · Major
- Unhealthy air days now
- 13 days/yr
- Unhealthy air days in 30 yrs
- 14 days/yr
Risk factors via First Street. Map © Google.
Why this score? — see what drove the C+ grade
The composite is a weighted blend of 9 inputs, each scored 0–100. Each bar is that input's sub-score; the figure is the points it added to the 100-point composite (weight × sub-score).
- Cash flow +30.0/30.0
- DSCR +10.0/10.0
- 1% rule +9.3/10.0
- Rent growth +5.0/5.0
- Schools +4.5/10.0
- Livability +2.5/5.0
- Condition / age +2.2/5.0
- ARV discount +0.0/15.0
- Appreciation +0.0/10.0
$268,000
🖨 Deal sheet 📄 Offer letter ✓ Due diligence
Listing remarks MLS
* * * Well Maintained Manufactured Home * * * Open & Spacious Floor Plan With Lots Of Windows And Natural Light Coming Thru Since This Is A Corner Lot Location, Excellent Quiet Location With Big Side Yard, 2 Cars Parking Space, Over Size Covered Porch For Outdoor Relaxation In The N. Side Of Home With New Exterior Carpets. Comfortable Living place with 2 Bedrooms, 2 Full Baths, Huge Family and Living Room, Lovely Kitchen with Breakfast Island, Formal Dining Area, Central Heating and Air Conditioning, Indoor Laundry Room. Carpet Throughout The Home, Large Master Bathroom Has Shower. * * * Inside small Pet is allowed. * * * Don't Miss This Opportunity * * * Make This One A Must See!!! * * * Low space rent is $850.00 monthly (Trash & Sewer paid). Community Pool, Clubhouse & Guest Parking. Located In The Heart Of Rowland Heights, Walking Distance To Schools, Rowland Park & Public Transportation. Close to Shopping, Supermarket, Park, Fwy 60, 605 & 57.
Key facts
- 2 parking spots
- Community pool
- Built 1977
Property features AI
Finance
- Other: Lot features indicate higher density (over 40 units/acre); Property listed as cosmetically needing repairs
- Financial info: Monthly land lease: $1,135
- HOA & community: Land lease in park (monthly); Rent includes trash and sewer; Park has street lighting; Manager approval required for residency; Pets allowed — contact park for limits
Exterior
- Parking: Attached carport (2 spaces); Concrete driveway; Park name: Hilea M. H. Park; RV parking available for a fee
- Security: Carbon monoxide detector(s); Smoke detector
- Utilities: Public/District water; Public sewer (sewer paid); Standard electric; Natural gas available; Electricity available
- Home design: Single-story manufactured double-wide home (24' x 60'); Mobile home remains on lot; Entry level: 1; Total stories: 1
- Construction: Aluminum exterior; Metal roof; Aluminum skirt; Pillar/post/pier foundation with pier jacks; Built date source: appraiser
- Exterior features: Porch and patio; Awning; In-ground fenced community pool; Shed on property; Wood fencing in average condition; Back yard
Interior
- Kitchen: Kitchen open to family room; Kitchen island; Gas range and gas oven; Garbage disposal; Vented exhaust fan; Water heater unit (gas)
- Bedrooms: Primary suite
- Flooring: Laminated flooring
- Bathrooms: 2 full bathrooms with bathtub and shower
- Heating & cooling: Central cooling; Central furnace heating
- Interior features: Open floor plan; Wood product walls; Carbon monoxide and smoke detectors installed; Ground-level entry with steps; One-level home
- Laundry & utility: Washer hookup; Gas dryer hookup; Dedicated laundry room
Neighborhood map
What this means for you Summary
Snapshot
- This is a 4-bed/2.0-bath manufactured listed at $268k. Condition is rated fair.
Deal economics
- At list price, monthly cash flow is $1k ($14k/yr) — positive.
- The deal already cash-flows at list — no discount required.
- Meets the 1% rule at list price ($4k rent vs $268k).
- Recommended offer: $260k (3.0% below list) — sets the bar for market timing.
- Cap rate 11.6% vs local median 2.7% in Rowland Heights — top-decile yield for the area; either an underpriced asset or a hidden risk that comps aren't pricing in. Stress-test before assuming the spread holds.
Location & tenants
- Location reads 50/100 on livability (#1,123 in CA) — a working-class tenant base; expect higher turnover. Strengths: employment A; Watch: crime C-, amenities F, commute F.
- Rowland Unified (suburban): math 40% / reading 62% proficiency, ranked #134 of 517 in CA (top 26%) — acceptable for families but not a draw, mixed tenant base, ~2y average lease.
- Zoned schools: Ybarra Academy For The Arts And Technology (596 students, 67% FRL); Alvarado Intermediate (648 students, 73% FRL); John A. Rowland High (math 49% / reading 68%, grade C, #223 of 1,170 statewide, top 19%, 2,025 students, 67% FRL).
- Market conditions: Rents rising fast (+10.3%/yr); 102 active listings in the ZIP; 22 comparable units currently listed for rent nearby; rentals at typical pace (median 25d on market — plan ~3-4 weeks tenant-placement turnaround); 41% of comp listings sitting > 30 days — soft ceiling on asking rent; solid renter incomes; 19,697 units permitted in Los Angeles County in 2024 (9,426 in 5+ unit buildings).
- At $3,832/mo this rent would consume 55% of the median local household income ($83k/yr) (locally 1440% of renters already pay >50% of income on rent) — very limited rent-growth headroom before tenants either downsize or default.
Forward outlook
- Local home prices are declining (-3.0%/yr); year-one equity from $2k of loan paydown is wiped out by about $8k of value loss. Plan a longer hold.
- Los Angeles County population projected at +9% by 2050 — modest demand growth; plan on rents tracking national, not racing it.
- At projected returns (-3.0% appreciation + 8.0% rent growth), your $75k cash investment doubles in ~6 years — after that, you're playing with house money.
Negotiation context
- It's been on market 38 days — a 3% lower offer ($260k) is reasonable based on typical stale-listing flexibility.
- 2 sale attempts since 9y ago with the ask held roughly flat each time — persistent listings suggest the price (not the market) is what's stuck; bring a comps-based counter.
- Current owner paid $98k; list at $268k implies a 173% gain — meaningful room to come down on a strong offer.
Risks & watch-outs
- Climate carrying-cost: extreme-heat days projected 7→22/yr by 2055 (HVAC capex compounding) — expect insurance premiums to compound above CPI over the hold.
Questions for the listing agent
- It's been on market 38 days. Have you received any prior offers? Is the seller open to a 3% concession, seller financing, or rate buy-down credit?
- Have any recent inspections been done? Can we get a copy of the seller's disclosures and any deferred-maintenance estimates?
- Built in 1977 — when were the roof, HVAC, electrical panel, plumbing, and water heater last replaced?
- Is there a deadline driving the sale (1031 exchange, divorce, estate, relocation)? That informs how much negotiation room exists.
- What's the average days-on-market for RENTAL listings here right now (not sales)? A rising rental-DOM trend means longer vacancies and softer asking-rent achievability than the comps imply.
- What's the recent tenant-quality profile in this submarket — average credit score on applications, eviction rate, late-payment / NSF rate, and stable-employment percentage? A property-management company in the area should have these aggregated.
- How much new for-sale + rental construction is in the pipeline within 1–3 miles? Heavy new supply typically softens prices + rents 12–24 months out; constrained supply supports both.
Investment metrics
- 1% rule
- 1.43% ✓
- Cap rate
- 11.55%
- Cash-on-cash
- 18.79%
- DSCR
- 1.84
- GRM
- 5.8
CMA / ARV
- ARV (median comp)
- $211,668
- List price
- $268,000
- Delta
- 26.61%
- Verdict
- OVERPRICED
- Comps
- 20 within 1.0 mi
Show comp detail 12 sales within ~0.75 mi
| Address | Dist | Beds/Ba | Sqft | Sold | Price | $/sf | Match |
|---|---|---|---|---|---|---|---|
| 1560 Otterbein Ave #12 | 0.10mi | 3/2.0 (-1) | 1,414 (-2%) | 4mo | $365,000 | $258 | 84 |
| 1560 S Otterbein Ave #58 | 0.10mi | 3/3.0 (-1) | 1,440 (0%) | 8mo | $345,000 | $240 | 80 |
| 1560 S Otterbein Ave #113 | 0.10mi | 3/2.0 (-1) | 1,568 (+9%) | 4mo | $308,000 | $196 | 72 |
| 1441 Paso Real Ave #246 | 0.55mi | 4/3.0 | 1,440 (0%) | 0mo | $210,000 | $146 | 70 |
| 1441 S Paso Real Ave #27 | 0.55mi | 4/2.0 | 1,440 (0%) | 5mo | $195,000 | $135 | 70 |
| 1441 Paso Real Ave #327 | 0.55mi | 3/2.0 (-1) | 1,440 (0%) | 1mo | $200,000 | $139 | 68 |
| 1560 S Otterbein #138 Ave #138 | 0.10mi | 3/2.0 (-1) | 1,320 (-8%) | 10mo | $300,000 | $227 | 68 |
| 1441 Paso Real Ave #203 | 0.55mi | 4/2.0 | 1,493 (+4%) | 4mo | $230,000 | $154 | 65 |
| 1441 Paso Real Ave #255 | 0.55mi | 3/2.0 (-1) | 1,440 (0%) | 8mo | $193,000 | $134 | 63 |
| 1441 Paso Real Ave #119 | 0.55mi | 3/2.0 (-1) | 1,392 (-3%) | 4mo | $220,000 | $158 | 60 |
| 1441 Paso Real Ave #271 | 0.56mi | 5/4.0 (+1) | 1,440 (0%) | 6mo | $238,000 | $165 | 56 |
| 1441 Paso Real Ave #184 | 0.56mi | 3/2.0 (-1) | 1,493 (+4%) | 9mo | $285,470 | $191 | 55 |
Match score weights: distance 35% · size 25% · config 20% · recency 20%. Top-matched comps best support the ARV.
Projected returns pro-forma
-3.0% appreciation · 8.0% rent growth · sell at horizon
- IRR
- 16.1%
- Equity multiple
- 1.69×
- Total profit
- $51,707
- Equity at exit
- $39,960
- IRR
- 28.2%
- Equity multiple
- 4.12×
- Total profit
- $233,776
- Equity at exit
- $23,172
Cash invested: $75,040 (down + closing). Projections, not guarantees.
Landlord ↔ Tenant lean methodology
- Overall (STATE)
- 18 Strongly Tenant-Friendly
- State California
- 18 Strongly Tenant-Friendly · D+13
- County
- — inherits STATE
- City
- — inherits STATE
ZIP-level market 91748
- Rents YoY
- 10.3%
- Active inventory
- 102
- Price-to-rent
- 5.8×
Monthly cashflow live
- Estimated rent
- $3,832 high interval (Pro) →
- Mortgage (P&I)
- −$1,405
- Tax est. 1.5%
- −$335 /mo · $4,020/yr
- Insurance
- −$112
- HOA
- −$0
- Vacancy / Maint / Mgmt
- −$805
- Net cashflow
- $1,175
Break-even live
UW: 25.0% down · 7.5% · 30yr · 1.5% tax · 5.0% vac · 8.0% maint · 8.0% mgmt
Financing live
Cash to close
- Down payment
- $67,000
- Closing costs
- $8,040
- Reserves months
- —
- Total cash needed
- —
Loan-product check · same deal, 3 products live
Conventional
25% down · 7.5% · 30yr
- Down + closing
- —
- Monthly P&I
- —
- Monthly cashflow
- —
- DSCR
- —
- Eligible?
- —
Personal DTI + credit; lowest rate.
DSCR
20% down · 8.5% · 30yr
- Down + closing
- —
- Monthly P&I
- —
- Monthly cashflow
- —
- DSCR
- —
- Eligible?
- —
No personal income docs; deal must DSCR.
Hard money
10% down · 12.0% · 12mo
- Down + closing
- —
- Monthly P&I
- —
- Monthly cashflow
- —
- DSCR
- —
- Eligible?
- —
Short-term bridge; refi at stabilization.
Rent comps 22 comps
| Address | Beds | Baths | Sqft | Rent | $/sqft | DOM | Units | Dist |
|---|---|---|---|---|---|---|---|---|
| 19319 Pilario St Rowland Heights, CA | 4.0 | 2.0 | 1480 | $3,750 | $2.53 | 43d | 1 | 0.24mi |
| 19231 Tranbarger St Rowland Heights, CA | 3.0 | 2.0 | 1170 | $3,200 | $2.74 | 43d | 1 | 0.24mi |
| 1316 Raleo Ave Rowland Heights, CA | 4.0 | 2.0 | 1200 | $5,000 | $4.17 | 15d | 1 | 0.38mi |
| 19530 Springport Dr Rowland Heights, CA | 5.0 | 2.0 | 1600 | $3,499 | $2.19 | 43d | 1 | 0.56mi |
| 1862 Hollandale Ave Rowland Heights, CA | 4.0 | 2.0 | 1588 | $4,250 | $2.68 | 17d | 1 | 0.56mi |
| 1809 Paso Real Ave Rowland Heights, CA | 4.0 | 2.0 | 1259 | $3,500 | $2.78 | 24d | 1 | 0.56mi |
| 2240 Electra Ave Rowland Heights, CA | 3.0 | 2.0 | 1256 | $3,200 | $2.55 | 17d | 1 | 0.69mi |
| 2143 Arcdale Ave Rowland Heights, CA | 3.0 | 2.0 | 1386 | $3,500 | $2.53 | 24d | 1 | 0.71mi |
| 2243 Otterbein Ave Rowland Heights, CA | 3.0 | 2.0 | 1286 | $3,600 | $2.80 | 43d | 1 | 0.75mi |
| 19358 Alcona St Rowland Heights, CA | 4.0 | 2.0 | 1613 | $3,950 | $2.45 | 43d | 1 | 0.77mi |
| 1808 Santa Ysabela Dr Rowland Heights, CA | 4.0 | 2.0 | 1175 | $3,500 | $2.98 | 20d | 1 | 0.90mi |
| 18617 Trot Ave Rowland Heights, CA | 3.0 | 2.0 | 1251 | $3,350 | $2.68 | 17d | 1 | 0.92mi |
| 19307 Oakview Ln Rowland Heights, CA | 4.0 | 2.0 | 1789 | $3,850 | $2.15 | 43d | 1 | 0.93mi |
| 18658 Mescalero St Rowland Heights, CA | 3.0 | 2.0 | 1352 | $3,800 | $2.81 | 22d | 1 | 0.99mi |
| 2817 E Valley Blvd West Covina, CA | 3.0 | 2.0 | 1050 | $3,100 | $2.95 | 43d | 1 | 1.04mi |
| 18573 Farjardo St Rowland Heights, CA | 3.0 | 2.0 | 1300 | $3,750 | $2.88 | 43d | 1 | 1.07mi |
| 2454 Hillman Ln Rowland Heights, CA | 3.0 | 2.5 | 1506 | $3,800 | $2.52 | 43d | 1 | 1.10mi |
| 18417 Santar St Rowland Heights, CA | 4.0 | 2.0 | 1142 | $3,300 | $2.89 | 17d | 1 | 1.11mi |
| 4037 S Ellesford Ave West Covina, CA | 4.0 | 2.0 | 1790 | $4,195 | $2.34 | 1d | 1 | 1.18mi |
| 18626 Barroso St Rowland Heights, CA | 3.0 | 2.0 | 1446 | $3,890 | $2.69 | 3d | 1 | 1.19mi |
| 2415 Los Padres Dr Rowland Heights, CA | 3.0 | 2.0 | 1120 | $3,300 | $2.95 | 17d | 1 | 1.20mi |
| 18448 La Guardia St Rowland Heights, CA | 4.0 | 2.0 | 1386 | $6,900 | $4.98 | 1d | 1 | 1.42mi |
Listing history 19 events
-
2026-06-18days on market $268,000 Active 38 DOM
-
2026-06-17days on market $268,000 Active 37 DOM
-
2026-06-16days on market $268,000 Active 36 DOM
-
2026-06-15days on market $268,000 Active 35 DOM
-
2026-06-13days on market $268,000 Active 33 DOM
-
2026-06-13days on market $268,000 Active 32 DOM
-
2026-06-09days on market $268,000 Active 29 DOM
-
2026-06-08days on market $268,000 Active 28 DOM
-
2026-06-07days on market $268,000 Active 27 DOM
-
2026-06-04days on market $268,000 Active 24 DOM
-
2026-06-03days on market $268,000 Active 23 DOM
-
2026-06-02days on market $268,000 Active 22 DOM
-
2026-06-01days on market $268,000 Active 21 DOM
-
2026-05-31days on market $268,000 Active 20 DOM
-
2026-05-11$268,000 Active 1789-char remark
-
2026-04-27historical $268,000 1789-char remark
-
2017-08-01soldstatus $98,000 Closed Sale 1012-char remark
Show marketing remark (1012 chars)
* * * Well Maintained Manufactured Home * * * Open & Spacious Floor Plan With Lots Of Windows And Natural Light Coming Thru Since This Is A Corner Lot Location, Excellent Quiet Location With Big Side Yard, 2 Cars Parking Space, Over Size Covered Porch For Outdoor Relaxation In The N. Side Of Home With New Exterior Carpets. Comfortable Living place with 2 Bedrooms, 2 Full Baths, Huge Family and Living Room, Lovely Kitchen with Breakfast Island, Formal Dining Area, Central Heating and Air Conditioning, Indoor Laundry Room. Carpet Throughout The Home, Large Master Bathroom Has Shower. * * * Inside small Pet is allowed. * * * Don't Miss This Opportunity * * * Make This One A Must See!!! * * * Low space rent is $850.00 monthly (Trash & Sewer paid). Community Pool, Clubhouse & Guest Parking. Located In The Heart Of Rowland Heights, Walking Distance To Schools, Rowland Park & Public Transportation. Close to Shopping, Supermarket, Park, Fwy 60, 605 & 57.
-
2017-06-14status Pending Sale 1012-char remark
Show marketing remark (1012 chars)
* * * Well Maintained Manufactured Home * * * Open & Spacious Floor Plan With Lots Of Windows And Natural Light Coming Thru Since This Is A Corner Lot Location, Excellent Quiet Location With Big Side Yard, 2 Cars Parking Space, Over Size Covered Porch For Outdoor Relaxation In The N. Side Of Home With New Exterior Carpets. Comfortable Living place with 2 Bedrooms, 2 Full Baths, Huge Family and Living Room, Lovely Kitchen with Breakfast Island, Formal Dining Area, Central Heating and Air Conditioning, Indoor Laundry Room. Carpet Throughout The Home, Large Master Bathroom Has Shower. * * * Inside small Pet is allowed. * * * Don't Miss This Opportunity * * * Make This One A Must See!!! * * * Low space rent is $850.00 monthly (Trash & Sewer paid). Community Pool, Clubhouse & Guest Parking. Located In The Heart Of Rowland Heights, Walking Distance To Schools, Rowland Park & Public Transportation. Close to Shopping, Supermarket, Park, Fwy 60, 605 & 57.
-
2017-05-17$98,000 Active 1012-char remark
Show marketing remark (1012 chars)
* * * Well Maintained Manufactured Home * * * Open & Spacious Floor Plan With Lots Of Windows And Natural Light Coming Thru Since This Is A Corner Lot Location, Excellent Quiet Location With Big Side Yard, 2 Cars Parking Space, Over Size Covered Porch For Outdoor Relaxation In The N. Side Of Home With New Exterior Carpets. Comfortable Living place with 2 Bedrooms, 2 Full Baths, Huge Family and Living Room, Lovely Kitchen with Breakfast Island, Formal Dining Area, Central Heating and Air Conditioning, Indoor Laundry Room. Carpet Throughout The Home, Large Master Bathroom Has Shower. * * * Inside small Pet is allowed. * * * Don't Miss This Opportunity * * * Make This One A Must See!!! * * * Low space rent is $850.00 monthly (Trash & Sewer paid). Community Pool, Clubhouse & Guest Parking. Located In The Heart Of Rowland Heights, Walking Distance To Schools, Rowland Park & Public Transportation. Close to Shopping, Supermarket, Park, Fwy 60, 605 & 57.
ⓘ Source: listings_history table (triggers on properties + properties_extension) + one-shot
backfill from property_details.listing_events for pre-trigger history.
Climate risk First Street
- Flood 1/10 Low FEMA zone X (unshaded) · 0% chance over 30 yrs
- Wildfire 4/10 Moderate
- Heat 6/10 Major 7 d/yr ≥99°F today · 22 d/yr by 30 yrs out
- Wind 1/10 Low
- Air quality 7/10 Severe 13 unhealthy d/yr today · 14 by 30 yrs out
Nearby sold comps map
Loading sold comps map…
Walkable amenities ~0.75 mi
Loading nearby amenities…
Taxation est. · year 1
- Rental income
- $45,979
- − Mortgage interest
- −$15,012
- − Property taxes
- −$4,020
- − Insurance
- −$1,340
- − Repairs & maintenance
- −$3,678
- − Management
- −$3,678
- − Depreciation
- −$7,796
- Taxable income
- $10,454
- Est. tax owed @ 24.0%
- −$2,509
- After-tax cash flow
- $11,589/yr
For passive investors: Depreciation is non-cash, so a rental often shows a tax loss while cash-flowing — sheltering income. Rental losses are passive: they offset passive income freely, and up to $25,000/yr can offset ordinary (W-2) income if you actively participate and your MAGI is under $100k (phasing out to $0 by $150k); unused losses carry forward. On sale, claimed depreciation is recaptured at up to 25%, and gains may owe capital-gains tax (a 1031 exchange can defer both). Figures are a year-1 estimate at your 24.0% rate — not tax advice; consult a CPA.
Condition & rehab AI · 6 photos
This well-maintained manufactured home is in fair condition with good exterior and interior features. A fresh coat of paint on the exterior siding and maintaining the gutters would significantly enhance its curb appeal and value.
Value-add opportunities
- Both Paint exterior siding — Painting the exterior siding can enhance the home's curb appeal and increase its value.
- Both Clean and maintain gutters — Clean gutters improve the home's appearance and prevent water damage to the siding and foundation.
Renovation cost estimate screening
Value-add ROI direction
- Both Paint exterior siding — Painting the exterior siding can enhance the home's curb appeal and increase its value. ↑
- Both Clean and maintain gutters — Clean gutters improve the home's appearance and prevent water damage to the siding and foundation. ↑
ⓘ Cost ranges are severity-bucket heuristics (US national rule-of-thumb). Get contractor quotes + a written scope before underwriting a rehab budget.
Schools (NCES district)
- District
- Rowland Unified
- NCES district ID
- 0633750
- Math proficiency
- 40% ▼ -1.00%
- Reading proficiency
- 62% ▲ 11.00%
- Median HH income
- $63,667
- Composite
- 44.83/100
- National rank
- #2733
- State rank
- #134 of 517 in CA
Livability — Rowland Heights
- Score
- 50/100
- State rank
- #1123
- US rank
- #25637
Category grades
Schools grade is shown separately in the Schools card above.
Census & demographics
- Census place
- Rowland Heights, CA
- County
- Los Angeles County · 9,444,647 people
- City population
- 42,463
- Metro
- Los Angeles-Long Beach-Anaheim, CA
- Population (ZIP)
- 42,463
- Household income
- $83,428
- Rent vs Own
- Severe rent burden
- 1440.0
Population outlook (Los Angeles County) Hauer SSP2
- Today (2025)
- 10,940,515 people
- By 2030
- 11,256,481 · +2.9%
- By 2040
- 11,729,929 · +7.2%
- By 2050
- 11,948,407 · +9.2%
- By 2075
- 11,818,114 · +8.0%
- By 2100
- 10,842,928 · -0.9%
Race, ethnicity, and origin ACS 2023
- Neighborhood character
- Majority Asian (59%)
- Race & ethnicity
- Asian 59% Hispanic / Latino 31% Two or more races 6% White 6% Black 1%
- Hispanic origin (detail)
- Mexican 25%
- Foreign-born
- 55% · China, Canada, South Korea
- Languages at home
- 25% English-only · Chinese 37% Spanish 22% Tagalog/Filipino 5%
Political lean MEDSL · Los Angeles
- 2024 margin
- Solid D (+32.9) · D 64.8% · R 31.9% · Other 3.3%
- 2008→2024 swing
- -7.4pp toward R · 2008: 40.4pp · 2024: 32.9pp
- All cycles
- 2024: D+32.9 2020: D+44.2 2016: D+48.0 2012: D+40.0 2008: D+40.4
Not yet ingested
- Civics
- —
Market trends
- HPI YoY
- ▼ -754.24%
- Current HPI
- 364.5923
- Rent YoY
- ▲ 10.27%
- Metro
- Los Angeles-Long Beach-Anaheim, CA
- State GDP YoY
- ▲ 3.21%
- F500 in state
- 116
Industry mix (Fortune 500 HQ in CA)
| Industry | F500 HQs | Revenue |
|---|---|---|
| Technology | 27 | $1,492B |
|
||
| Financial Services | 3 | $174B |
|
||
| Retail | 3 | $44B |
|
||
| Insurance | 3 | $26B |
|
||
| Media / Entertainment | 2 | $115B |
|
||
| Pharmaceuticals / Biotech | 2 | $62B |
|
||
Price history
+173.5% since first listed5 events — show timeline
- 2026-05-11 Listed $268,000 CRMLS
- 2026-04-27 Coming Soon $268,000 CRMLS
- 2017-08-01 Sold (MLS) $98,000 CRMLS
- 2017-06-14 Pending — CRMLS
- 2017-05-17 Listed $98,000 CRMLS
Cash-flow waterfall
monthlySold comps — $/sqft
last 12 mo · ≤1 miLoading sold comps…