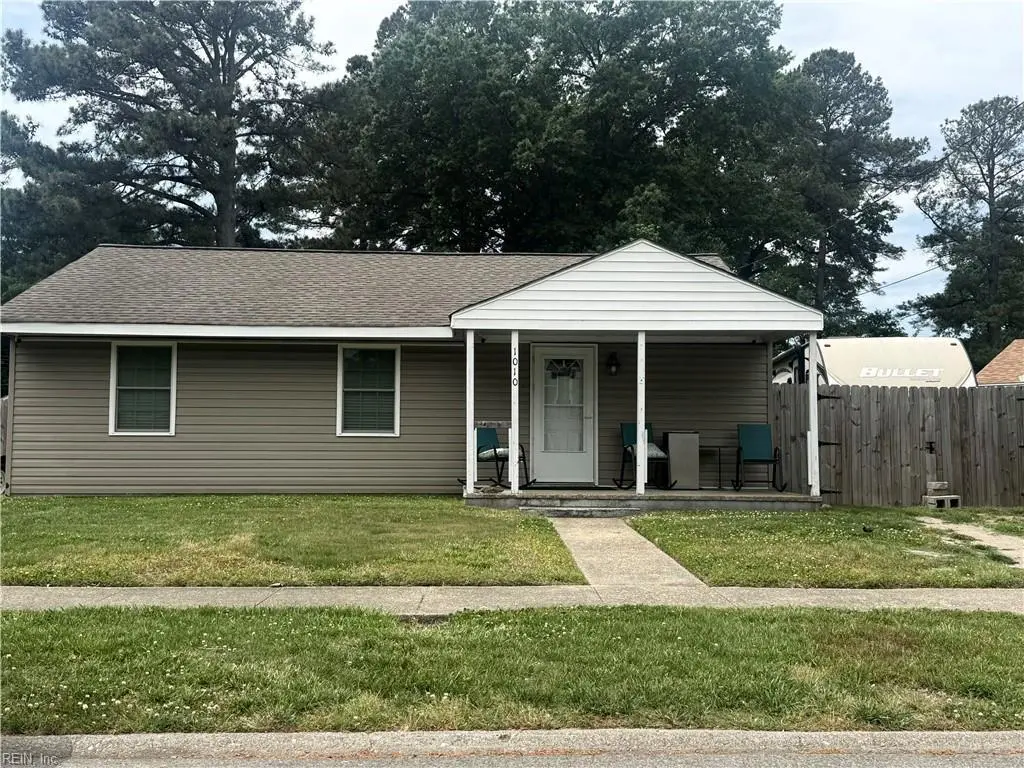
1010 Bowden Ave · Chesapeake, VA
Flood risk 2/10 · Minimal
- FEMA flood zone
- X (unshaded)
- Chance of flooding over 30 yrs
- 0.03%
- Est. flood insurance / yr
- $507 – $1,088
Fire risk 1/10 · Minimal
- Est. fire insurance / yr
- $666 – $1,236
Heat risk 9/10 · Severe
- Hot days now (above 106°F)
- 7 days/yr
- Hot days in 30 yrs
- 16 days/yr
Wind risk 8/10 · Major
- Chance of severe wind over 30 yrs
- 80.0%
Air-quality risk 5/10 · Moderate
- Unhealthy air days now
- 6 days/yr
- Unhealthy air days in 30 yrs
- 7 days/yr
Risk factors via First Street. Map © Google.
Why this score? — see what drove the D+ grade
The composite is a weighted blend of 9 inputs, each scored 0–100. Each bar is that input's sub-score; the figure is the points it added to the 100-point composite (weight × sub-score).
- Cash flow +14.1/30.0
- ARV discount +9.4/15.0
- Schools +5.8/10.0
- DSCR +4.3/10.0
- Rent growth +4.0/5.0
- Livability +3.5/5.0
- 1% rule +3.2/10.0
- Condition / age +2.5/5.0
- Appreciation +0.0/10.0
$260,000
🖨 Deal sheet (PDF) 📄 Offer letter ✓ Due diligence
Key facts
- Built 1953
- Listed 22 days
Property features AI
Finance
- HOA & community: No HOA fees reported
Exterior
- Parking: Off-street parking; Driveway parking spaces
- Utilities: City/County water; City/County sewer; Gas water heater; Electric power (standard)
- Home design: Detached ranch-style home; Single-story (1 story); Slab foundation; Simple ownership
- Construction: Vinyl exterior; Asphalt shingle roof; Slab foundation
- Exterior features: Vinyl siding; Asphalt shingle roof
Interior
- Kitchen: Dishwasher; Microwave; Gas range
- Bedrooms: At least one bedroom located on the first floor
- Flooring: Carpet; Laminate
- Bathrooms: One full bathroom
- Heating & cooling: Forced hot air heating; Central air conditioning
- Interior features: Carpet and laminate flooring; Bedroom and full bathroom on the first floor; 6 total rooms
- Laundry & utility: Washer hookup; Dryer hookup; Gas water heater
Neighborhood map
What this means for you Summary
Snapshot
- This is a 3-bed/1.0-bath single-family listed at $260k.
Deal economics
- At list price, monthly cash flow is $38 ($459/yr) — positive.
- The deal already cash-flows at list — no discount required.
- To meet the 1% rule (rent ≥ 1% of price), the offer needs to be $214k (17.6% below list).
- Recommended offer: $214k (17.6% below list) — sets the bar for 1% rule.
- Cap rate 6.5% vs local median 3.7% in Chesapeake — top-decile yield for the area; either an underpriced asset or a hidden risk that comps aren't pricing in. Stress-test before assuming the spread holds.
Location & tenants
- Location reads 70/100 on livability (#236 in VA) — a middle-class / working-renter tenant base. Strengths: employment A+, housing A+; Watch: crime C-, cost of living C-, amenities F.
- Chesapeake City Public School District (suburban): math 58% / reading 74% proficiency, ranked #31 of 131 in VA (top 24%) — acceptable for families but not a draw, mixed tenant base, ~2y average lease.
- Zoned schools: G.A. Treakle Elementary (math 47% / reading 56%, grade C-, #728 of 1,108 statewide, top 66%, 421 students, 93% FRL); Deep Creek Middle (math 30% / reading 64%, grade D+, #257 of 342 statewide, top 77%, 770 students, 43% FRL); Deep Creek High (math 70% / reading 82%, grade A-, #102 of 319 statewide, top 32%, 1,597 students, 49% FRL) — zoned schools average 62% FRL vs 28% district-wide (34 pts higher); higher-poverty schools than district average — tighter screening recommended.
- Market conditions: Rents rising fast (+6.1%/yr); 184 active listings in the ZIP; 8 comparable units currently listed for rent nearby; rentals at typical pace (median 26d on market — plan ~3-4 weeks tenant-placement turnaround); solid renter incomes; 597 units permitted in Chesapeake city in 2024 (0 in 5+ unit buildings).
Forward outlook
- Local home prices are declining (-3.0%/yr); year-one equity from $2k of loan paydown is wiped out by about $8k of value loss. Plan a longer hold.
- Chesapeake County population projected at +21% by 2050 — long-run rental-demand tailwind backs the buy-and-hold thesis.
Negotiation context
- It's been on market 22 days — a 2% lower offer ($256k) is reasonable based on typical stale-listing flexibility.
- Current owner paid $172k; list at $260k implies a 51% gain — meaningful room to come down on a strong offer.
Risks & watch-outs
- Watch-outs: built in 1953 — expect roof / HVAC / electrical / plumbing capex.
- Climate carrying-cost: severe wind risk, 80% chance of damaging wind over 30y; extreme-heat days projected 7→16/yr by 2055 (HVAC capex compounding) — expect insurance premiums to compound above CPI over the hold.
Questions for the listing agent
- Built in 1953 — when were the roof, HVAC, electrical panel, plumbing, and water heater last replaced?
- Is there a deadline driving the sale (1031 exchange, divorce, estate, relocation)? That informs how much negotiation room exists.
- Schools are A-rated — typically a magnet for longer-tenancy family renters. What's the average tenant stay here, and is there a school-zone premium baked into asking?
- The area grade is low — what's the realistic commute time and amenity access for the typical tenant pool here? Any planned neighborhood developments (good or bad) we should know about?
- What's the average days-on-market for RENTAL listings here right now (not sales)? A rising rental-DOM trend means longer vacancies and softer asking-rent achievability than the comps imply.
- What's the recent tenant-quality profile in this submarket — average credit score on applications, eviction rate, late-payment / NSF rate, and stable-employment percentage? A property-management company in the area should have these aggregated.
- How much new for-sale + rental construction is in the pipeline within 1–3 miles? Heavy new supply typically softens prices + rents 12–24 months out; constrained supply supports both.
Investment metrics
- 1% rule
- 0.82% ✗
- Cap rate
- 6.47%
- Cash-on-cash
- 0.63%
- DSCR
- 1.03
- GRM
- 10.1
CMA / ARV
- ARV (on-the-fly)
- $271,616
- Comps found
- 12
Show comp detail 12 sales within ~0.75 mi
| Address | Dist | Beds/Ba | Sqft | Sold | Price | $/sf | Match |
|---|---|---|---|---|---|---|---|
| 1010 Bowden Ave | 0.00mi | 3/1.0 | 1,061 (0%) | 1mo | $260,000 | $245 | 99 |
| 2309 Gilmerton Rd | 0.20mi | 3/1.0 | 1,090 (+3%) | 12mo | $250,000 | $229 | 76 |
| 2404 Livesay Rd | 0.12mi | 4/1.0 (+1) | 1,145 (+8%) | 5mo | $262,000 | $229 | 72 |
| 2501 Lofurno Rd | 0.31mi | 3/1.0 | 1,112 (+5%) | 12mo | $265,000 | $238 | 68 |
| 2213 Tennessee Dr | 0.51mi | 3/1.0 | 1,016 (-4%) | 2mo | $260,000 | $256 | 67 |
| 1040 George Washington Hwy | 0.37mi | 3/1.0 | 1,116 (+5%) | 8mo | $272,000 | $244 | 67 |
| 2060 Maywood St | 0.44mi | 2/1.0 (-1) | 1,019 (-4%) | 7mo | $285,000 | $280 | 62 |
| 2507 Sunset Dr | 0.31mi | 3/1.0 | 925 (-13%) | 3mo | $245,000 | $265 | 62 |
| 1006 White Pine Dr | 0.50mi | 3/1.0 | 1,002 (-6%) | 10mo | $249,900 | $249 | 59 |
| 923 Oklahoma Dr | 0.29mi | 3/2.0 | 1,176 (+11%) | 12mo | $305,000 | $259 | 55 |
| 902 Bounds Ave | 0.45mi | 3/1.0 | 925 (-13%) | 4mo | $267,900 | $290 | 54 |
| 933 Michael Dr | 0.67mi | 3/2.0 | 996 (-6%) | 1mo | $265,000 | $266 | 54 |
Match score weights: distance 35% · size 25% · config 20% · recency 20%. Top-matched comps best support the ARV.
Projected returns pro-forma
-3.0% appreciation · 6.13% rent growth · sell at horizon
- IRR
- -12.1%
- Equity multiple
- 0.55×
- Total profit
- $-32,793
- Equity at exit
- $38,767
- IRR
- 0.8%
- Equity multiple
- 1.07×
- Total profit
- $4,804
- Equity at exit
- $22,480
Cash invested: $72,800 (down + closing). Projections, not guarantees.
Landlord ↔ Tenant lean methodology
- Overall (STATE)
- 55 Moderately Landlord-Leaning
- State Virginia
- 55 Moderately Landlord-Leaning · D+2
- County
- — inherits STATE
- City
- — inherits STATE
ZIP-level market 23323
- Home prices YoY
- -21.8%
- Rents YoY
- 6.1%
- Active inventory
- 184
- Price-to-rent
- 10.1×
Monthly cashflow live
- Estimated rent
- $2,142 high interval (Pro) →
- Mortgage (P&I)
- −$1,363
- Tax from tax record
- −$182 /mo · $2,187/yr
- Insurance
- −$108
- HOA
- −$0
- Vacancy / Maint / Mgmt
- −$450
- Net cashflow
- $38
Break-even live
Sensitivity live
| Price | -10% $185 | -5% $112 | +0% $38 | +5% $-35 | +10% $-109 |
|---|---|---|---|---|---|
| Rent | -10% $-131 | -5% $-46 | +0% $38 | +5% $123 | +10% $207 |
| Rate | -1.0pp $169 | -0.5pp $104 | base $38 | +0.5pp $-29 | +1.0pp $-98 |
UW: 25.0% down · 7.5% · 30yr · 1.5% tax · 5.0% vac · 8.0% maint · 8.0% mgmt
Financing live
Cash to close
- Down payment
- $65,000
- Closing costs
- $7,800
- Reserves months
- —
- Total cash needed
- —
Loan-product check · same deal, 3 products live
Conventional
25% down · 7.5% · 30yr
- Down + closing
- —
- Monthly P&I
- —
- Monthly cashflow
- —
- DSCR
- —
- Eligible?
- —
Personal DTI + credit; lowest rate.
DSCR
20% down · 8.5% · 30yr
- Down + closing
- —
- Monthly P&I
- —
- Monthly cashflow
- —
- DSCR
- —
- Eligible?
- —
No personal income docs; deal must DSCR.
Hard money
10% down · 12.0% · 12mo
- Down + closing
- —
- Monthly P&I
- —
- Monthly cashflow
- —
- DSCR
- —
- Eligible?
- —
Short-term bridge; refi at stabilization.
Rent comps 8 comps
| Address | Beds | Baths | Sqft | Rent | $/sqft | DOM | Units | Dist |
|---|---|---|---|---|---|---|---|---|
| 908 Lake Village Dr Chesapeake, VA | 2.0–3.0 | 1.0 | 972 | $1,508 | $1.55 | 4d | 7 | 0.17mi |
| 2604 Townhouse Ln Chesapeake, VA | 1.0–3.0 | 1.5 | 1050 | $1,885 | $1.80 | 4d | 1 | 0.52mi |
| 1114 Woodland Terrace Dr Chesapeake, VA | 3.0 | 1.0 | 1223 | $2,000 | $1.64 | 25d | 1 | 0.57mi |
| 940 Willis St Chesapeake, VA | 3.0 | 2.0 | 1150 | $1,795 | $1.56 | 18d | 1 | 0.99mi |
| 846 Drawbridge Dr Chesapeake, VA | 3.0 | 2.0 | 1400 | $2,600 | $1.86 | 25d | 1 | 1.13mi |
| 622 Wooddale Ct Chesapeake, VA | 4.0 | 2.0 | 1475 | $2,450 | $1.66 | 25d | 1 | 1.14mi |
| 1724 Shell Rd Chesapeake, VA | 3.0 | 2.0 | 1000 | $1,800 | $1.80 | 25d | 1 | 1.27mi |
| 3208 Sir Meliot Dr Chesapeake, VA | 3.0 | 2.0 | 1400 | $2,295 | $1.64 | 25d | 1 | 1.28mi |
Listing history 5 events
-
2026-05-14status Under Contract
-
2026-04-22historical Active Under Contract
-
2026-04-21$260,000 Active
-
2006-11-02soldstatus $172,000
-
1996-09-30soldstatus $68,500
ⓘ Source: listings_history table (triggers on properties + properties_extension) + one-shot
backfill from property_details.listing_events for pre-trigger history.
Tax reassessment forecast VA · Resets to sale price
- Current annual tax
- $2,187 · $182/mo
- Projected year-2 tax
- $2,187 · $182/mo
- Expected delta
- $0/yr ($0/mo · 0.0%)
ⓘ Screening estimate from a state-policy table — verify with the county assessor before closing.
Climate risk First Street
- Flood 2/10 Low FEMA zone X (unshaded) · 3% chance over 30 yrs
- Wildfire 1/10 Low
- Heat 9/10 Extreme 7 d/yr ≥106°F today · 16 d/yr by 30 yrs out
- Wind 8/10 Severe 80% chance of damaging wind over 30 yrs
- Air quality 5/10 Major 6 unhealthy d/yr today · 7 by 30 yrs out
Nearby sold comps map
Loading sold comps map…
Walkable amenities ~0.75 mi
Loading nearby amenities…
Taxation est. · year 1
- Rental income
- $25,705
- − Mortgage interest
- −$14,564
- − Property taxes
- −$2,187
- − Insurance
- −$1,300
- − Repairs & maintenance
- −$2,056
- − Management
- −$2,056
- − Depreciation
- −$7,564
- Taxable loss
- −$4,022
- Est. tax savings @ 24.0%
- +$965
- After-tax cash flow
- $1,424/yr
For passive investors: Depreciation is non-cash, so a rental often shows a tax loss while cash-flowing — sheltering income. Rental losses are passive: they offset passive income freely, and up to $25,000/yr can offset ordinary (W-2) income if you actively participate and your MAGI is under $100k (phasing out to $0 by $150k); unused losses carry forward. On sale, claimed depreciation is recaptured at up to 25%, and gains may owe capital-gains tax (a 1031 exchange can defer both). Figures are a year-1 estimate at your 24.0% rate — not tax advice; consult a CPA.
Schools (NCES district)
- District
- Chesapeake City Public School District
- NCES district ID
- 5100810
- Math proficiency
- 58% ▼ -29.00%
- Reading proficiency
- 74% ▼ -7.00%
- Median HH income
- $69,356
- Composite
- 57.84/100
- National rank
- #1047
- State rank
- #31 of 131 in VA
Livability — Chesapeake
- Score
- 70/100
- State rank
- #236
- US rank
- #7942
Category grades
Schools grade is shown separately in the Schools card above.
Census & demographics
- Census place
- Chesapeake, VA
- County
- Chesapeake City · 253,091 people
- City population
- 253,091
- Metro
- Virginia Beach-Norfolk-Newport News, VA-NC
- Population (ZIP)
- 43,043
- Household income
- $108,730
- Rent vs Own
- Severe rent burden
- 699.0
Population outlook (Chesapeake County) Hauer SSP2
- Today (2025)
- 263,804 people
- By 2030
- 276,798 · +4.9%
- By 2040
- 299,906 · +13.7%
- By 2050
- 318,284 · +20.7%
- By 2075
- 362,137 · +37.3%
- By 2100
- 372,225 · +41.1%
Race, ethnicity, and origin ACS 2023
- Neighborhood character
- Diverse neighborhood (Simpson 0.62)
- Race & ethnicity
- White 54% Black 27% Two or more races 11% Hispanic / Latino 8% Asian 3%
- Hispanic origin (detail)
- Mexican 2% Puerto Rican 4%
- Common ancestry
- Italian 3% Romanian 2% Slovak 2%
- Foreign-born
- 5% · Canada, South Korea, Jamaica
- Languages at home
- 93% English-only · Spanish 4% Tagalog/Filipino 1% Other Indo-European 1%
Political lean MEDSL · Chesapeake
- 2024 margin
- Toss-up / Even · D 51.3% · R 47.5% · Other 1.2%
- 2008→2024 swing
- +2.5pp toward D · 2008: 1.3pp · 2024: 3.8pp
- All cycles
- 2024: D+3.8 2020: D+6.5 2016: R+1.3 2012: D+1.1 2008: D+1.3
Not yet ingested
- Civics
- —
Market trends
- HPI YoY
- ▼ -86.09%
- Current HPI
- 309.6925
- Rent YoY
- ▲ 6.13%
- Metro
- Virginia Beach-Norfolk-Newport News, VA-NC
- State GDP YoY
- ▲ 2.40%
- F500 in state
- 50
Industry mix (Fortune 500 HQ in VA)
| Industry | F500 HQs | Revenue |
|---|---|---|
| Aerospace / Defense | 4 | $236B |
|
||
| Technology / Defense | 3 | $32B |
|
||
| Financial Services | 2 | $176B |
|
||
| Utilities | 2 | $27B |
|
||
| Insurance | 2 | $25B |
|
||
| Technology | 2 | $15B |
|
||
Price history
+279.6% since first listed5 events — show timeline
- 2026-05-14 Pending — REINMLS
- 2026-04-22 Contingent — REINMLS
- 2026-04-21 Listed $260,000 REINMLS
- 2006-11-02 Sold (Public Records) $172,000 Public Records
- 1996-09-30 Sold (Public Records) $68,500 Public Records
Property tax history
+3.7%/yrLatest (2025): $2,187 · +4.4% YoY. Source: county tax records.
Cash-flow waterfall
monthlySold comps — $/sqft
last 12 mo · ≤1 miLoading sold comps…