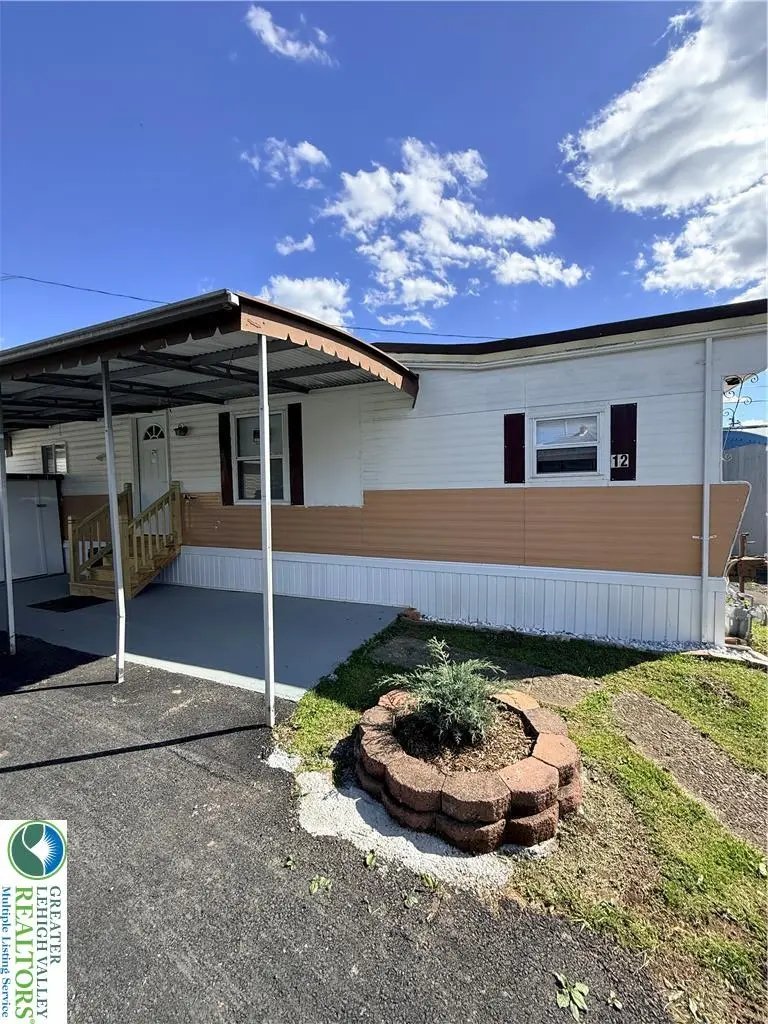
5200 Freemansburg Ave #12 · Bethlehem, PA
Flood risk 1/10 · Minimal
- FEMA flood zone
- X (unshaded)
- Chance of flooding over 30 yrs
- 0.0%
- Est. flood insurance / yr
- $507 – $1,088
Fire risk 1/10 · Minimal
- Est. fire insurance / yr
- $511 – $949
Heat risk 5/10 · Moderate
- Hot days now (above 98°F)
- 7 days/yr
- Hot days in 30 yrs
- 15 days/yr
Wind risk 4/10 · Minor
- Chance of severe wind over 30 yrs
- 21.0%
Air-quality risk 3/10 · Minor
- Unhealthy air days now
- 3 days/yr
- Unhealthy air days in 30 yrs
- 4 days/yr
Risk factors via First Street. Map © Google.
Why this score? — see what drove the C grade
The composite is a weighted blend of 9 inputs, each scored 0–100. Each bar is that input's sub-score; the figure is the points it added to the 100-point composite (weight × sub-score).
- Cash flow +18.5/30.0
- 1% rule +10.0/10.0
- ARV discount +7.5/15.0
- DSCR +5.8/10.0
- Rent growth +5.0/5.0
- Livability +4.1/5.0
- Schools +3.5/10.0
- Condition / age +2.5/5.0
- Appreciation +0.0/10.0
$110,000
🖨 Deal sheet 📄 Offer letter ✓ Due diligence
Listing remarks
Discover unparalleled living in this charming residence, perfectly situated to offer both convenience and tranquility. Completely renovated and updated to modern styling, this residence provides contemporary comforts. Nestled in Bethlehem Township, this address provides a desirable location with a strong sense of community that is close to major highways and the area's rich history and modern conveniences - making it an ideal place to call home! The strategic placement offers effortless connections to key destinations while preserving a peaceful residential feel. This property is more than just a home; it is a gateway to a fulfilling lifestyle in a coveted setting.
Key facts
- Parking
- Built 1968
- Listed 35 days
Property features AI
Finance
- Other: Above-grade finished area approximately 800
- HOA & community: Association fee $850 monthly
Exterior
- Parking: Carport; Driveway; Off-street parking; Parking pad; On-street parking
- Utilities: Community/Coop water; Community/Coop sewer; Electric water heater
- Home design: Single-story property; Unknown year built; Metal roof
- Construction: Metal roof; Crawl space foundation
- Exterior features: Mobile home on the property; Mhdr - Medium High Density zoning
Interior
- Kitchen: Gas range; Gas oven; Microwave; Refrigerator; Eat-in kitchen
- Bedrooms: Bedroom on the first floor (approx. 11 x 10)
- Bathrooms: Two full bathrooms; Full bath on the first floor (approx. 5 x 8)
- Heating & cooling: Baseboard heating; Central air conditioning
- Interior features: Eat-in kitchen; Crawl space
- Laundry & utility: Stacked laundry; Electric water heater
Neighborhood map
What this means for you Summary
Snapshot
- This is a 2-bed/2.0-bath manufactured listed at $110k.
Deal economics
- At list price, monthly cash flow is $106 ($1k/yr) — positive.
- The deal already cash-flows at list — no discount required.
- Meets the 1% rule at list price ($2k rent vs $110k).
- Recommended offer: $107k (3.0% below list) — sets the bar for market timing.
- Cap rate 7.4% vs local median 4.3% in Bethlehem — top-decile yield for the area; either an underpriced asset or a hidden risk that comps aren't pricing in. Stress-test before assuming the spread holds.
Location & tenants
- Location reads 82/100 on livability (#138 in PA, #1,122 nationally) — a professional / high-income tenant draw. Strengths: amenities A+, cost of living A+, housing A+; Watch: commute F.
- Bethlehem Area SD (urban): math 31% / reading 49% proficiency, ranked #342 of 539 in PA (top 64%) — families likely to look elsewhere, expect single-tenant / working-renter base with shorter leases.
- Market conditions: Rents rising fast (+11.2%/yr); 163 active listings in the ZIP; 3 comparable units currently listed for rent nearby; rentals at typical pace (median 23d on market — plan ~3-4 weeks tenant-placement turnaround); high-income renter base; 567 units permitted in Northampton County in 2024 (151 in 5+ unit buildings).
Forward outlook
- Local home prices are declining (-3.0%/yr); year-one equity from $761 of loan paydown is wiped out by about $3k of value loss. Plan a longer hold.
- At projected returns (-3.0% appreciation + 8.0% rent growth), your $31k cash investment doubles in ~8 years — after that, you're playing with house money.
Negotiation context
- It's been on market 35 days — a 3% lower offer ($107k) is reasonable based on typical stale-listing flexibility.
Risks & watch-outs
- Watch-outs: HOA is 42% of rent.
- Climate carrying-cost: extreme-heat days projected 7→15/yr by 2055 (HVAC capex compounding) — expect insurance premiums to compound above CPI over the hold.
Questions for the listing agent
- It's been on market 35 days. Have you received any prior offers? Is the seller open to a 3% concession, seller financing, or rate buy-down credit?
- Built in 1968 — when were the roof, HVAC, electrical panel, plumbing, and water heater last replaced?
- What does the HOA fee cover, when was the last increase, and are there any pending special assessments or reserve-fund shortfalls?
- Is there a deadline driving the sale (1031 exchange, divorce, estate, relocation)? That informs how much negotiation room exists.
- Schools are B-rated — typically a magnet for longer-tenancy family renters. What's the average tenant stay here, and is there a school-zone premium baked into asking?
- What's the average days-on-market for RENTAL listings here right now (not sales)? A rising rental-DOM trend means longer vacancies and softer asking-rent achievability than the comps imply.
- What's the recent tenant-quality profile in this submarket — average credit score on applications, eviction rate, late-payment / NSF rate, and stable-employment percentage? A property-management company in the area should have these aggregated.
- How much new for-sale + rental construction is in the pipeline within 1–3 miles? Heavy new supply typically softens prices + rents 12–24 months out; constrained supply supports both.
Investment metrics
- 1% rule
- 1.86% ✓
- Cap rate
- 7.44%
- Cash-on-cash
- 4.11%
- DSCR
- 1.18
- GRM
- 4.5
CMA / ARV
- ARV (median comp)
- $61,328
- List price
- $110,000
- Delta
- 79.36%
- Verdict
- OVERPRICED
- Comps
- 6 within 1.0 mi
Show comp detail 1 sale within ~0.75 mi
| Address | Dist | Beds/Ba | Sqft | Sold | Price | $/sf | Match |
|---|---|---|---|---|---|---|---|
| 5200 Freemansburg Ave #26 | 0.00mi | 2/1.0 | 760 (-5%) | 21mo | $15,000 | $20 | 70 |
Match score weights: distance 35% · size 25% · config 20% · recency 20%. Top-matched comps best support the ARV.
Projected returns pro-forma
-3.0% appreciation · 8.0% rent growth · sell at horizon
- IRR
- 0.1%
- Equity multiple
- 1.01×
- Total profit
- $176
- Equity at exit
- $16,401
- IRR
- 16.9%
- Equity multiple
- 2.94×
- Total profit
- $59,897
- Equity at exit
- $9,511
Cash invested: $30,800 (down + closing). Projections, not guarantees.
Landlord ↔ Tenant lean methodology
- Overall (STATE)
- 62 Landlord-Friendly
- State Pennsylvania
- 62 Landlord-Friendly · EVEN
- County
- — inherits STATE
- City
- — inherits STATE
ZIP-level market 18045
- Rents YoY
- 11.2%
- Active inventory
- 163
- Price-to-rent
- 4.5×
Monthly cashflow live
- Estimated rent
- $2,041 medium interval (Pro) →
- Mortgage (P&I)
- −$577
- Tax from tax record
- −$34 /mo · $411/yr
- Insurance
- −$46
- HOA
- −$850
- Vacancy / Maint / Mgmt
- −$429
- Net cashflow
- $106
Break-even live
UW: 25.0% down · 7.5% · 30yr · 1.5% tax · 5.0% vac · 8.0% maint · 8.0% mgmt
Financing live
Cash to close
- Down payment
- $27,500
- Closing costs
- $3,300
- Reserves months
- —
- Total cash needed
- —
Loan-product check · same deal, 3 products live
Conventional
25% down · 7.5% · 30yr
- Down + closing
- —
- Monthly P&I
- —
- Monthly cashflow
- —
- DSCR
- —
- Eligible?
- —
Personal DTI + credit; lowest rate.
DSCR
20% down · 8.5% · 30yr
- Down + closing
- —
- Monthly P&I
- —
- Monthly cashflow
- —
- DSCR
- —
- Eligible?
- —
No personal income docs; deal must DSCR.
Hard money
10% down · 12.0% · 12mo
- Down + closing
- —
- Monthly P&I
- —
- Monthly cashflow
- —
- DSCR
- —
- Eligible?
- —
Short-term bridge; refi at stabilization.
Rent comps 3 comps
| Address | Beds | Baths | Sqft | Rent | $/sqft | DOM | Units | Dist |
|---|---|---|---|---|---|---|---|---|
| 1800 Merlot Dr Unit B Easton, PA | 2.0 | 1.0 | 1068 | $2,250 | $2.11 | 43d | 1 | 0.53mi |
| 6000 Birchwood Cir Apt 610 Bethlehem, PA | 1.0 | 1.0 | 788 | $1,860 | $2.36 | 21d | 1 | 0.88mi |
| 4705 Pheasant Run Ct Apt 1 Bethlehem, PA | 1.0 | 1.0 | 630 | $1,600 | $2.54 | 23d | 1 | 1.04mi |
HOA detail
- Monthly dues
- $850 · $10,200/yr
Listing history 15 events
-
2026-06-18days on market $110,000 Active 35 DOM
-
2026-06-17days on market $110,000 Active 34 DOM
-
2026-06-16days on market $110,000 Active 33 DOM
-
2026-06-15days on market $110,000 Active 32 DOM
-
2026-06-14days on market $110,000 Active 30 DOM
-
2026-06-10days on market $110,000 Active 27 DOM
-
2026-06-09days on market $110,000 Active 26 DOM
-
2026-06-08days on market $110,000 Active 25 DOM
-
2026-06-07days on market $110,000 Active 24 DOM
-
2026-06-03days on market $110,000 Active 20 DOM
-
2026-06-02days on market $110,000 Active 19 DOM
-
2026-06-01days on market $110,000 Active 18 DOM
-
2026-05-31days on market $110,000 Active 17 DOM
-
2026-05-31days on market $110,000 Active 16 DOM
-
2026-05-14$110,000 Active 673-char remark
ⓘ Source: listings_history table (triggers on properties + properties_extension) + one-shot
backfill from property_details.listing_events for pre-trigger history.
Tax reassessment forecast PA · Partial reset (capped growth)
- Current annual tax
- $411 · $34/mo
- Projected year-2 tax
- $1,074 · $90/mo
- Expected delta
- +$664/yr (+$55/mo · 161.6%)
ⓘ Screening estimate from a state-policy table — verify with the county assessor before closing.
Climate risk First Street
- Flood 1/10 Low FEMA zone X (unshaded) · 0% chance over 30 yrs
- Wildfire 1/10 Low
- Heat 5/10 Major 7 d/yr ≥98°F today · 15 d/yr by 30 yrs out
- Wind 4/10 Moderate 21% chance of damaging wind over 30 yrs
- Air quality 3/10 Moderate 3 unhealthy d/yr today · 4 by 30 yrs out
Nearby sold comps map
Loading sold comps map…
Walkable amenities ~0.75 mi
Loading nearby amenities…
Taxation est. · year 1
- Rental income
- $24,493
- − Mortgage interest
- −$6,162
- − Property taxes
- −$411
- − Insurance
- −$550
- − Repairs & maintenance
- −$1,959
- − Management
- −$1,959
- − HOA
- −$10,200
- − Depreciation
- −$3,200
- Taxable income
- $52
- Est. tax owed @ 24.0%
- −$13
- After-tax cash flow
- $1,254/yr
For passive investors: Depreciation is non-cash, so a rental often shows a tax loss while cash-flowing — sheltering income. Rental losses are passive: they offset passive income freely, and up to $25,000/yr can offset ordinary (W-2) income if you actively participate and your MAGI is under $100k (phasing out to $0 by $150k); unused losses carry forward. On sale, claimed depreciation is recaptured at up to 25%, and gains may owe capital-gains tax (a 1031 exchange can defer both). Figures are a year-1 estimate at your 24.0% rate — not tax advice; consult a CPA.
Schools (NCES district)
- District
- Bethlehem Area SD
- NCES district ID
- 4203570
- Math proficiency
- 31% ▼ -2.00%
- Reading proficiency
- 49% ▼ -6.00%
- Median HH income
- $55,124
- Composite
- 34.92/100
- National rank
- #5068
- State rank
- #342 of 539 in PA
Livability — Bethlehem
- Score
- 82/100
- State rank
- #138
- US rank
- #1122
Category grades
Schools grade is shown separately in the Schools card above.
Census & demographics
- County
- Northampton County · 236,814 people
- City population
- 129,661
- Metro
- Allentown-Bethlehem-Easton, PA-NJ
- Population (ZIP)
- 30,429
- Household income
- $114,528
- Rent vs Own
- Severe rent burden
- 537.0
Population outlook (Northampton County) Hauer SSP2
- Today (2025)
- 312,227 people
- By 2030
- 314,769 · +0.8%
- By 2040
- 316,914 · +1.5%
- By 2050
- 318,037 · +1.9%
- By 2075
- 334,003 · +7.0%
- By 2100
- 344,696 · +10.4%
Race, ethnicity, and origin ACS 2023
- Neighborhood character
- Predominantly White (73%)
- Race & ethnicity
- White 73% Hispanic / Latino 14% Two or more races 9% Asian 5% Black 4%
- Hispanic origin (detail)
- Puerto Rican 4% Dominican 1%
- Common ancestry
- Romanian 5% Polish 2% Italian 2%
- Foreign-born
- 10% · Canada, Jamaica, Vietnam
- Languages at home
- 84% English-only · Spanish 9% Other Indo-European 3% Russian/Polish/Slavic 1%
Political lean MEDSL · Northampton
- 2024 margin
- Toss-up / Even · D 48.6% · R 50.4%
- 2008→2024 swing
- -14.1pp toward R · 2008: 12.3pp · 2024: -1.8pp
- All cycles
- 2024: R+1.8 2020: D+0.7 2016: R+3.8 2012: D+4.6 2008: D+12.3
Not yet ingested
- Civics
- —
Market trends
- HPI YoY
- ▼ -297.92%
- Current HPI
- 201.5716
- Rent YoY
- ▲ 11.15%
- Metro
- Allentown-Bethlehem-Easton, PA-NJ
- State GDP YoY
- ▲ 1.68%
- F500 in state
- 34
Industry mix (Fortune 500 HQ in PA)
| Industry | F500 HQs | Revenue |
|---|---|---|
| Healthcare | 2 | $309B |
|
||
| Insurance | 2 | $27B |
|
||
| Telecommunications / Media | 1 | $124B |
|
||
| Industrial Distribution | 1 | $22B |
|
||
| Financial Services | 1 | $20B |
|
||
| Chemicals / Materials | 1 | $18B |
|
||
Price history
1 event — show timeline
- 2026-05-14 Listed $110,000 GLVRMLS
Property tax history
+1.6%/yrLatest (2026): $411 · +4.2% YoY. Source: county tax records.
Cash-flow waterfall
monthlySold comps — $/sqft
last 12 mo · ≤1 miLoading sold comps…