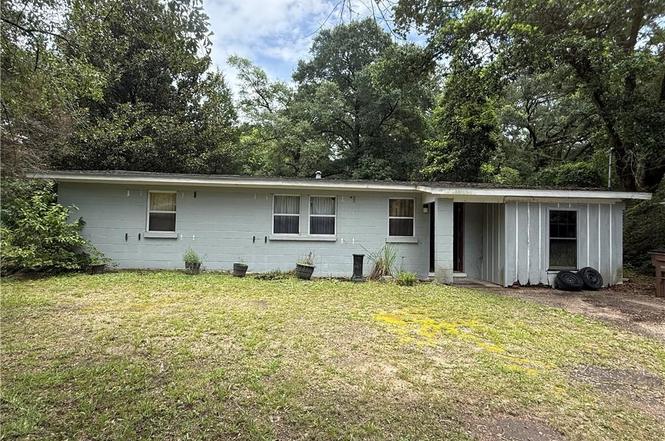
2213 Vivian Dr · Mobile, AL
Flood risk 6/10 · Moderate
- FEMA flood zone
- X (unshaded)
- Chance of flooding over 30 yrs
- 0.57%
- Est. flood insurance / yr
- $507 – $1,088
Fire risk 3/10 · Minor
- Est. fire insurance / yr
- $916 – $1,700
Heat risk 9/10 · Severe
- Hot days now (above 105°F)
- 7 days/yr
- Hot days in 30 yrs
- 20 days/yr
Wind risk 9/10 · Severe
- Chance of severe wind over 30 yrs
- 99.0%
Air-quality risk 1/10 · Minimal
- Unhealthy air days now
- 0 days/yr
- Unhealthy air days in 30 yrs
- 0 days/yr
Risk factors via First Street. Map © Google.
Why this score? — see what drove the B- grade
The composite is a weighted blend of 9 inputs, each scored 0–100. Each bar is that input's sub-score; the figure is the points it added to the 100-point composite (weight × sub-score).
- Cash flow +30.0/30.0
- 1% rule +10.0/10.0
- DSCR +10.0/10.0
- ARV discount +7.5/15.0
- Livability +3.8/5.0
- Rent growth +2.6/5.0
- Condition / age +2.5/5.0
- Schools +2.3/10.0
- Appreciation +0.0/10.0
$71,700
🖨 Deal sheet 📄 Offer letter ✓ Due diligence
Listing remarks
This fixer upper is ready for some TLC! A must see off of Cottage Hill with easy access to shopping and restaurants! Subject to the approval of probate court - sold AS IS WHERE IS - Cash buyers only!
Key facts
- 0.46 acre lot
- Built 1965
Property features AI
Finance
- Other: Located in the Terrace Hills subdivision; Address: 2213 Vivian Dr, Mobile AL 36693; Directions available
Exterior
- Parking: Driveway
- Utilities: Electricity available (110 volts); Sewer: other
- Home design: Single family residence; Residential property; Views
- Construction: Built in 1965; Block and other construction materials; Slab foundation; Composition roof
- Exterior features: No notable exterior features listed; No fencing
Interior
- Kitchen: Electric range; Refrigerator; White cabinets
- Bedrooms: 3 bedrooms
- Flooring: Other
- Bathrooms: 1 full bathroom
- Heating & cooling: Central heating; Central air conditioning
- Interior features: Other
Neighborhood map
What this means for you Summary
Snapshot
- This is a 3-bed/1.0-bath single-family listed at $72k.
Deal economics
- At list price, monthly cash flow is $813 ($10k/yr) — positive.
- The deal already cash-flows at list — no discount required.
- Meets the 1% rule at list price ($2k rent vs $72k).
- Cap rate 19.9% vs local median 4.9% in Mobile — top-decile yield for the area; either an underpriced asset or a hidden risk that comps aren't pricing in. Stress-test before assuming the spread holds.
Location & tenants
- Location reads 75/100 on livability (#20 in AL, #4,262 nationally) — a middle-class / working-renter tenant base. Strengths: commute A+, cost of living A+, housing A+; Watch: crime F, employment D-.
- Mobile County (urban): math 15% / reading 39% proficiency, ranked #81 of 129 in AL (top 63%) — low school quality limits family demand, transient renter base, plan for 1-2y turnover; 67% free/reduced lunch — lower-income household profile, screen leases tightly.
- Zoned schools: Olive J Dodge Elementary School (math 6% / reading 35%, grade F, #453 of 627 statewide, top 72%, 875 students, 67% FRL); Wp Davidson High School (math 36% / reading 41%, grade F, #37 of 305 statewide, top 12%, 1,535 students, 61% FRL) — zoned schools at 64% FRL track the district average.
- Market conditions: Rents flat; 142 active listings in the ZIP; 26 comparable units currently listed for rent nearby; rentals lingering (median 44d on market — plan ~5-8 weeks vacancy on turnover, expect pricing pressure); 50% of comp listings sitting > 30 days — soft ceiling on asking rent; 1,678 units permitted in Mobile County in 2024 (264 in 5+ unit buildings).
Forward outlook
- Local home prices are declining (-3.0%/yr); year-one equity from $496 of loan paydown is wiped out by about $2k of value loss. Plan a longer hold.
- Mobile County population projected to shrink 8% by 2050 — rents likely to lag national; underwrite the cash flow, not the appreciation.
- At projected returns (-3.0% appreciation + 0.2% rent growth), your $20k cash investment doubles in ~3 years — after that, you're playing with house money.
Negotiation context
- Only 1 days on market — expect competitive offers; lowballing is unlikely to land.
Risks & watch-outs
- Climate carrying-cost: major flood risk; severe wind risk, 99% chance of damaging wind over 30y; extreme-heat days projected 7→20/yr by 2055 (HVAC capex compounding) — expect insurance premiums to compound above CPI over the hold.
Questions for the listing agent
- Built in 1965 — when were the roof, HVAC, electrical panel, plumbing, and water heater last replaced?
- Is there a deadline driving the sale (1031 exchange, divorce, estate, relocation)? That informs how much negotiation room exists.
- Schools are D-rated, which usually means shorter tenancies and higher turnover. Who's the typical renter profile here, and what's been the actual vacancy rate?
- Crime grade is F in this area — have there been break-ins, vandalism, or insurance claims at this property in the last 3 years? What carrier currently insures it and at what premium?
- What's the average days-on-market for RENTAL listings here right now (not sales)? A rising rental-DOM trend means longer vacancies and softer asking-rent achievability than the comps imply.
- What's the recent tenant-quality profile in this submarket — average credit score on applications, eviction rate, late-payment / NSF rate, and stable-employment percentage? A property-management company in the area should have these aggregated.
- How much new for-sale + rental construction is in the pipeline within 1–3 miles? Heavy new supply typically softens prices + rents 12–24 months out; constrained supply supports both.
Investment metrics
- 1% rule
- 2.18% ✓
- Cap rate
- 19.89%
- Cash-on-cash
- 48.57%
- DSCR
- 3.16
- GRM
- 3.8
CMA / ARV
- ARV (on-the-fly)
- $163,056
- Comps found
- 12
Show comp detail 12 sales within ~0.75 mi
| Address | Dist | Beds/Ba | Sqft | Sold | Price | $/sf | Match |
|---|---|---|---|---|---|---|---|
| 5032 Brookfield Dr N | 0.39mi | 3/1.5 | 1,336 (+6%) | 1mo | $185,000 | $138 | 69 |
| 1005 Oakland Dr | 0.34mi | 2/1.0 (-1) | 1,188 (-6%) | 0mo | $145,000 | $122 | 69 |
| 717 Kasserine Pass | 0.41mi | 3/1.5 | 1,377 (+9%) | 1mo | $178,000 | $129 | 63 |
| 713 Raines Dr | 0.58mi | 3/1.0 | 1,347 (+7%) | 2mo | $73,000 | $54 | 60 |
| 2359 Demetropolis Rd | 0.50mi | 4/1.5 (+1) | 1,344 (+6%) | 2mo | $78,000 | $58 | 58 |
| 5612 Bentley Ln | 0.40mi | 3/2.0 | 1,420 (+12%) | 1mo | $169,000 | $119 | 56 |
| 5609 Bentley Ct | 0.44mi | 3/2.0 | 1,440 (+14%) | 1mo | $193,000 | $134 | 52 |
| 4259 Raines Dr | 0.67mi | 3/1.5 | 1,394 (+10%) | 1mo | $184,000 | $132 | 49 |
| 661 Raines Dr | 0.68mi | 3/1.5 | 1,134 (-10%) | 1mo | $122,000 | $108 | 48 |
| 4275 Raines Dr | 0.66mi | 3/1.0 | 1,107 (-12%) | 2mo | $172,000 | $155 | 47 |
| 2612 East Rd | 0.70mi | 3/2.0 | 1,384 (+10%) | 0mo | $124,000 | $90 | 47 |
| 1919 Wildwood Pl | 0.63mi | 3/2.0 | 1,104 (-13%) | 1mo | $199,000 | $180 | 44 |
Match score weights: distance 35% · size 25% · config 20% · recency 20%. Top-matched comps best support the ARV.
Projected returns pro-forma
-3.0% appreciation · 0.24% rent growth · sell at horizon
- IRR
- 43.1%
- Equity multiple
- 2.79×
- Total profit
- $35,887
- Equity at exit
- $10,691
- IRR
- 47.9%
- Equity multiple
- 5.05×
- Total profit
- $81,392
- Equity at exit
- $6,199
Cash invested: $20,076 (down + closing). Projections, not guarantees.
Landlord ↔ Tenant lean methodology
- Overall (STATE)
- 90 Strongly Landlord-Friendly
- State Alabama
- 90 Strongly Landlord-Friendly · R+15
- County
- — inherits STATE
- City
- — inherits STATE
ZIP-level market 36693
- Home prices YoY
- -28.1%
- Rents YoY
- 0.2%
- Active inventory
- 142
- Price-to-rent
- 3.8×
Monthly cashflow live
- Estimated rent
- $1,564 high interval (Pro) →
- Mortgage (P&I)
- −$376
- Tax from tax record
- −$17 /mo · $209/yr
- Insurance
- −$30
- HOA
- −$0
- Vacancy / Maint / Mgmt
- −$329
- Net cashflow
- $813
Break-even live
UW: 25.0% down · 7.5% · 30yr · 1.5% tax · 5.0% vac · 8.0% maint · 8.0% mgmt
Financing live
Cash to close
- Down payment
- $17,925
- Closing costs
- $2,151
- Reserves months
- —
- Total cash needed
- —
Loan-product check · same deal, 3 products live
Conventional
25% down · 7.5% · 30yr
- Down + closing
- —
- Monthly P&I
- —
- Monthly cashflow
- —
- DSCR
- —
- Eligible?
- —
Personal DTI + credit; lowest rate.
DSCR
20% down · 8.5% · 30yr
- Down + closing
- —
- Monthly P&I
- —
- Monthly cashflow
- —
- DSCR
- —
- Eligible?
- —
No personal income docs; deal must DSCR.
Hard money
10% down · 12.0% · 12mo
- Down + closing
- —
- Monthly P&I
- —
- Monthly cashflow
- —
- DSCR
- —
- Eligible?
- —
Short-term bridge; refi at stabilization.
Rent comps 26 comps
| Address | Beds | Baths | Sqft | Rent | $/sqft | DOM | Units | Dist |
|---|---|---|---|---|---|---|---|---|
| 4242 Marmora Dr Mobile, AL | 3.0 | 1.5 | 1053 | $1,500 | $1.42 | 43d | 1 | 0.56mi |
| 713 Raines Dr Mobile, AL | 4.0 | 2.0 | 1600 | $1,858 | $1.16 | 13d | 1 | 0.59mi |
| 4213 Malibar Dr Mobile, AL | 3.0 | 1.0 | 1100 | $1,458 | $1.33 | 20d | 1 | 0.65mi |
| 4306 Via Alta Dr Mobile, AL | 3.0 | 2.0 | 1640 | $1,600 | $0.98 | 43d | 1 | 0.76mi |
| 2754 Seaton Ct Mobile, AL | 3.0 | 2.5 | 1640 | $1,950 | $1.19 | 13d | 1 | 0.77mi |
| 654 Ynestra Dr Mobile, AL | 3.0 | 1.5 | 1134 | $1,300 | $1.15 | 13d | 1 | 0.78mi |
| 4077 Lancewood Dr S Mobile, AL | 4.0 | 1.0 | 1283 | $1,600 | $1.25 | 43d | 1 | 0.79mi |
| 4861 Woodcliff Dr N Mobile, AL | 3.0 | 2.0 | 1610 | $1,300 | $0.81 | 43d | 1 | 0.81mi |
| 1724 Rustic Wood Ct Mobile, AL | 3.0 | 2.0 | 1607 | $1,850 | $1.15 | 43d | 1 | 0.86mi |
| 4161 Rebecca Rd Mobile, AL | 3.0 | 1.0 | 1214 | $1,500 | $1.24 | 13d | 1 | 0.86mi |
| 552 Tamworth Ct Mobile, AL | 3.0 | 1.0 | 1100 | $1,450 | $1.32 | 43d | 1 | 0.97mi |
| 550 Tamworth Ct Mobile, AL | 3.0 | 1.0 | 1000 | $1,295 | $1.29 | 43d | 1 | 0.99mi |
| 2316 Woodland Rd Mobile, AL | 4.0 | 2.0 | 1560 | $2,200 | $1.41 | 13d | 1 | 1.05mi |
| 5901 Ole Mill Rd Mobile, AL | 3.0 | 2.0 | 1600 | $1,900 | $1.19 | 43d | 1 | 1.07mi |
| 5155 Ridgedale Rd Mobile, AL | 3.0 | 1.5 | 1263 | $1,400 | $1.11 | 13d | 1 | 1.12mi |
| 1651 Knollwood Dr Mobile, AL | 1.0–2.0 | 1.0–2.0 | 835 | $1,247 | $1.49 | 13d | 16 | 1.19mi |
| 4057 Gaylark Rd N Mobile, AL | 3.0 | 1.0 | 1080 | $1,275 | $1.18 | 20d | 1 | 1.23mi |
| 4273 Vega Dr Mobile, AL | 3.0 | 1.5 | 1300 | $1,600 | $1.23 | 43d | 1 | 1.26mi |
| 4118 Seabreeze Rd N Mobile, AL | 3.0 | 1.0 | 1088 | $1,100 | $1.01 | 43d | 1 | 1.31mi |
| 4017 Cottage Hill Rd #69 Mobile, AL | 3.0 | 2.5 | 1616 | $1,495 | $0.93 | 20d | 1 | 1.32mi |
| 4017 Cottage Hill Rd Mobile, AL | 3.0 | 2.5 | 1616 | $1,495 | $0.93 | 43d | 1 | 1.32mi |
| 833 S University Blvd Mobile, AL | 1.0–2.0 | 1.0–2.0 | 855 | $1,190 | $1.39 | 13d | 12 | 1.35mi |
| 3993 Cottage Hill Rd Mobile, AL | 2.0 | 1.5 | 1150 | $895 | $0.78 | 43d | 1 | 1.39mi |
| 6260 Sarasota Dr Mobile, AL | 3.0 | 1.0 | 1090 | $1,200 | $1.10 | 43d | 1 | 1.46mi |
| 701 S University Blvd Mobile, AL | 2.0 | 1.0 | 692 | $1,093 | $1.58 | 20d | 10 | 1.47mi |
| 5900 Grelot Rd Mobile, AL | 2.0 | 2.0–2.5 | 1259 | $1,600 | $1.27 | 13d | 2 | 1.49mi |
Listing history 3 events
-
2026-06-18status $71,700 Pending 1 DOM
-
2026-06-16remarks 202-char remark
-
2026-06-16$71,700 Active 1 DOM
ⓘ Source: listings_history table (triggers on properties + properties_extension) + one-shot
backfill from property_details.listing_events for pre-trigger history.
Tax reassessment forecast AL · Resets to sale price
- Current annual tax
- $209 · $17/mo
- Projected year-2 tax
- $294 · $24/mo
- Expected delta
- +$85/yr (+$7/mo · 40.9%)
ⓘ Screening estimate from a state-policy table — verify with the county assessor before closing.
Climate risk First Street
- Flood 6/10 Major FEMA zone X (unshaded) · 57% chance over 30 yrs
- Wildfire 3/10 Moderate
- Heat 9/10 Extreme 7 d/yr ≥105°F today · 20 d/yr by 30 yrs out
- Wind 9/10 Extreme 99% chance of damaging wind over 30 yrs
- Air quality 1/10 Low 0 unhealthy d/yr today · 0 by 30 yrs out
Nearby sold comps map
Loading sold comps map…
Walkable amenities ~0.75 mi
Loading nearby amenities…
Taxation est. · year 1
- Rental income
- $18,772
- − Mortgage interest
- −$4,016
- − Property taxes
- −$209
- − Insurance
- −$358
- − Repairs & maintenance
- −$1,502
- − Management
- −$1,502
- − Depreciation
- −$2,086
- Taxable income
- $9,100
- Est. tax owed @ 24.0%
- −$2,184
- After-tax cash flow
- $7,567/yr
For passive investors: Depreciation is non-cash, so a rental often shows a tax loss while cash-flowing — sheltering income. Rental losses are passive: they offset passive income freely, and up to $25,000/yr can offset ordinary (W-2) income if you actively participate and your MAGI is under $100k (phasing out to $0 by $150k); unused losses carry forward. On sale, claimed depreciation is recaptured at up to 25%, and gains may owe capital-gains tax (a 1031 exchange can defer both). Figures are a year-1 estimate at your 24.0% rate — not tax advice; consult a CPA.
Schools (NCES district)
- District
- Mobile County
- NCES district ID
- 0102370
- Math proficiency
- 15% ▼ -28.00%
- Reading proficiency
- 39% ▬ 0.00%
- Median HH income
- $42,455
- Composite
- 22.9/100
- National rank
- #8002
- State rank
- #81 of 129 in AL
Livability — Mobile
- Score
- 75/100
- State rank
- #20
- US rank
- #4262
Category grades
Schools grade is shown separately in the Schools card above.
Census & demographics
- Census place
- Mobile, AL
- County
- Mobile County · 246,577 people
- City population
- 205,729
- Metro
- Mobile, AL
- Population (ZIP)
- 18,726
- Household income
- $68,933
- Rent vs Own
- Severe rent burden
- 498.0
Population outlook (Mobile County) Hauer SSP2
- Today (2025)
- 415,303 people
- By 2030
- 411,755 · -0.9%
- By 2040
- 399,670 · -3.8%
- By 2050
- 382,616 · -7.9%
- By 2075
- 337,353 · -18.8%
- By 2100
- 283,391 · -31.8%
Race, ethnicity, and origin ACS 2023
- Neighborhood character
- Predominantly White (65%)
- Race & ethnicity
- White 65% Black 23% Hispanic / Latino 5% Asian 4% Two or more races 4%
- Common ancestry
- Slovak 4% Italian 3% Serbian 2%
- Foreign-born
- 8% · Canada, Vietnam
- Languages at home
- 90% English-only · Spanish 4% Tagalog/Filipino 2% Vietnamese 1%
Political lean MEDSL · Mobile
- 2024 margin
- R (+16.4) · D 41.3% · R 57.7%
- 2008→2024 swing
- -7.7pp toward R · 2008: -8.7pp · 2024: -16.4pp
- All cycles
- 2024: R+16.4 2020: R+11.9 2016: R+13.9 2012: R+9.3 2008: R+8.7
Not yet ingested
- Civics
- —
Market trends
- HPI YoY
- ▼ -71.22%
- Current HPI
- 182.6406
- Rent YoY
- ▲ 0.24%
- Metro
- Mobile, AL
- State GDP YoY
- ▲ 2.94%
- F500 in state
- 4
Industry mix (Fortune 500 HQ in AL)
| Industry | F500 HQs | Revenue |
|---|---|---|
| Financial Services | 1 | $8B |
|
||
| Healthcare | 1 | $5B |
|
||
Price history
+8.6% since first listed2 events — show timeline
- 2026-06-16 Listed $71,700 GCMLS AL
- 2008-08-19 Sold (Public Records) $66,000 Public Records
Property tax history
-8.1%/yrLatest (2019): $209 · +0.0% YoY. Source: county tax records.
Cash-flow waterfall
monthlySold comps — $/sqft
last 12 mo · ≤1 miLoading sold comps…