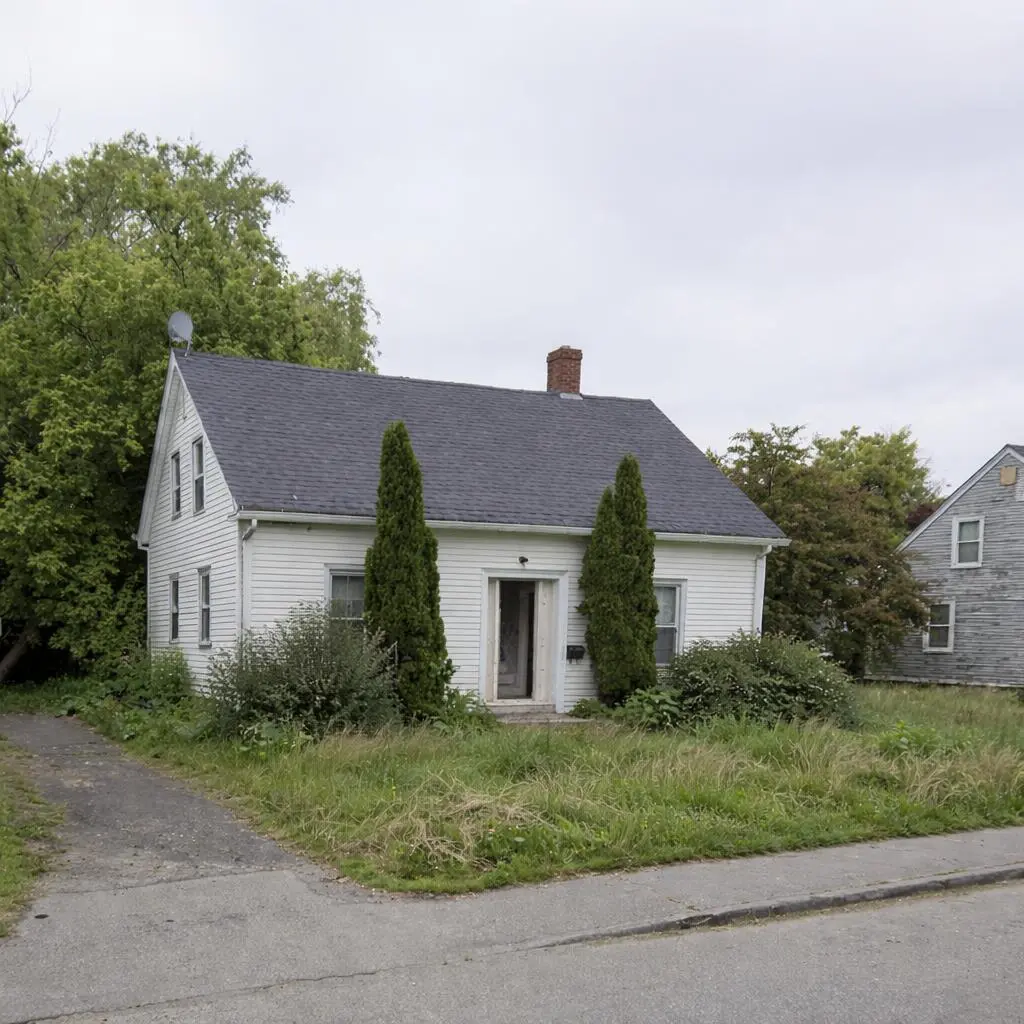
11 Pleasant St · Rockland, ME
Flood risk 1/10 · Minimal
- FEMA flood zone
- X (unshaded)
- Chance of flooding over 30 yrs
- 0.0%
- Est. flood insurance / yr
- $473 – $860
Fire risk 1/10 · Minimal
- Est. fire insurance / yr
- $669 – $1,243
Heat risk 5/10 · Moderate
- Hot days now (above 85°F)
- 8 days/yr
- Hot days in 30 yrs
- 19 days/yr
Wind risk 6/10 · Moderate
- Chance of severe wind over 30 yrs
- 73.0%
Air-quality risk 1/10 · Minimal
- Unhealthy air days now
- 0 days/yr
- Unhealthy air days in 30 yrs
- 0 days/yr
Risk factors via First Street. Map © Google.
Why this score? — see what drove the C grade
The composite is a weighted blend of 9 inputs, each scored 0–100. Each bar is that input's sub-score; the figure is the points it added to the 100-point composite (weight × sub-score).
- Cash flow +18.0/30.0
- ARV discount +15.0/15.0
- Schools +6.8/10.0
- DSCR +5.6/10.0
- 1% rule +5.5/10.0
- Livability +3.1/5.0
- Rent growth +2.5/5.0
- Condition / age +2.5/5.0
- Appreciation +0.0/10.0
$225,000
🖨 Deal sheet 📄 Offer letter ✓ Due diligence
Listing remarks MLS
Value-add opportunity with water views in Rockland. 11 Pleasant Street offers a rare chance for investors, developers, or business-minded buyers to unlock the full potential of a large intown property in a highly desirable coastal market. This 4+ bedroom home features an office, living room, large open kitchen, and oversized bathroom, with the space and layout to support a range of future possibilities. Being sold as is, the property needs work, but the upside is compelling. Location opens the door for buyers to investigate residential, business, rental, live/work, or mixed-use potential depending on their vision and local requirements. With a large lot, water views, and a prime in-town location, this is the kind of property where improvements and creativity could pay off.
Key facts
- Water views
- Large lot
- 9,583 sq ft lot
Tags
Neighborhood map
What this means for you Summary
Snapshot
- This is a 4-bed/1.0-bath single-family listed at $225k.
Deal economics
- At list price, monthly cash flow is $194 ($2k/yr) — positive.
- The deal already cash-flows at list — no discount required.
- Meets the 1% rule at list price ($2k rent vs $225k).
- Recommended offer: $218k (3.0% below list) — sets the bar for market timing.
- Cap rate 7.3% vs local median 3.3% in Rockland — top-decile yield for the area; either an underpriced asset or a hidden risk that comps aren't pricing in. Stress-test before assuming the spread holds.
Location & tenants
- Location reads 62/100 on livability (#116 in ME) — a middle-class / working-renter tenant base. Strengths: cost of living A+, housing A+, crime A-; Watch: schools D, amenities F, commute F.
- RSU 13 (town): math 77% / reading 85% proficiency, ranked #84 of 112 in ME (top 75%) — strong family-tenant draw, lease renewals of 3-5y typical.
- Market conditions: 71 active listings in the ZIP; 1 comparable units currently listed for rent nearby; 160 units permitted in Knox County in 2024 (58 in 5+ unit buildings).
- At $2,358/mo this rent would consume 50% of the median local household income ($57k/yr) (locally 279% of renters already pay >50% of income on rent) — very limited rent-growth headroom before tenants either downsize or default.
Forward outlook
- Local home prices are declining (-3.0%/yr); year-one equity from $2k of loan paydown is wiped out by about $7k of value loss. Plan a longer hold.
- Knox County population projected at -14% by 2050 — secular population decline; favor cash flow + early exit over multi-decade hold.
Negotiation context
- It's been on market 48 days — a 3% lower offer ($218k) is reasonable based on typical stale-listing flexibility.
Risks & watch-outs
- Watch-outs: built in 1898 — expect roof / HVAC / electrical / plumbing capex.
- Climate carrying-cost: major wind risk, 73% chance of damaging wind over 30y; extreme-heat days projected 8→19/yr by 2055 (HVAC capex compounding) — expect insurance premiums to compound above CPI over the hold.
Questions for the listing agent
- It's been on market 48 days. Have you received any prior offers? Is the seller open to a 3% concession, seller financing, or rate buy-down credit?
- Built in 1898 — when were the roof, HVAC, electrical panel, plumbing, and water heater last replaced?
- Is there a deadline driving the sale (1031 exchange, divorce, estate, relocation)? That informs how much negotiation room exists.
- Schools are D-rated, which usually means shorter tenancies and higher turnover. Who's the typical renter profile here, and what's been the actual vacancy rate?
- What's the average days-on-market for RENTAL listings here right now (not sales)? A rising rental-DOM trend means longer vacancies and softer asking-rent achievability than the comps imply.
- What's the recent tenant-quality profile in this submarket — average credit score on applications, eviction rate, late-payment / NSF rate, and stable-employment percentage? A property-management company in the area should have these aggregated.
- How much new for-sale + rental construction is in the pipeline within 1–3 miles? Heavy new supply typically softens prices + rents 12–24 months out; constrained supply supports both.
Investment metrics
- 1% rule
- 1.05% ✓
- Cap rate
- 7.33%
- Cash-on-cash
- 3.69%
- DSCR
- 1.16
- GRM
- 8.0
CMA / ARV
- ARV (median comp)
- $336,731
- List price
- $225,000
- Delta
- -33.18%
- Verdict
- UNDERPRICED
- Comps
- 20 within 1.0 mi
Show comp detail 12 sales within ~0.75 mi
| Address | Dist | Beds/Ba | Sqft | Sold | Price | $/sf | Match |
|---|---|---|---|---|---|---|---|
| 27 State St | 0.09mi | 3/1.0 (-1) | 1,220 (-1%) | 8mo | $415,000 | $340 | 83 |
| 56 Thomaston St | 0.51mi | 3/2.0 (-1) | 1,224 (-0%) | 2mo | $345,000 | $282 | 65 |
| 105 Broadway | 0.38mi | 3/1.5 (-1) | 1,264 (+3%) | 16mo | $315,000 | $249 | 57 |
| 20 Lisle St | 0.33mi | 3/1.0 (-1) | 1,323 (+8%) | 14mo | $285,000 | $215 | 55 |
| 117 Summer St | 0.65mi | 3/2.0 (-1) | 1,204 (-2%) | 4mo | $365,000 | $303 | 54 |
| 131 Limerock St | 0.47mi | 3/2.0 (-1) | 1,200 (-2%) | 15mo | $375,000 | $313 | 53 |
| 297 Broadway | 0.69mi | 3/1.5 (-1) | 1,228 (0%) | 10mo | $360,000 | $293 | 52 |
| 34 Thomaston St | 0.46mi | 3/1.0 (-1) | 1,133 (-8%) | 16mo | $100,000 | $88 | 48 |
| 150 Limerock St | 0.49mi | 3/2.0 (-1) | 1,275 (+4%) | 22mo | $480,000 | $376 | 43 |
| 288 Broadway | 0.67mi | 3/2.0 (-1) | 1,305 (+6%) | 10mo | $325,000 | $249 | 41 |
| 41 Granite St | 0.53mi | 3/2.0 (-1) | 1,324 (+8%) | 23mo | $468,000 | $353 | 34 |
| 20 Harborside Ter | 0.74mi | 3/2.0 (-1) | 1,350 (+10%) | 10mo | $537,600 | $398 | 32 |
Match score weights: distance 35% · size 25% · config 20% · recency 20%. Top-matched comps best support the ARV.
Projected returns pro-forma
-3.0% appreciation · 3.0% rent growth · sell at horizon
- IRR
- -10.5%
- Equity multiple
- 0.62×
- Total profit
- $-24,012
- Equity at exit
- $33,548
- IRR
- -1.1%
- Equity multiple
- 0.93×
- Total profit
- $-4,587
- Equity at exit
- $19,454
Cash invested: $63,000 (down + closing). Projections, not guarantees.
Landlord ↔ Tenant lean methodology
- Overall (STATE)
- 41 Moderately Tenant-Leaning
- State Maine
- 41 Moderately Tenant-Leaning · D+2
- County
- — inherits STATE
- City
- — inherits STATE
ZIP-level market 04841
- Home prices YoY
- -17.8%
- Active inventory
- 71
- Price-to-rent
- 8.0×
Monthly cashflow live
- Estimated rent
- $2,358 medium interval (Pro) →
- Mortgage (P&I)
- −$1,180
- Tax from tax record
- −$396 /mo · $4,747/yr
- Insurance
- −$94
- HOA
- −$0
- Vacancy / Maint / Mgmt
- −$495
- Net cashflow
- $194
Break-even live
UW: 25.0% down · 7.5% · 30yr · 1.5% tax · 5.0% vac · 8.0% maint · 8.0% mgmt
Financing live
Cash to close
- Down payment
- $56,250
- Closing costs
- $6,750
- Reserves months
- —
- Total cash needed
- —
Loan-product check · same deal, 3 products live
Conventional
25% down · 7.5% · 30yr
- Down + closing
- —
- Monthly P&I
- —
- Monthly cashflow
- —
- DSCR
- —
- Eligible?
- —
Personal DTI + credit; lowest rate.
DSCR
20% down · 8.5% · 30yr
- Down + closing
- —
- Monthly P&I
- —
- Monthly cashflow
- —
- DSCR
- —
- Eligible?
- —
No personal income docs; deal must DSCR.
Hard money
10% down · 12.0% · 12mo
- Down + closing
- —
- Monthly P&I
- —
- Monthly cashflow
- —
- DSCR
- —
- Eligible?
- —
Short-term bridge; refi at stabilization.
Rent comps 1 comps
| Address | Beds | Baths | Sqft | Rent | $/sqft | DOM | Units | Dist |
|---|---|---|---|---|---|---|---|---|
| 154 N Main St Unit 2 Rockland, ME | 3.0 | 1.0 | 850 | $2,000 | $2.35 | 19d | 1 | 1.15mi |
Listing history 1 events
-
2026-04-10$250,000 Active 783-char remark
Show marketing remark (783 chars)
Value-add opportunity with water views in Rockland. 11 Pleasant Street offers a rare chance for investors, developers, or business-minded buyers to unlock the full potential of a large intown property in a highly desirable coastal market. This 4+ bedroom home features an office, living room, large open kitchen, and oversized bathroom, with the space and layout to support a range of future possibilities. Being sold as is, the property needs work, but the upside is compelling. Location opens the door for buyers to investigate residential, business, rental, live/work, or mixed-use potential depending on their vision and local requirements. With a large lot, water views, and a prime in-town location, this is the kind of property where improvements and creativity could pay off.
ⓘ Source: listings_history table (triggers on properties + properties_extension) + one-shot
backfill from property_details.listing_events for pre-trigger history.
Tax reassessment forecast ME · Partial reset (capped growth)
- Current annual tax
- $4,747 · $396/mo
- Projected year-2 tax
- $4,747 · $396/mo
- Expected delta
- $0/yr ($0/mo · 0.0%)
ⓘ Screening estimate from a state-policy table — verify with the county assessor before closing.
Climate risk First Street
- Flood 1/10 Low FEMA zone X (unshaded) · 0% chance over 30 yrs
- Wildfire 1/10 Low
- Heat 5/10 Major 8 d/yr ≥85°F today · 19 d/yr by 30 yrs out
- Wind 6/10 Major 73% chance of damaging wind over 30 yrs
- Air quality 1/10 Low 0 unhealthy d/yr today · 0 by 30 yrs out
Nearby sold comps map
Loading sold comps map…
Walkable amenities ~0.75 mi
Loading nearby amenities…
Taxation est. · year 1
- Rental income
- $28,299
- − Mortgage interest
- −$12,603
- − Property taxes
- −$4,747
- − Insurance
- −$1,125
- − Repairs & maintenance
- −$2,264
- − Management
- −$2,264
- − Depreciation
- −$6,545
- Taxable loss
- −$1,250
- Est. tax savings @ 24.0%
- +$300
- After-tax cash flow
- $2,625/yr
For passive investors: Depreciation is non-cash, so a rental often shows a tax loss while cash-flowing — sheltering income. Rental losses are passive: they offset passive income freely, and up to $25,000/yr can offset ordinary (W-2) income if you actively participate and your MAGI is under $100k (phasing out to $0 by $150k); unused losses carry forward. On sale, claimed depreciation is recaptured at up to 25%, and gains may owe capital-gains tax (a 1031 exchange can defer both). Figures are a year-1 estimate at your 24.0% rate — not tax advice; consult a CPA.
Schools (NCES district)
- District
- RSU 13
- NCES district ID
- 2314787
- Math proficiency
- 77% ▲ 51.00%
- Reading proficiency
- 85% ▲ 36.00%
- Median HH income
- $43,177
- Composite
- 67.81/100
- National rank
- #363
- State rank
- #84 of 112 in ME
Livability — Rockland
- Score
- 62/100
- State rank
- #116
- US rank
- #16831
Category grades
Schools grade is shown separately in the Schools card above.
Census & demographics
- Census place
- Rockland, ME
- County
- Knox County · 7,035 people
- City population
- 7,035
- Metro
- nan
- Population (ZIP)
- 7,035
- Household income
- $56,533
- Rent vs Own
- Severe rent burden
- 279.0
Population outlook (Knox County) Hauer SSP2
- Today (2025)
- 39,304 people
- By 2030
- 38,497 · -2.1%
- By 2040
- 36,090 · -8.2%
- By 2050
- 33,681 · -14.3%
- By 2075
- 29,934 · -23.8%
- By 2100
- 24,633 · -37.3%
Race, ethnicity, and origin ACS 2023
- Neighborhood character
- Predominantly White (97%)
- Race & ethnicity
- White 97% Two or more races 3%
- Common ancestry
- Slovak 12% Serbian 8% Lithuanian 5%
- Foreign-born
- 1% · Canada
- Languages at home
- 97% English-only · French/Haitian/Cajun 2%
Political lean MEDSL · Knox
- 2024 margin
- D (+18.6) · D 58.2% · R 39.6% · Other 2.1%
- 2008→2024 swing
- -2.8pp toward R · 2008: 21.4pp · 2024: 18.6pp
- All cycles
- 2024: D+18.6 2020: D+19.9 2016: D+14.3 2012: D+22.6 2008: D+21.4
Not yet ingested
- Civics
- —
Market trends
- HPI YoY
- ▼ -73.90%
- Current HPI
- 341.7862
- Rent YoY
- —
- Metro
- nan
- State GDP YoY
- —
- F500 in state
- 0
Price history
1 event — show timeline
- 2026-04-10 Listed $250,000 MREIS
Property tax history
+6.0%/yrLatest (2025): $4,747 · +40.8% YoY. Source: county tax records.
Cash-flow waterfall
monthlySold comps — $/sqft
last 12 mo · ≤1 miLoading sold comps…