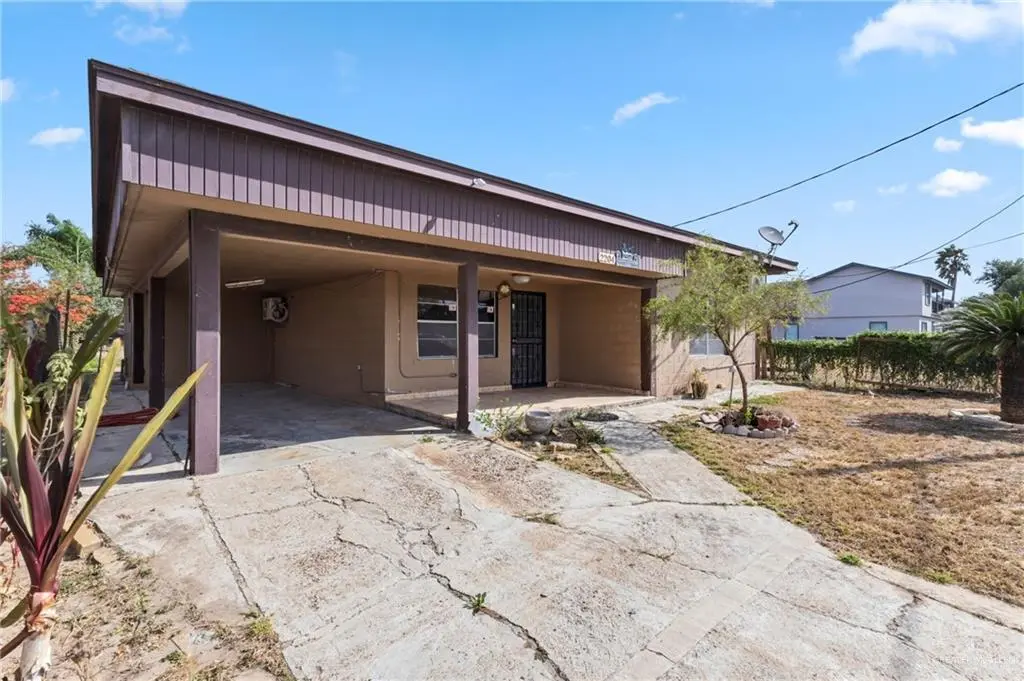
2204 Newport Ave · McAllen, TX
Flood risk 1/10 · Minimal
- FEMA flood zone
- X
- Chance of flooding over 30 yrs
- 0.0%
- Est. flood insurance / yr
- $507 – $1,088
Fire risk 1/10 · Minimal
- Est. fire insurance / yr
- $1,222 – $2,270
Heat risk 9/10 · Severe
- Hot days now (above 111°F)
- 7 days/yr
- Hot days in 30 yrs
- 23 days/yr
Wind risk 8/10 · Major
- Chance of severe wind over 30 yrs
- 99.0%
Air-quality risk 3/10 · Minor
- Unhealthy air days now
- 1 days/yr
- Unhealthy air days in 30 yrs
- 4 days/yr
Risk factors via First Street. Map © Google.
Why this score? — see what drove the C grade
The composite is a weighted blend of 9 inputs, each scored 0–100. Each bar is that input's sub-score; the figure is the points it added to the 100-point composite (weight × sub-score).
- Cash flow +18.3/30.0
- ARV discount +14.0/15.0
- DSCR +5.7/10.0
- 1% rule +5.4/10.0
- Livability +3.8/5.0
- Schools +3.3/10.0
- Rent growth +2.9/5.0
- Condition / age +2.5/5.0
- Appreciation +0.0/10.0
$127,000
🖨 Deal sheet (PDF) 📄 Offer letter ✓ Due diligence
Listing remarks MLS
Investor Opportunity in Prime McAllen Location! Conveniently located just off the Expressway and 23rd Street, this property offers exceptional potential for investors looking for their next project. Built with durable cinderblock exterior walls, the home provides a solid structure and long-lasting construction — the perfect foundation for a renovation or rental investment. The property features a 3-bedroom, 1-bathroom layout, a covered porch area, and a storage shed in the backyard. Sitting on a generously sized lot in a highly desirable area, there is plenty of space and opportunity to increase value. While the home does need updating, its prime location, strong construction, and lot size make it an excellent candidate for a fix-and-flip, long-term rental, or value-add investment.
Key facts
- Generously sized lot
- Covered porch area
- Storage shed
Tags
Neighborhood map
What this means for you Summary
Snapshot
- This is a 3-bed/2.0-bath single-family listed at $127k.
Deal economics
- At list price, monthly cash flow is $115 ($1k/yr) — positive.
- The deal already cash-flows at list — no discount required.
- Meets the 1% rule at list price ($1k rent vs $127k).
- Recommended offer: $116k (9.0% below list) — sets the bar for market timing.
- Cap rate 7.4% vs local median 3.7% in McAllen — top-decile yield for the area; either an underpriced asset or a hidden risk that comps aren't pricing in. Stress-test before assuming the spread holds.
Location & tenants
- Location reads 76/100 on livability (#119 in TX, #3,771 nationally) — a middle-class / working-renter tenant base. Strengths: cost of living A+, housing A+, health & safety A+; Watch: employment D, amenities F, commute F.
- Mcallen ISD (urban): math 34% / reading 45% proficiency, ranked #440 of 826 in TX (top 53%) — families likely to look elsewhere, expect single-tenant / working-renter base with shorter leases.
- Zoned schools: Thigpen-Zavala El (math 27% / reading 17%, grade F, #3,333 of 4,322 statewide, top 80%, 494 students, 94% FRL); Travis Middle (math 16% / reading 28%, grade F, #1,360 of 1,662 statewide, top 83%, 516 students, 96% FRL); Mcallen H S (math 30% / reading 57%, grade F, #704 of 1,632 statewide, top 43%, 2,133 students, 63% FRL) — zoned schools average 84% FRL vs 50% district-wide (34 pts higher); higher-poverty schools than district average — tighter screening recommended.
- Market conditions: Rents rising (+1.8%/yr); 390 active listings in the ZIP; 26 comparable units currently listed for rent nearby; rentals lingering (median 46d on market — plan ~5-8 weeks vacancy on turnover, expect pricing pressure); 69% of comp listings sitting > 30 days — soft ceiling on asking rent; 7,378 units permitted in Hidalgo County in 2024 (641 in 5+ unit buildings).
- This rent runs 33% of the median local income ($48k/yr) — at the standard rent-burdened threshold; future hikes will face affordability resistance.
Forward outlook
- Local home prices are declining (-3.0%/yr); year-one equity from $878 of loan paydown is wiped out by about $4k of value loss. Plan a longer hold.
- Hidalgo County population projected at +28% by 2050 — long-run rental-demand tailwind backs the buy-and-hold thesis.
Negotiation context
- It's been on market 92 days — a 9% lower offer ($116k) is reasonable based on typical stale-listing flexibility.
- 3 sale attempts with the ask held roughly flat each time — persistent listings suggest the price (not the market) is what's stuck; bring a comps-based counter.
Risks & watch-outs
- Climate carrying-cost: severe wind risk, 99% chance of damaging wind over 30y; extreme-heat days projected 7→23/yr by 2055 (HVAC capex compounding) — expect insurance premiums to compound above CPI over the hold.
Questions for the listing agent
- It's been on market 92 days. Have you received any prior offers? Is the seller open to a 9% concession, seller financing, or rate buy-down credit?
- Why hasn't it sold? Are there any deal-killer items the seller is aware of (foundation, flood, title, zoning, code violations)?
- Is there a deadline driving the sale (1031 exchange, divorce, estate, relocation)? That informs how much negotiation room exists.
- Schools are B-rated — typically a magnet for longer-tenancy family renters. What's the average tenant stay here, and is there a school-zone premium baked into asking?
- What's the average days-on-market for RENTAL listings here right now (not sales)? A rising rental-DOM trend means longer vacancies and softer asking-rent achievability than the comps imply.
- What's the recent tenant-quality profile in this submarket — average credit score on applications, eviction rate, late-payment / NSF rate, and stable-employment percentage? A property-management company in the area should have these aggregated.
- How much new for-sale + rental construction is in the pipeline within 1–3 miles? Heavy new supply typically softens prices + rents 12–24 months out; constrained supply supports both.
Investment metrics
- 1% rule
- 1.04% ✓
- Cap rate
- 7.38%
- Cash-on-cash
- 3.89%
- DSCR
- 1.17
- GRM
- 8.0
CMA / ARV
- ARV (median comp)
- $148,363
- List price
- $127,000
- Delta
- -14.40%
- Verdict
- UNDERPRICED
- Comps
- 20 within 1.0 mi
Show comp detail 12 sales within ~0.75 mi
| Address | Dist | Beds/Ba | Sqft | Sold | Price | $/sf | Match |
|---|---|---|---|---|---|---|---|
| 809 S 22nd St | 0.27mi | 3/2.0 | 1,160 (-4%) | 16mo | $98,500 | $85 | 67 |
| 2417 Lindberg Ave | 0.17mi | 3/2.0 | 1,378 (+14%) | 12mo | $209,000 | $152 | 58 |
| 2512 Dallas Ave | 0.63mi | 3/2.0 | 1,185 (-2%) | 12mo | $150,000 | $127 | 58 |
| 812 S 20th St | 0.34mi | 2/1.0 (-1) | 1,150 (-5%) | 14mo | $72,000 | $63 | 56 |
| 821 S 16th St | 0.56mi | 3/2.0 | 1,312 (+9%) | 5mo | $235,000 | $179 | 56 |
| 709 S 27 1/2 St | 0.55mi | 3/2.0 | 1,148 (-5%) | 13mo | $209,700 | $183 | 56 |
| 1702 Oakland Ave | 0.42mi | 3/2.0 | 1,118 (-7%) | 16mo | $163,000 | $146 | 55 |
| 916 S 17 1/2 St | 0.58mi | 3/2.0 | 1,152 (-5%) | 13mo | $160,000 | $139 | 54 |
| 2213 Galveston Ave | 0.36mi | 2/2.0 (-1) | 1,091 (-10%) | 10mo | $125,000 | $115 | 54 |
| 2720 Tyler Ave | 0.68mi | 3/2.0 | 1,264 (+5%) | 13mo | $179,000 | $142 | 50 |
| 2628 Richmond Ave | 0.46mi | 3/2.0 | 1,369 (+13%) | 14mo | $204,900 | $150 | 45 |
| 909 S 17 1/2 St | 0.58mi | 3/2.0 | 1,080 (-10%) | 14mo | $99,900 | $93 | 44 |
Match score weights: distance 35% · size 25% · config 20% · recency 20%. Top-matched comps best support the ARV.
Projected returns pro-forma
-3.0% appreciation · 1.78% rent growth · sell at horizon
- IRR
- -11.6%
- Equity multiple
- 0.58×
- Total profit
- $-14,787
- Equity at exit
- $18,936
- IRR
- -4.3%
- Equity multiple
- 0.73×
- Total profit
- $-9,620
- Equity at exit
- $10,981
Cash invested: $35,560 (down + closing). Projections, not guarantees.
Landlord ↔ Tenant lean methodology
- Overall (STATE)
- 87 Strongly Landlord-Friendly
- State Texas
- 87 Strongly Landlord-Friendly · R+5
- County
- — inherits STATE
- City
- — inherits STATE
ZIP-level market 78501
- Home prices YoY
- -23.3%
- Rents YoY
- 1.8%
- Active inventory
- 390
- Price-to-rent
- 8.0×
Monthly cashflow live
- Estimated rent
- $1,317 high interval (Pro) →
- Mortgage (P&I)
- −$666
- Tax from tax record
- −$207 /mo · $2,479/yr
- Insurance
- −$53
- HOA
- −$0
- Vacancy / Maint / Mgmt
- −$277
- Net cashflow
- $115
Break-even live
Sensitivity live
| Price | -10% $187 | -5% $151 | +0% $115 | +5% $79 | +10% $43 |
|---|---|---|---|---|---|
| Rent | -10% $11 | -5% $63 | +0% $115 | +5% $167 | +10% $219 |
| Rate | -1.0pp $179 | -0.5pp $148 | base $115 | +0.5pp $82 | +1.0pp $49 |
UW: 25.0% down · 7.5% · 30yr · 1.5% tax · 5.0% vac · 8.0% maint · 8.0% mgmt
Financing live
Cash to close
- Down payment
- $31,750
- Closing costs
- $3,810
- Reserves months
- —
- Total cash needed
- —
Loan-product check · same deal, 3 products live
Conventional
25% down · 7.5% · 30yr
- Down + closing
- —
- Monthly P&I
- —
- Monthly cashflow
- —
- DSCR
- —
- Eligible?
- —
Personal DTI + credit; lowest rate.
DSCR
20% down · 8.5% · 30yr
- Down + closing
- —
- Monthly P&I
- —
- Monthly cashflow
- —
- DSCR
- —
- Eligible?
- —
No personal income docs; deal must DSCR.
Hard money
10% down · 12.0% · 12mo
- Down + closing
- —
- Monthly P&I
- —
- Monthly cashflow
- —
- DSCR
- —
- Eligible?
- —
Short-term bridge; refi at stabilization.
Rent comps 26 comps
| Address | Beds | Baths | Sqft | Rent | $/sqft | DOM | Units | Dist |
|---|---|---|---|---|---|---|---|---|
| 2114 Galveston Ave W Unit 3 McAllen, TX | 3.0 | 2.5 | 1064 | $1,350 | $1.27 | 45d | 1 | 0.38mi |
| 2108 Galveston Ave W Unit 4 McAllen, TX | 3.0 | 2.5 | 1064 | $1,500 | $1.41 | 45d | 1 | 0.38mi |
| 2108 Galveston Ave W Unit 5 McAllen, TX | 3.0 | 2.5 | 1064 | $1,350 | $1.27 | 45d | 1 | 0.38mi |
| 813 S Bicentennial Blvd McAllen, TX | 3.0 | 2.5 | 1429 | $2,000 | $1.40 | 45d | 1 | 0.42mi |
| 1515 S 16th St McAllen, TX | 2.0 | 1.0 | 1050 | $975 | $0.93 | 45d | 1 | 0.56mi |
| 1515 W Houston Ave McAllen, TX | 2.0 | 1.0 | 1050 | $1,800 | $1.71 | 45d | 1 | 0.56mi |
| 1510 Ithaca Ave #2 McAllen, TX | 2.0 | 1.5 | 998 | $1,000 | $1.00 | 25d | 1 | 0.56mi |
| 1700 Toronto Ave McAllen, TX | 3.0 | 2.0 | 1500 | $1,750 | $1.17 | 45d | 1 | 0.57mi |
| 317 S 28th St Unit 3 McAllen, TX | 2.0 | 1.0 | 800 | $800 | $1.00 | 45d | 1 | 0.76mi |
| 317 S 28th St Unit 4 McAllen, TX | 2.0 | 1.0 | 800 | $750 | $0.94 | 45d | 1 | 0.76mi |
| 915-917 Galveston Ave Unit 917-3 McAllen, TX | 3.0 | 2.5 | 1455 | $995 | $0.68 | 45d | 1 | 0.98mi |
| 901 Galveston Ave Unit C McAllen, TX | 2.0 | 2.0 | 888 | $950 | $1.07 | 16d | 1 | 1.01mi |
| 2120 Date Palm Ave Unit B McAllen, TX | 3.0 | 2.0 | 1150 | $1,250 | $1.09 | 20d | 1 | 1.05mi |
| 3501 N 23rd Ln McAllen, TX | 2.0–3.0 | 1.5–2.0 | 1179 | $1,100 | $0.93 | 45d | 2 | 1.07mi |
| 1418 Beech Ave #16 McAllen, TX | 3.0 | 2.0 | 980 | $950 | $0.97 | 25d | 1 | 1.08mi |
| 601 Kennedy Ave McAllen, TX | 3.0 | 2.0 | 936 | $1,350 | $1.44 | 45d | 1 | 1.15mi |
| 317 N 28th St McAllen, TX | 2.0 | 1.0 | 950 | $825 | $0.87 | 25d | 1 | 1.17mi |
| 1901 S 38th St Unit 11 MCALLEN 78503 McAllen, TX | 2.0 | 2.0 | 880 | $920 | $1.05 | 45d | 1 | 1.19mi |
| 812 S 6th St Unit 4 McAllen, TX | 3.0 | 2.5 | 1360 | $2,000 | $1.47 | 25d | 1 | 1.19mi |
| 2401 Gumwood Ave W Unit 8 McAllen, TX | 2.0 | 1.0 | 868 | $525 | $0.60 | 45d | 1 | 1.20mi |
| 417 N 28th St Unit 8 McAllen, TX | 2.0 | 1.5 | 910 | $800 | $0.88 | 25d | 1 | 1.22mi |
| 608 Uvalde Ave Unit 2 McAllen, TX | 3.0 | 2.0 | 1250 | $1,950 | $1.56 | 45d | 1 | 1.24mi |
| 615 W Dallas Ave Apt A-16 McAllen, TX | 2.0 | 2.0 | 1069 | $2,350 | $2.20 | 22d | 1 | 1.24mi |
| 2500 S Ware Rd Unit 34 McAllen, TX | 2.0 | 1.0 | 730 | $800 | $1.10 | 45d | 1 | 1.41mi |
| 917 N 21st St McAllen, TX | 2.0 | 1.0 | 758 | $1,200 | $1.58 | 45d | 1 | 1.42mi |
| 700 Sunset Dr McAllen, TX | 2.0 | 2.0 | 1300 | $922 | $0.71 | 45d | 2 | 1.44mi |
Listing history 12 events
-
2026-06-07statusdays on market $127,000 Pending 92 DOM
-
2026-06-05days on market $127,000 Option 90 DOM
-
2026-06-03statusdays on market $127,000 Option 89 DOM
-
2026-06-02days on market $127,000 Active 88 DOM
-
2026-06-01days on market $127,000 Active 87 DOM
-
2026-05-31days on market $127,000 Active 86 DOM
-
2026-05-31days on market $127,000 Active 85 DOM
-
2026-03-06$127,000 Active 804-char remark
Show marketing remark (804 chars)
Investor Opportunity in Prime McAllen Location! Conveniently located just off the Expressway and 23rd Street, this property offers exceptional potential for investors looking for their next project. Built with durable cinderblock exterior walls, the home provides a solid structure and long-lasting construction — the perfect foundation for a renovation or rental investment. The property features a 3-bedroom, 1-bathroom layout, a covered porch area, and a storage shed in the backyard. Sitting on a generously sized lot in a highly desirable area, there is plenty of space and opportunity to increase value. While the home does need updating, its prime location, strong construction, and lot size make it an excellent candidate for a fix-and-flip, long-term rental, or value-add investment.
-
2026-02-01$135,000 Active
-
2025-08-26price $140,000
-
2025-08-13price $155,000
-
2025-07-19$165,000 Active
ⓘ Source: listings_history table (triggers on properties + properties_extension) + one-shot
backfill from property_details.listing_events for pre-trigger history.
Tax reassessment forecast TX · Resets to sale price
- Current annual tax
- $2,479 · $207/mo
- Projected year-2 tax
- $2,479 · $207/mo
- Expected delta
- $0/yr ($0/mo · 0.0%)
ⓘ Screening estimate from a state-policy table — verify with the county assessor before closing.
Climate risk First Street
- Flood 1/10 Low FEMA zone X · 0% chance over 30 yrs
- Wildfire 1/10 Low
- Heat 9/10 Extreme 7 d/yr ≥111°F today · 23 d/yr by 30 yrs out
- Wind 8/10 Severe 99% chance of damaging wind over 30 yrs
- Air quality 3/10 Moderate 1 unhealthy d/yr today · 4 by 30 yrs out
Nearby sold comps map
Loading sold comps map…
Walkable amenities ~0.75 mi
Loading nearby amenities…
Taxation est. · year 1
- Rental income
- $15,809
- − Mortgage interest
- −$7,114
- − Property taxes
- −$2,479
- − Insurance
- −$635
- − Repairs & maintenance
- −$1,265
- − Management
- −$1,265
- − Depreciation
- −$3,695
- Taxable loss
- −$643
- Est. tax savings @ 24.0%
- +$154
- After-tax cash flow
- $1,537/yr
For passive investors: Depreciation is non-cash, so a rental often shows a tax loss while cash-flowing — sheltering income. Rental losses are passive: they offset passive income freely, and up to $25,000/yr can offset ordinary (W-2) income if you actively participate and your MAGI is under $100k (phasing out to $0 by $150k); unused losses carry forward. On sale, claimed depreciation is recaptured at up to 25%, and gains may owe capital-gains tax (a 1031 exchange can defer both). Figures are a year-1 estimate at your 24.0% rate — not tax advice; consult a CPA.
Schools (NCES district)
- District
- Mcallen ISD
- NCES district ID
- 4829670
- Math proficiency
- 34% ▼ -22.00%
- Reading proficiency
- 45% ▼ -5.00%
- Median HH income
- $40,805
- Composite
- 33.16/100
- National rank
- #5551
- State rank
- #440 of 826 in TX
Livability — McAllen
- Score
- 76/100
- State rank
- #119
- US rank
- #3771
Category grades
Schools grade is shown separately in the Schools card above.
Census & demographics
- Census place
- McAllen, TX
- County
- Hidalgo County · 623,128 people
- City population
- 144,650
- Metro
- McAllen-Edinburg-Mission, TX
- Population (ZIP)
- 58,935
- Household income
- $48,071
- Rent vs Own
- Severe rent burden
- 3043.0
Population outlook (Hidalgo County) Hauer SSP2
- Today (2025)
- 955,232 people
- By 2030
- 1,009,774 · +5.7%
- By 2040
- 1,120,332 · +17.3%
- By 2050
- 1,225,036 · +28.2%
- By 2075
- 1,439,189 · +50.7%
- By 2100
- 1,533,429 · +60.5%
Race, ethnicity, and origin ACS 2023
- Neighborhood character
- Predominantly Hispanic (89%)
- Race & ethnicity
- Hispanic / Latino 89% Two or more races 32% White 8% Asian 2%
- Hispanic origin (detail)
- Mexican 85%
- Foreign-born
- 28% · Canada, Vietnam
- Languages at home
- 22% English-only · Spanish 76%
Political lean MEDSL · Hidalgo
- 2024 margin
- Toss-up / Even · D 48.1% · R 51.0%
- 2008→2024 swing
- -41.6pp toward R · 2008: 38.7pp · 2024: -2.9pp
- All cycles
- 2024: R+2.9 2020: D+17.1 2016: D+40.5 2012: D+41.8 2008: D+38.7
Not yet ingested
- Civics
- —
Market trends
- HPI YoY
- ▼ -69.99%
- Current HPI
- 230.0213
- Rent YoY
- ▲ 1.78%
- Metro
- McAllen-Edinburg-Mission, TX
- State GDP YoY
- ▲ 3.95%
- F500 in state
- 110
Industry mix (Fortune 500 HQ in TX)
| Industry | F500 HQs | Revenue |
|---|---|---|
| Energy | 16 | $1,198B |
|
||
| Technology | 5 | $198B |
|
||
| Engineering / Construction | 4 | $72B |
|
||
| Energy Services | 3 | $60B |
|
||
| Utilities | 3 | $41B |
|
||
| Healthcare | 2 | $330B |
|
||
Price history
-23.0% since first listed5 events — show timeline
- 2026-03-06 Listed $127,000 MCALLENMLS
- 2026-02-01 Listed $135,000 MCALLENMLS
- 2025-08-26 Price Changed $140,000 MCALLENMLS
- 2025-08-13 Price Changed $155,000 MCALLENMLS
- 2025-07-19 Listed $165,000 MCALLENMLS
Property tax history
+4.2%/yrLatest (2025): $2,479 · +16.7% YoY. Source: county tax records.
Cash-flow waterfall
monthlySold comps — $/sqft
last 12 mo · ≤1 miLoading sold comps…